I. INTRODUCTION
Uranyl peroxide nanoclusters are the only sizable group of actinide-based polyoxometallates (POMs). They are nano-sized cage-clusters with uranyl ions, UO2 2+, bridged through bidentate peroxide. The dihedral uranyl peroxide angle varies between 135 and 165°, and this curvature induces the formation of the cluster. Reference Sigmon, Ling, Unruh, Moore-Shay, Ward, Weaver and Burns1–Reference Burns and Hughes4 Dozens of nanocluster topologies exist containing from 20 to 124 uranyl metal centers in the cluster cage. Reference Sigmon, Ling, Unruh, Moore-Shay, Ward, Weaver and Burns1,Reference Burns, Kubatko, Sigmon, Fryer, Gagnon, Antonio and Soderholm5–Reference Qiu and Burns19 Uranyl peroxide nanoclusters are designated by the number of uranyl metal centers in each cluster; for example, U24 is a cluster with 24 uranyl metal centers. Reference Burns, Kubatko, Sigmon, Fryer, Gagnon, Antonio and Soderholm5
Hexavalent uranium in water forms a uranyl ion,
Reference Burns, Ewing and Hawthorne20
and in the presence of peroxide, uranyl peroxide nanoclusters may form.
Reference Burns21–Reference Armstrong, Nyman, Shvareva, Sigmon, Burns and Navrotsky23
In highly radioactive environments where spent nuclear fuel interacts with water (e.g., Fukushima Daiichi nuclear power plants where ground water is in contact with melted nuclear core), alpha radiolysis of water leads to the formation of peroxide.
Reference Burns21–Reference Armstrong, Nyman, Shvareva, Sigmon, Burns and Navrotsky23
Uranyl peroxide nanoclusters self assemble as metastable
Reference Armstrong, Nyman, Shvareva, Sigmon, Burns and Navrotsky23
anionic entities in aqueous solutions containing uranyl and peroxide; their charge is balanced by low-valence cations. For example, U60, a fullerene cluster (O
h symmetry), has a cluster formula of: [UO2(O2)(OH)]60,60− excluding templating counterions that are not bound to the cluster. If solutions containing U60 clusters and sufficient counter-cations for charge balance stand open to air, the U60 clusters precipitate in crystals during solvent evaporation. For example, a solution of uranyl nitrate, potassium chloride, hydrogen peroxide, and lithium hydroxide produces the U60-bearing compound: Li68K12(OH)20[UO2(O2)(OH)]60(H2O)310 (
 $Fm\bar 3$
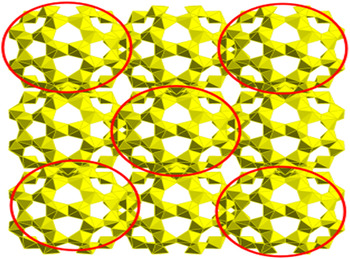
; a = 37.884 Å) (Fig. 1).
One unit cell (a = 37.884 Å, from the [100] direction) of the U60-bearing crystalline compound: Li68K12(OH)20[UO2(O2)(OH)]60(H2O)310 with Li, K, and H2O omitted for clarity. Cluster molecules circled are in-plane with the page.

Uranyl peroxide nanoclusters including U60 can be described over three different length scales and corresponding structural features that contribute to their material properties. On a local atomic scale, U60 clusters consist of 60 identical uranyl-peroxide-hydroxide hexagonal bipyramids that are covalently bonded
Reference Miró, Pierrefixe, Gicquel, Gil and Bo2,Reference Vlaisavljevich, Gagliardi and Burns3
through bent, edge-sharing interactions [Fig. 2(a)]. Clusters of U60 [Fig. 2(b)] consist of a network of uranyl-peroxide-hydroxide hexagonal bipyramids, and each U60 cluster is 2.5 nm in diameter. In solids, these clusters are nested within the long-range periodicity of a crystalline material, e.g., the isometric
 $\left( {Fm\bar 3} \right)$
Li68K12(OH)20[UO2(O2)(OH)]60(H2O)310
Reference Sigmon, Unruh, Ling, Weaver, Ward, Presspich, Simonetti and Burns8
[Fig. 2(c)].
Structural domains and relevant length scales in U60 polyoxometallates. (a) Bent uranyl peroxide bonds, giving rise to a (b) nm-sized U60 fullerene cluster, which packs into a (c) crystalline
 $\left( {Fm\bar 3} \right)$
arrangement extending to up to mm-sized single crystals. One unit cell (a = 37.884 Å) of Li68K12(OH)20[UO2(O2)(OH)]60(H2O)310 with Li, K, and H2O counterions excluded for clarity.

Uranyl peroxide nanoclusters exist in solids and liquids. Considerable effort has been focused on the behavior, speciation, and properties of uranyl peroxide nanoclusters in solutions. If crystals containing uranyl peroxide nanoclusters are dissolved in aqueous solutions, the clusters tend to exist as mono-dispersed molecular entities. Reference Flynn, Szymanowski, Gao, Liu, Burns and Fein24 In aqueous ionic solutions, they can be directed to form aggregates or “blackberries” of clusters. Reference Wallace25 Cluster formation can be induced in solutions mimicking the composition of dissolved spent nuclear fuel by adding peroxide to those solutions. Reference Wylie, Peruski, Weidman, Phillip and Burns26,Reference Wylie, Peruski, Prizio, Bridges, Rudisill, Hobbs, Phillip and Burns27 Due to their relatively large size, nanoclusters can be used to separate uranium from complex solutions using molecular-weight filters or porous membranes. Reference Wylie, Peruski, Weidman, Phillip and Burns26,Reference Wylie, Peruski, Prizio, Bridges, Rudisill, Hobbs, Phillip and Burns27 In aqueous solutions, uranyl peroxide nanoclusters have notably high solubility that is several orders of magnitude higher than uranyl minerals with similar compositions. Reference Peruski, Bernales, Dembowski, Lobeck, Pellegrini, Sigmon, Hickam, Wallace, Szymanowski, Balboni, Gagliardi and Burns28 In nearly all of the studies of uranyl peroxide nanoclusters to date, the nanocluster is the dominant form that persists in both solids and liquids. The medium-range (approximately 2.5 nm) ordered cluster is shown not only to persist in varied chemical environments but to be a structural backbone that does not change regardless of the chemical environment. Once formed, the clusters are remarkably persistent. Because of their unique structures, uranyl peroxide nanoclusters, like U60, are particularly interesting to study, as there are several structural adjustments, at different length-scales, by which these phases can respond to high pressure, high temperature, and irradiation.
Carbon fullerenes such as C60 and C70 have been the subject of high-pressure investigations, Reference Patterson, Catledge, Vohra, Akella and Weir29–Reference Wang, Liu, Li, Yang, Ding, Sinogeikin, Meng, Liu, Zeng and Mao37 but no actinide-based POMs have been studied at extreme pressures. In a recent study on C60 m-xylene, the high-pressure phase, which formed above 35 GPa, consisted of a hcp structure with amorphous, fragmented C60 clusters at each lattice site. The individual C60 molecules had lost their fullerene symmetry and had decomposed as a result of compression; however, the high-pressure phase still possessed long-range periodicity of the original arrangement of the clusters.
For uranyl peroxide nano-clusters, the structural response of the material to extreme environments can be investigated by observations of the long-range periodicity, the clusters themselves, and the local bonding environment of uranyl peroxides. Reference Wang and Fernandez-Martinez38–Reference Červinka41 In this study, we report the structural evolution of the U60-bearing crystalline compound: Li68K12(OH)20[UO2(O2)(OH)]60(H2O)310 at pressures up to 17.4 GPa.
II. METHODS
U60 clusters were synthesized, and the U60-bearing crystalline compound: Li68K12(OH)20[UO2(O2)(OH)]60(H2O)310 was grown by the method of Sigmon et al. Reference Sigmon, Unruh, Ling, Weaver, Ward, Presspich, Simonetti and Burns8 Crystals of Li68K12(OH)20[UO2(O2)(OH)]60(H2O)310 were harvested from their parent solutions and loaded into diamond anvil cells (DACs) for high-pressure analysis. A symmetric Mao-Bell DAC with 300 μm culet diamonds and cubic boron nitride and tungsten carbide seats (Almax easyLab Inc., Cambridge, Massachusetts) were used to compress the sample in a stainless-steel gasket with a 130 μm diameter sample chamber. Pressure in the DAC was measured using the ruby fluorescence method. Reference Mao, Bell, Shaner and Steinberg42 A methanol:ethanol solution (4:1 by volume) was added to the stainless steel sample chamber as the pressure-transmitting medium. Methanol:ethanol was chosen over silicone oil due to its better hydrostaticity and lower reactivity with the clusters. The hydrostatic limit of methanol:ethanol (4:1) is approximately 10 GPa. Reference Angel, Bujak, Zhao, Gatta and Jacobsen43 Gaseous pressure media (e.g., Ne, Ar, and N2) were not used due to the possibility of diffusion into the relatively porous nanocluster topology upon compression. Additionally, there are safety-related logistical obstacles in bringing gas-loaded uranium samples in DACs to synchrotron beamlines.
The diamond anvil cell is commonly used for in situ studies of micron-sized materials at high pressures (>10 GPa). Reference Bassett44 However, materials that are highly reactive, not well crystallized, or which have complex structures are difficult to analyze using the DAC due to constraints of geometry, sample size, and available instrumentation. Researchers have made progress in recent years characterizing the structures of complex crystalline materials at high pressure in DACs with powder X-ray diffraction (XRD) and spectroscopy—e.g., hybrid perovskites Reference Jaffe, Lin, Mao and Karunadasa45–Reference Jaffe, Lin, Beavers, Voss, Mao and Karunadasa48 and carbon fullerenes. Reference Patterson, Catledge, Vohra, Akella and Weir29–Reference Wang, Liu, Li, Yang, Ding, Sinogeikin, Meng, Liu, Zeng and Mao37 Some researchers have utilized conventional single-crystal diffractometers fit with DAC mounts to study complex two-dimensional and three-dimensional structures, Reference Patterson, Catledge, Vohra, Akella and Weir29,Reference Spencer, Kiran, Li, Ramamurty, Ross and Cheetham49–Reference Spencer, Soghomonian and Ross54 and similar systems at synchrotron sources are under development.
Structurally complex materials may therefore require further characterization with ex situ and/or destructive analytical techniques to fully characterize pressure-induced effects on their structures. Even if pressure-induced structural changes are irreversible upon decompression, the amount of material recovered from a single DAC experiment is less than the typical sample requirements for mass spectroscopy experiments.
Once loaded in DACs, samples were compressed incrementally at 1–2 GPa intervals for in situ Raman spectroscopy and XRD measurements. For in situ Raman spectroscopic measurements, the maximum pressure reached was 17.4 GPa. For in situ XRD measurements, the maximum pressure reached was 15.6 GPa. The samples were then decompressed incrementally to ambient pressure for further in situ Raman and XRD measurements.
In situ high-pressure Raman spectroscopy measurements were collected at Stanford University in the Extreme Environments Laboratory using a Renishaw RM1000 Raman microscope and 514.5 nm laser (Renishaw plc, Wotton-under-Edge, United Kingdom). The laser power was kept at 3 mW to prevent laser damage to the sample and measurements were taken for 90 s at each pressure point. The Fityk program was used for spectral analysis and peak fitting. Reference Wojdyr55
In situ high-pressure XRD measurements were collected at the Advanced Photon Source (APS) at beamline 16-BMD. The X-ray energy was 30 keV (0.4066 Å). The windows and apertures in the diamond anvil cell were covered with Kapton tape and Mylar film to enclose the sample and minimize the risk of radiation exposure if the DAC were to fail. Patterns were collected between 60 and 360 s per pressure point. The unit cell parameters were indexed using FullProf software (FullProf Suite, Institute Laue-Langevin, Grenoble, France), Reference Rodriguez-Carvajal56 and the pressure–volume (P–V) data were fit to a second-order Birch–Murnaghan equation of state (EOS) Reference Birch57 using the EOSFit7GUI software (Javier Gonzalez-Platas, Matteo Alvaro, Fabrizio Nestola, and Ross Angel). Reference Angel, Alvaro and Gonzalez-Platas58
Samples of compressed Li68K12(OH)20[UO2(O2)(OH)]60(H2O)310 were quenched to ambient conditions and recovered from DACs for ex situ analysis via Electrospray Ionization Mass Spectroscopy (ESI-MS). Seven quenched samples were necessary to obtain a high enough concentration of material for one ESI-MS measurement. For ex situ ESI-MS experiments, each sample was decompressed from a slightly different maximum pressure, which ranged between 16 and 20 GPa. ESI-MS experiments were conducted at the University of Notre Dame at the Mass Spectrometry and Proteomics Facility. Electrospray ionization mass spectra were recorded on a Bruker microTOF-Q II (Bruker Corporation, Billerica, Massachusetts) high resolution quadrupole time of flight spectrometer with a 3200 capillary voltage, 0.4 Bar nebulizer gas, 4 L/min dry gas, and 180 °C dry gas temperature, in negative-ion mode. The samples were introduced by direct infusion and scanned over 500–4000 m/z with data averaged over variable time intervals.
III. RESULTS AND DISCUSSION
A. Long-range periodicity and crystallinity: in situ X-ray diffraction
In situ synchrotron powder XRD was used to monitor pressure-induced changes to the long-range periodicity and crystallinity of the U60-bearing material: Li68K12(OH)20[UO2(O2)(OH)]60(H2O)310. At ambient conditions, this material is
 $Fm\bar 3$
(a = 37.884 Å).
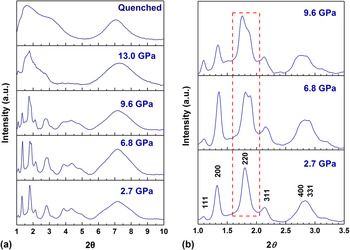
The large unit cell volume of Li68K12(OH)20[UO2(O2)(OH)]60(H2O)310 (a = 37.884 Å; V = 54,371 Å3; N = 4) and the geometry of in situ high-pressure synchrotron powder XRD measurements diminish the available reciprocal space and the resolution of the diffraction data. The diffraction maxima overlap at 2θ greater than 4° [Fig. 3(a)]. Furthermore, Li68K12(OH)20[UO2(O2)(OH)]60(H2O)310 is sensitive in protic solvents, so powders were deliberately left with a large (5–10 μm) grain size to decrease the surface area of the sample. However, the large grain size contributed to texturing effects and preferred orientation, so peak intensities could not be refined. Peak positions were obtained and indexed [Fig. 3(b)] based on the U60-bearing material published by Sigmon et al. Reference Sigmon, Unruh, Ling, Weaver, Ward, Presspich, Simonetti and Burns8 The resolution of the in situ data is diminished compared with an ideal powder diffraction pattern for Li68K12(OH)20[UO2(O2)(OH)]60(H2O)310 (Fig. S1), which is likely due to the sensitivity of the material in protic solvents and in air.
(a) In situ synchrotron XRD (λ = 0.4066 Å) of U60 compound: Li68K12(OH)20[UO2(O2)(OH)]60(H2O)310 at pressures up to 13 GPa and quenched from 15.6 GPa (b) Inset from (a) showing detailed diffraction in the low 2θ region. Pressure points are identical to (a). Dashed line outlines the (022) reflection, which splits, indicating the isometric → tetragonal phase transition.

At 2.7 GPa, the (220) peak is broad and shows a developing shoulder [Fig. 3(b)]. At 4.4 GPa, the XRD pattern for the U60-bearing material has changed, with the (022) peak of the cubic phase split, consistent with a transformation to a tetragonal structure [Fig. 3(b)]. From 4.4 to 8.6 GPa, the crystal structure of Li68K12(OH)20[UO2(O2)(OH)]60(H2O)310 retains a tetragonal structure that has not previously been observed at ambient conditions. Between 9.6 and 13.0 GPa, the diffraction features for Li68K12(OH)20[UO2(O2)(OH)]60(H2O)310 irreversibly [Fig. 3(a)] broaden, consistent with either amorphization or dissociation of the crystal into the pressure medium.
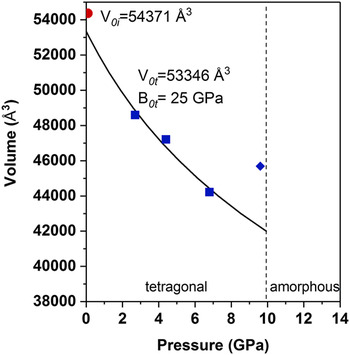
The unit cell volume of the U60-bearing material decreases with pressure until 8.4 GPa. Pressure-volume data were fitted to a 2nd order Birch-Murnaghan EOS. Reference Birch57 The fit (Fig. 4) shows a B0 of 25 ± 2 GPa, and a V 0 of 53,346 Å3 for the tetragonal material. This corresponds to a volume reduction of 1.9% as compared with the original cubic structure (V 0 = 54,371 Å3). The volume reduction may drive the slight change in the packing and periodicity of U60 molecules in Li68K12(OH)20[UO2(O2)(OH)]60(H2O)310 under compression. Between 8.4 and 9.6 GPa [Figs. 3(a) and 3(b)], all peaks shift to lower 2θ, corresponding to an increase in unit cell volume (Fig. 4). This indicates that the crystalline Li68K12(OH)20[UO2(O2)(OH)]60(H2O)310 may be incorporating the alcohol pressure medium into its structure and swelling. The diffraction data indicate that the long-range periodicity of the U60-bearing material is readily altered by the application of stress on the material.
Pressure–volume relationship of U60-bearing compound: Li68K12(OH)20[UO2(O2)(OH)]60(H2O)310 from ambient pressure to 9.6 GPa.

Overall, the compressibility of Li68K12(OH)20[UO2(O2)(OH)]60(H2O)310 from ambient pressure to 6.8 GPa shows a volume reduction of 18.6%. This figure includes the cubic (ambient conditions) and tetragonal structures. This study is the first on an actinide polyoxometallate at high pressure, so comparisons to other materials are difficult to make. Nonetheless, the compressibility of Li68K12(OH)20[UO2(O2)(OH)]60(H2O)310 is in the range of zinc imidazolate frameworks (20–60 GPa) and slightly higher than those of hybrid perovskites (7–20 GPa). Reference Jaffe, Lin, Mao and Karunadasa45–Reference Jaffe, Lin, Beavers, Voss, Mao and Karunadasa48 A recent study on a two-dimensional uranyl carboxyphosphonoate compound showed a bulk modulus of 18 GPa. Reference Lucovsky40 C60 molecules have an identical topology to U60 clusters, but the bulk moduli of isometric C60 crystals are typically estimated to be much higher than 25 GPa. Reference Wang, Liu, Li, Yang, Ding, Sinogeikin, Meng, Liu, Zeng and Mao37
B. Short-range order: in situ Raman spectroscopy
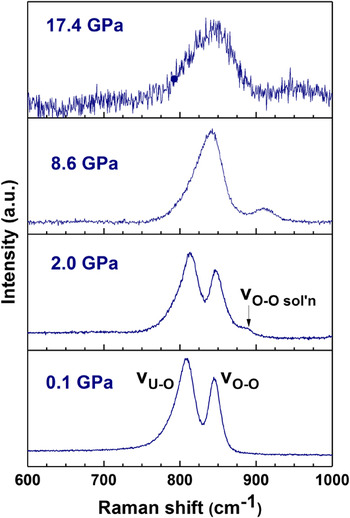
Raman spectroscopy was used to complement XRD and probe the short and medium-range structural changes to U60 clusters ([UO2(O2)(OH)]60 60− excluding templating counter-cations) in situ. Raman spectra of uranyl peroxide nanoclusters can be used to probe the connectivity of the clusters and the curvature of the uranyl peroxide dihedral angles. Reference McGrail, Sigmon, Jouffret, Andrews and Burns59 At ambient conditions, U60 clusters in the crystalline compound: Li68K12(OH)20[UO2(O2)(OH)]60(H2O)310 exhibit two Raman modes [Figs. 5(a) and 6]. One of these modes, νO–U–O at 805 cm−1, corresponds to a symmetric stretch of the uranyl cation. The peak position of the symmetric stretch of the uranyl cation is significantly higher in uranyl peroxide nanoclusters than in two-dimensional uranyl compounds, where is it typically evident at approximately 700 cm−1. Reference McGrail, Sigmon, Jouffret, Andrews and Burns59 This is due to the distortion of uranyl peroxide hexagonal bipyramids in cluster compounds, relative to two-dimensional structures.
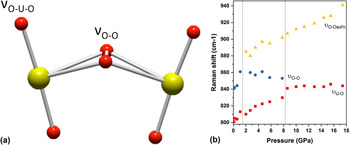
(a) Ball-and-stick model of uranyl peroxide unit, showing the bent edge-sharing interaction and labeled bonds responsible for Raman active modes modes νO–U–O, νO–O, and νO–O sol’n. (b) Plot of positions of νO–U–O, νO–O, and νO–O sol’n in U60 versus increasing pressure. Modes νO–U–O and νO–O overlap with increasing pressure beginning at the 8.6 GPa data point. Dashed lines show phase transition boundaries as indicated by in situ synchrotron XRD (Fig. 3).

Raman spectra of U60 in Li68K12(OH)20[UO2(O2)(OH)]60(H2O)310 at four selected pressure points. From bottom: ambient pressures, 2, 8.6, and 17.4 GPa. Modes present are the νO–U–O and νO–O modes, as well as the νO–O sol’n mode, which indicates the cluster interacting with the methanol:ethanol pressure medium.

The other evident mode, νO–O at 840 cm−1, corresponds to a symmetric stretch of the 〈O–O〉 bond from the bidentate uranyl peroxide interaction. McGrail et al. noted that this mode is present in multiple uranyl peroxide clusters and that its position correlates with the angle of curvature in the uranyl peroxide dihedral angle. Reference McGrail, Sigmon, Jouffret, Andrews and Burns59 Together, these modes reveal the chemical species present regardless of its physical state—crystalline or amorphous.
Between 0.1 and 1 GPa, the peak positions of νO–U–O and νO–O increase by 11.1 cm−1/GPa and 22.2 cm−1/GPa, respectively. At 2 GPa, a new third mode is evident in the Raman spectrum (Fig. 6). This band at 890 cm−1 is an additional peroxide stretching mode that appears in clusters that are either in the solution, or are not rigidly templated by counter-cations in crystallographic positions. Reference McGrail, Sigmon, Jouffret, Andrews and Burns59 The presence of this mode suggests a pressure-induced interaction between U60 clusters and the alcohol pressure medium. This mode is labeled as νO–O sol’n.
At 8.6 GPa, the νO–U–O and νO–O modes overlap, and νO–O sol’n is evident at ∼915 cm−1 (Fig. 6). At 17.4 GPa, above the pressure required for amorphization of the crystalline host material: Li68K12(OH)20[UO2(O2)(OH)]60(H2O)310, the Raman modes have broadened significantly, and νO–O sol’n has shifted to 950 cm−1 (Fig. 6). These Raman measurements, in combination with the XRD results, indicate that U60 clusters are likely still present in an amorphous solid or are in interaction with the alcohol medium. After decompression to ambient (0.1 GPa) conditions, the Raman modes of pristine U60 clusters in Li68K12(OH)20[UO2(O2)(OH)]60(H2O)310 could not be recovered (Fig. S2), indicating that the pressure-induced structural changes to the material are irreversible.
Figure 5(b) compares the positions of the three evident Raman modes with increasing pressure. At less than 1 GPa, the positions of νO–U–O and νO–O are around 805 cm−1 and 840 cm−1, respectively. Above 1 GPa, the positions shift to 815 cm−1 and 860 cm−1, respectively. At 2 GPa, the νO–O sol’n mode appears at 890 cm−1. The slope of increase of the νO–U–O mode between 2 and 8 GPa is 2.2 cm−1/GPa. The appearance of the νO–O sol’n mode and the discontinuity in slope in the νO–U–O mode suggests that the U60-bearing material undergoes a structural change between 1 and 2 GPa. A higher Raman shift indicates a shorter uranyl bond and a more bent uranyl peroxide dihedral angle. Reference McGrail, Sigmon, Jouffret, Andrews and Burns59 Conformational changes to the U60 nanocluster may drive the changes to the material’s long-range periodicity and packing as is evident in the XRD analysis.
Between 2 and 8 GPa, the positions of νO–U–O and νO–O sol’n increase with pressure with slopes of 2.2 cm−1/GPa and 3.3 cm−1/GPa, respectively. The increase in peak position indicates a shorter uranyl bond and a more bent uranyl peroxide dihedral angle from which bonds are interacting with the alcohol medium and are no longer rigidly templated with counter-cations—K and Li in the Li68K12(OH)20[UO2(O2)(OH)]60(H2O)310. The νO–O mode, representative of uranyl peroxide bonds within the U60 nanocluster that are templated by K and Li, reaches a maximum around 860 cm−1, before beginning to decrease in wavenumber between 6 and 8 GPa. This indicates a maximum in the bent angle of uranyl peroxide dihedral interactions in the Li68K12(OH)20[UO2(O2)(OH)]60(H2O)310 crystalline structure, which is achieved at approximately 5 GPa under hydrostatic conditions. McGrail et al., estimated this angle to be 115 ± 5° (versus 127 ± 5° in ambient conditions). After this point, the position of the νO–O mode decreases, indicating a relaxation of the dihedral angles, possibly caused by further interaction with the alcohol pressure medium.
Above 8 GPa, the absorption bands of νO–U–O and νO–O overlap and increase with a slope of 0.5 cm−1/GPa. The position ultimately reaches a maximum around 840–845 cm−1 at 10 GPa, indicating a maximally compressed uranyl bond. The position of νO–O sol’n continues to increase at a rate of 4.7 cm−1/GPa to a position as high as 940 cm−1 at 17.4 GPa, indicating that uranyl peroxide bonds in clusters that are not rigidly templated by counter-cations in the structure can independently undergo conformational changes.
C. Nano-scale order: electrospray ionization mass spectroscopy
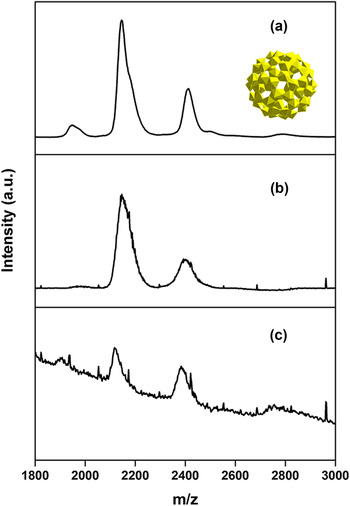
To investigate the nature of the compressed U60 nanoclusters, ex situ ESI-MS data were collected on samples of the quenched high-pressure amorphous phase (Fig. 7). ESI-MS can be used as a fingerprinting technique to determine whether nanoclusters are still present in a material or whether nanoclusters have decomposed or changed into a different molecule. Additionally, ESI-MS is sensitive to different uranyl peroxide nanoclusters—one can distinguish between U60 and U24, for example. Reference McGrail, Sigmon, Jouffret, Andrews and Burns59 In Fig. 7(a), the spectra show a signal from pristine U60 nanoclusters dissolved in water at a concentration of 5 μM. The dominant peaks around 1900, 2100, 2400, and 2800 m/z are a fingerprint of the U60 clusters. Reference McGrail, Sigmon, Jouffret, Andrews and Burns59 In Fig. 7(b), the solution from 7a was diluted in water significantly by a factor of ten to model a concentration more likely to be seen with the minuscule amount of material used in DAC experiments. The U60 nanocluster signal is present with a reduced intensity and peak resolution relative to 7a. Figure 7(c) shows ESI-MS spectra obtained from pressure-treated Li68K12(OH)20[UO2(O2)(OH)]60(H2O)310. Samples were taken to 16–20 GPa, compressed beyond the amorphous phase transition as indicated by XRD, and subsequently decompressed incrementally to ambient conditions. The spectra clearly indicate that the amorphous material still contains U60 nanoclusters that have not decomposed or changed into another type of nanocluster as a result of pressure-induced conformational changes to the cluster or by the amorphization of the surrounding structure.
ESI-MS of (a) U60 clusters dissolved in water, (b), ultra-low concentration of U60 in solution [from solution (a)], and (c) compressed U60 in Li68K12(OH)20[UO2(O2)(OH)]60(H2O)310 in methanol:ethanol, removed from DAC and gasket, and dissolved in water.

D. Pressure-induced changes to U60 clusters and Li68K12(OH)20[UO2(O2)(OH)]60(H2O)310
U60 clusters persist to high pressures at least several GPa higher than the amorphization pressure for the crystalline form: Li68K12(OH)20[UO2(O2)(OH)]60(H2O)310 (17.4 GPa versus 13 GPa). As the U60-bearing material was subjected to pressure, the atomic and nanoscale order of the clusters and uranyl bipyramids was preserved despite the loss of the long-range periodicity.
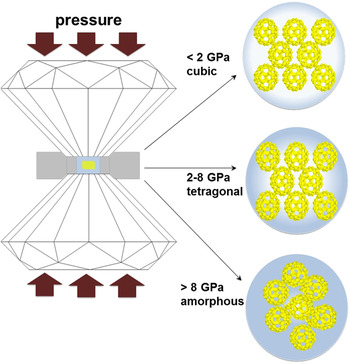
The sequence of structural changes in the U60-bearing material with increasing pressure is schematically illustrated in Fig. 8. At 2 GPa, Raman spectra indicated an interaction between U60 clusters and the pressure medium, as evidenced by the appearance of the νO–O sol’n mode. This interaction between the alcohol, nanoclusters, and crystal structure likely played a role in the subtle cubic-to-tetragonal transition (a = 36.6764(2) and c = 35.1672(4) Å). Additionally, the volume decrease—1.9% at V 0—from the cubic-to-tetragonal phase, as indicated by the equation of state, likely drove this transition.
The pressure-induced structural evolution of Li68K12(OH)20[UO2(O2)(OH)]60(H2O)310 in a DAC with 4:1 methanol:ethanol pressure transmitting medium. Cubic long-range structure below 2 GPa, tetragonal structure with pressure-medium interaction between 2 and 8 GPa, and amorphization + alcohol interaction above 8 GPa.

Between 2 and 8 GPa, XRD analysis indicates an overall compression of the unit cell of Li68K12(OH)20[UO2(O2)(OH)]60(H2O)310 by 18.7%. Raman spectroscopy indicated compression of the uranyl bond and bending of the uranyl peroxide dihedral angles in U60 clusters. However, Raman spectroscopy also indicated a relaxation of the U60 cluster’s dihedral angles in bonds associated with countercations—Li and K—in the structure between 6 and 8 GPa.
Between 6.8 and 9.6 GPa, XRD indicated a volume increase of the unit cell of Li68K12(OH)20[UO2(O2)(OH)]60(H2O)310. Raman spectroscopy suggests that this volume increase probably indicates swelling due to the strong interaction of the clusters with the methanol–ethanol pressure medium. Additionally, the X-ray amorphous transition between 9.6 and 13 GPa was likely driven by a strong interaction of U60 nanoclusters with the pressure medium, methanol:ethanol, which is nonhydrostatic above ∼10 GPa. The phase transition could be due to the nonhydrostaticity of the medium. However, the determination of the specific interactions of methanol:ethanol with the Li68K12(OH)20[UO2(O2)(OH)]60(H2O)310 would be very difficult. Given that the peak position of νO–O did not increase past 8 GPa, but the peak positions of νO–U–O and νO–O sol’n continued to increase to the highest pressure measured (17.4 GPa), this suggests that U60 clusters are conformationally able to compress past 8 GPa, if no longer bound to surrounding structure, and this is facilitated by interaction with the alcohol pressure medium.
The alcohol medium causes some degradation of crystals of Li68K12(OH)20[UO2(O2)(OH)]60(H2O)310 as some U60 clusters are found in the solution. This was visually observed in DAC experiments because the sharp crystal faces and edges became less sharp in the presence of the methanol–ethanol mixture. Additionally, the presence of the νO–O sol’n mode in the Raman spectra as pressure increased indicated a cluster–alcohol interaction. At higher pressures, the U60 clusters continued to interact with the pressure medium, and the crystalline material became amorphous or further incorporated with the medium. Importantly, the U60 clusters remained intact (Fig. 7).
Nano-scale uranyl peroxide clusters are known to persist in aqueous solutions at concentrations as high as 178,000 ppm U at ambient pressure-temperature conditions. Reference Peruski, Bernales, Dembowski, Lobeck, Pellegrini, Sigmon, Hickam, Wallace, Szymanowski, Balboni, Gagliardi and Burns28 Here, U60 nanoclusters may have interacted with the liquid medium at high pressures and may have been able to change their conformation without breaking bonds. The ESI-MS results demonstrated that rather than decomposing into smaller units, U60 nanoclusters existed beyond the irreversible amorphization of the crystalline phase (Fig. 7). Reference McGrail, Sigmon, Jouffret, Andrews and Burns59
This is the first study on uranium-bearing POMs at high pressure. Given that the U60 cluster’s persistence at high pressure is likely influenced by its interaction with the pressure medium, similar behavior may also be exhibited in other uranyl peroxide clusters with similar chemical formulas and solubility properties. U60 nanoclusters may behave differently in different pressure-transmitting media: helium, argon, or nitrogen gas, for example, which would likely diffuse through the U60 cluster’s icosahedral topology.
Uranyl peroxide nanoclusters are held together by strong covalent interactions. Reference Miró, Pierrefixe, Gicquel, Gil and Bo2,Reference Vlaisavljevich, Gagliardi and Burns3 This study shows that these interactions are stronger than the intermolecular forces that allow the clusters to crystallize in ambient conditions. This behavior is consistent with previous studies on uranyl peroxide nanoclusters in solids and liquids.
Very few studies on the structures of POMs at a high pressure exist. The inspiration for this study was a comparable study of a complex material with multiple ordered length-scales, Reference Wang, Liu, Li, Yang, Ding, Sinogeikin, Meng, Liu, Zeng and Mao37 C60 m-xylene. C60 m-xylene is identical in topology but obviously different in chemistry from U60. U60 nanoclusters are made up of a network of connected uranyl-peroxide-hydroxide units, whereas C60 involves the sp 2 bonding of a single element. Reference Haddon, Brus and Raghavachari60 C60 m-xylene was studied to pressures of 40 GPa and exhibited notably different behavior at high pressure compared to the U60-bearing material examined in this study. The hcp structure of C60 m-xylene was retained to 40 GPa, but at this pressure, the C60 molecules were fragmented. Reference Wang, Liu, Li, Yang, Ding, Sinogeikin, Meng, Liu, Zeng and Mao37 A long-range ordered structure was energetically favored over the formation of an amorphous phase of intact C60 clusters. In the case of U60, nanoscale order of the clusters was favored, as the U60 clusters persisted even beyond the breakdown of the long-range periodicity of the host phase. However, as in the case of U60, the molecules surrounding the C60, m-xylene, played a critical role in the ordering of the material at high pressures. The position of the m-xylene molecules between C60 cages is analogous to the presence of lithium, potassium, water, methanol, and ethanol in the Li68K12(OH)20[UO2(O2)(OH)]60(H2O)310. In the case of U60, when the solvent and crystals interacted, this was a driving force for phase transitions. In the case of C60, when the m-xylene was removed from the ordered high-pressure phase, the material amorphized within hours. Reference Wang, Liu, Li, Yang, Ding, Sinogeikin, Meng, Liu, Zeng and Mao37
IV. CONCLUSIONS
Uranyl nanoclusters, like U60, persist in a variety of chemical environments both in solutions and in solids. U60’s ability to exist in concentrated solutions may have allowed it to persist as a cluster at high pressure. Molecular crystals containing clusters and exhibiting long-, medium-, and short-range orders have been characterized before, Reference Martin, Goettler, Fossé and Iton61,Reference Roy, Lee, Crowther, Schenck, Besara, Lalancette, Siegrist, Stephens, Brus, Kim and Steigerwald62 but this study on the structural response of a uranyl peroxide nanocluster to high pressures demonstrates how length-scale, ordering, and chemistry can affect a material’s response to extreme environments. In the case of U60, the cluster, [UO2(O2)(OH)]60 60− excluding templating counterions, was the dominant structural feature to persist at high pressure. Although the crystalline Li68K12(OH)20[UO2(O2)(OH)]60(H2O)310 amorphized at <13 GPa, the U60 cluster persisted without decomposing or changing into a different phase at least to 17.4 GPa as determined by in situ Raman spectroscopy and to a pressure range of at least 16–20 GPa as determined by ex situ ESI-MS. This behavior stands in contrast to previous studies on similarly complex materials like C60 m-xylene, where a long-range ordered material with decomposed fullerenes at each lattice site was energetically favored over the formation of an amorphous phase of intact nanoclusters. The U60 interacted with the alcohol pressure medium, which may have enhanced the cluster’s ability to compress and deform, without decomposing at high pressures.
Supplementary Material
To view supplementary material for this article, please visit https://doi.org/10.1557/jmr.2017.301.
ACKNOWLEDGMENTS
This work was supported as part of the Materials Science of Actinides, an Energy Frontier Research Center funded by the U.S. Department of Energy, Office of Science, Basic Energy Science under Award #DE-SC0001089. KMT gratefully acknowledges funding from the Stanford VPGE, DARE program. Portions of this work were performed at HPCAT (Sector 16), Advanced Photon Source (APS), Argonne National Laboratory. HPCAT operations are supported by DOE-NNSA under Award No. DE-NA0001974 and DOE-BES under Award No. DE-FG02-99ER45775, with partial instrumentation funding by NSF. The Advanced Photon Source is a U.S. Department of Energy (DOE) Office of Science User Facility operated for the DOE Office of Science by Argonne National Laboratory under Contract No. DE-AC02-06CH11357. The authors thank Dr. Changyong Park and Dr. Curtis Kenney-Benson for their help setting up these experiments.