I. INTRODUCTION
Advances in microfabrication have made possible the miniaturization of the solid-state gas sensors based on a microhotplate platform. Reliable microhotplates, consisting of a micromachined membrane with integral heaters, thermometry, and electrical contacts are readily produced using complementary metal-oxide semiconductor (CMOS)-compatible processing.Reference Suehle, Cavicchi, Gaitan and Semancik1 The technical challenge for this class of devices is to develop solid-state sensing materials with improved sensitivity, chemical selectivity, response speed, and stability. Semiconducting metal oxides such as tin oxide (SnO2), zinc oxide (ZnO), titanium oxide (TiO2), and tungsten oxide (WO3) have been traditionally used as active materials in solid-state chemical gas sensing devices.Reference Weisz2–Reference Moseley4 Nanophase forms of these materials should be advantageous for gas sensing since a greater fraction of the material is surface exposed.Reference Chung, Lim, Lee, Miura and Yamazoe5
Studies involving synthesis and characterization of nanoparticles and one-dimensional (1D) nanostructures including nanowires and nanobelts of metal oxides have been reported. Ogawa et al.Reference Ogawa, Nishikawa and Abe6 measured the sensor responses from a dense SnO2 thin film and a porous nanoparticle film with a mean grain size of 7–12 nm, and found that the latter exhibited significantly higher sensitivity. Nanowire and nanotube (NT) structures are interesting because, like nanoparticles, a significant fraction of the sensing material is on the surface, but also the quasi-1D structure allows for a much lower electrical resistance along the length of the structure. Lower resistance can lead to better device performance because of the lower Johnson noise voltage V j = (4kTRΔf)1/2 where T is the temperature, R is the resistance, and Δf is the bandwidth of the sensing measurement. The gas sensing properties of nanowires of SnO2, WO3, In2O3, TiO2, and ZnO as well as nanobelts of SnO2 have been characterized.Reference Kolmakov, Chang, Cheng and Moskovits7–Reference Comini, Faglia, Sberveglieri, Pan and Wang12 The potential that metal oxide NTs have for gas sensing applications was demonstrated using a ceramic tube device of dimension 5 mm.Reference Liang, Chen and Wang13
Carbon nanotubes (CNTs) have been used as templates for the creation of metal oxide NTs using a variety of methods. NTs of Al2O3Reference Zhang, Liu, He, Zhang, Zhang and Zhu14 and Fe2O3Reference Sun, Yuan, Liu, Han and Zhang15 were obtained by mixing powdered oxide materials with CNTs and sintering. NTs of V2O5, WO3, MoO3,Reference Rao, Satishkumar and Govindaraj16, Reference Satishkumar, Govindaraj, Vogl, Basumallick and Rao17 SnO2,Reference Liang, Chen and Wang13, Reference Han and Zettl18 and Eu2O3,Reference Fu, Liu, Liu, Han, Wang, Hu, Cao and Zhu19 were formed by exposing acid-treated CNTs to liquid phase precursors followed by a calcining step at 350 °C. Aligned RuO2 oxide nanotubes were synthesized by first growing CNTs on porous anodic alumina to produce an array of CNTs, followed by a gas phase deposition of Ru metal at 300 °C.Reference Min, Bae, Jeong, Cho, Lee, Choi and Park20 NTs of TiO2 and SiO2 were prepared by exposing acid-treated CNTs to a sequence of metal halide and water vapor exposures, followed by calcining at 350 °C.Reference Gomathi, Vivekchand, Govindaraj and Rao21 SnO2 nanowires have been templated on arc-discharge CNTs by oxidizing a deposited layer of tin.Reference Hoa, Van Quy, Song, Kang, Cho and Kim22 SnO2-coated CNTs have also been prepared by a wet chemical process in which commercial CNTs were purified and dispersed into a tin chloride solution.Reference Jia, He, Guo, Chen, Meng, Luo, Li and Liu23
The motivation for this work was to develop a simple process combining synthesis and assembly of 1D metal oxide nanostructures directly onto the microhotplate platform. Recently, we discovered a generic approach to growing vertically aligned multiwalled CNT arrays on a wide range of metallic substrates using a bimetallic iron/alumina composite catalyst and acetylene as a carbon precursor, at growth temperatures between 550 °C and 600 °C.Reference Parthangal, Cavicchi and Zachariah24 This process enables the growth of CNT forests directly on microhotplates using the buried microheater as the primary heat source driving the growth. In this work, we use chemical vapor deposition (CVD) to coat the CNTs with metal oxide. Again, the microheater controls the growth so that in an array of microheaters different materials can be grown on different elements without the need for additional lithography; important for the development of electronic noses.Reference Cavicchi, Semancik, DiMeo and Taylor25 This method also protects any CMOS circuitry on the chip from high processing temperatures. The CNTs are removed by an anneal process. We compare the performance of SnO2 NTs with a SnO2 film grown by CVD without the CNT template and find an enhancement of the gas sensitivity.
II. EXPERIMENTAL METHODS
A. Substrates
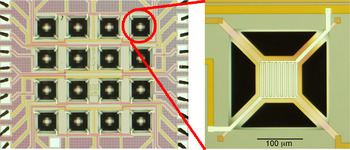
Both microhotplates and macrosubstrates were used for film growth and characterization studies. Microhotplates were fabricated using conventional CMOS processing, followed by a surface micromachining step.Reference Suehle, Cavicchi, Gaitan and Semancik1 Each element of the 16-element microhotplate array had a separately addressable heater and pair of interdigitated titanium nitride (TiN) electrodes. The array and a magnified view of a microheater is shown in Fig. 1. Each array chip was mounted in the well of a 40-pin dual in-line package and connections between the chip and package pads were accomplished with aluminum wirebonds. Prior to deposition, the interdigitated electrodes were sputter-cleaned using an Ar-ion beam. Macrosubstrates consisted of 1 cm2 pieces from a thermally oxidized silicon wafer.
Optical image of a 16-element microhotplate array and a zoom showing a single microhotplate. The broad lines leading into the suspended hotplate from the upper left and lower right make contact to the polysilicon microheater, which is underneath the interdigitated electrodes whose leads enter the hotplate from the lower left and upper right. The distance between pads is 2 μm.

B. Deposition
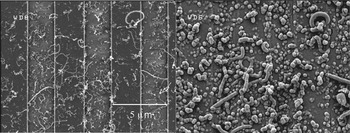
Two methods were used to deposit catalysts onto the substrates. For some samples, a sparse coating of size-selected nickel catalyst particles was deposited onto the microhotplates. Laser ablated particles were selected by size using a differential mobility analyzer (DMA). Particles exiting the DMA were sintered at 1100 °C to reshape them into uniform spheres, and charged positively using a unipolar charger. These charged particles were transported into the deposition chamber containing the microhotplate assembly. A high voltage (≈1–2 kV) was applied between the hotplates and the aerosol inlet carrying the particles, to create an electric field conducive for the deposition of charged nanoparticles onto the microhotplates. Particles of 30 nm in diameter were used to grow the CNTs in Fig. 2.
SEM images representing the same top view of sparsely grown CNTs (a) before and (b) after the growth by CVD of a SnO2 coating. The vertical stripes correspond to the interdigitated electrodes. Comparison of the two images shows evident thickening of identical NT structures.

To produce a more dense forest of CNTs, a 10 mmol/L aqueous solution containing equal proportions of iron nitrate [Fe(NO3)3.9H2O, ACS reagent, 98+%] and aluminum nitrate [Al(NO3)3.9H2O, ACS reagent, 98+%] was prepared and used as the catalyst solution for CNT growth. A drop of the catalyst solution was then placed over the chip containing the array and dried. This procedure also was used for the macrosubstrates.
For CNT deposition onto the microhotplate array, the package was secured to a fixture equipped with gas-inlet and exhaust lines. Gases were delivered to the well containing the chip on the top surface of the package. A seal around this well was made with a viton-O-ring. Mass-flow controlled gas lines carrying nitrogen (N2), hydrogen (H2), and acetylene (C2H2) were connected to the gas inlet. Gases were delivered at ambient temperature and atmospheric pressure. The microhotplate surfaces were individually heated to 600 °C, using the built-in heater of each array element. The gas flow consisted of an initial anneal step with 100 sccm N2 (1 sccm = 0.0167 cm3/s) and 30 sccm H2 for 2 min, followed by CNT growth using an additional 5 sccm C2H2 for 5 min, at 600 °C. CNT growth on macrosubstrates was accomplished using a tube furnace held at the same temperatures and with the same flow rates of gases as given previously.
As a reference, some of the microhotplates were left unheated during the CNT growth process and therefore were without CNTs. These reference devices would be useful in isolating the effects of the template only on the SnO2 sensing film, as the process conditions for SnO2 CVD were unchanged. Identical process conditions for the CVD growth will likely produce SnO2 of similar stoichiometry and total material amount if the CVD sticking coefficient is nearly unity.
The CVD of SnO2 was performed in a low-pressure, cold-wall reactor. The reactor was pumped down to ≈10−4 Pa using a turbo pump and brought back up to ≈20 Pa under the flow of N2. The sample was exposed to a flow of anhydrous tin nitrate [Sn(NO3)4] vapor for about 10 min to allow equilibration of gas flows within the chamber. Microhotplates were then individually heated to 375 °C for 20 s. The flow of Sn(NO3)4 was then shut off and the gases were pumped out for another hour to completely remove all reactants, before the chamber was brought up to atmospheric pressure in N2. The CNT templates were then removed completely by annealing the microhotplates in air at 450 °C for ≈8 h. The macrosubstrate samples were grown under the same flow conditions, with the substrate mounted on a hotplate inside the CVD chamber.
C. Characterization
The surface morphologies were imaged using a Hitachi S-8000 (Tokyo, Japan) scanning electron microscope (SEM) before and after SnO2 CVD. The surface chemical characterizations were performed on the macrosubstrate samples using a JEOL JAMP7830F scanning Auger microprobe (Tokyo, Japan) operated at 10 kV electron beam voltage and 1 nA beam current.
For transmission electron microscopy (TEM), samples were prepared from the macrosubstrates. SnO2-coated CNTs were scraped from the surface of the wafer and dropped onto a 50-nm-thick silicon nitride (SiN) membrane (DuraSiN, Electron Microscopy Sciences, Fort Washington, PA). The membrane was placed into a furnace and calcined in air for 2 h at 500 °C, sufficient to burn off the majority of the CNT template. This sample was then analyzed using an FEI Titan 80-300 TEM/STEM (Hillsboro, OR) operating in scanning TEM (STEM) mode at 80 kV and equipped with a double-hexapole, spherical aberration (Cs) corrector (CEOS GmbH, Heidelberg, Germany) for the probe forming lens. In addition, the instrument is outfitted with a STEM high-angle annular dark-field (HAADF) detector (Fischione Instruments, model 3000, Export, PA). It should be noted that the images presented may appear somewhat blurry when the capabilities of the aberration-corrected STEM are considered. However, this is due to the presence of the 50-nm SiN support membrane, which was nonetheless essential for carrying out the heat treatment procedure since a conventional thin-carbon support film would not have survived.
For gas sensor testing, methanol vapor was used as a model test gas. Methanol, like ethanol, acetone, and other organic vapors, is known to function as a reducing agent for SnO2, reacting with chemisorbed oxygen electron acceptors to release electrons to the conduction band of the SnO2.Reference Gajdosik26 Controlled mass flow rates of dilute methanol vapor and zero-grade dry air were delivered through a computer-automated delivery system. The test gas mixture flow direction was switched between a bypass line and into a fixture containing the microhotplate array using a three-way valve. The resistance between sensor pads of the hotplate was recorded with the devices operating at 300 and 400 °C. Measurements were made on both microhotplates containing SnO2 NTs and the reference containing SnO2 grown under identical conditions but without the CNT growth. The resistance data were converted to sensitivity, defined as the ratio of the change in sensor resistance upon exposure to methanol to the baseline resistance.Reference Kolmakov27
III. RESULTS AND DISCUSSION
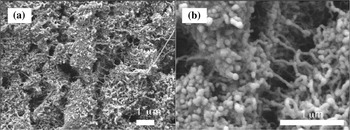
The SEM images of sparsely grown CNTs using size-selected catalysts grown directly on microhotplates are shown in Fig. 2(a). The CNTs were observed to have diameters between 30 and 50 nm and lengths between 1 and 4 μm. At these diameter scales, the nanotubes were multiwalled. The CNTs grown using the liquid catalyst have nominal diameters between 10 and 20 nm and lengths of the order of micrometers, representing a very high aspect ratio (L/D ≈ 104) [Fig. 3(a)]. The irregularities seen in the top view of the forests is attributed to catalyst film cracking during the H2 anneal step preceding CNT growth. However, the overall resistances of the CNT forests grown on several different microhotplates were observed to be in the range of 250–300 Ω, indicative of their metallic nature and excellent adhesion to the contact pads.
(a) SEM image representing the top view of CNTs grown directly on a microhotplate using a liquid catalyst. (b) SEM image of the same sample as (a) (but not the identical area) after SnO2 coating.

The templated nature of the SnO2 CVD growth is evident on the microhotplates with sparsely grown CNTs. Figure 2(b) shows the same area as Fig. 2(a) after the CVD growth. Individual CNTs can be clearly identified with enhanced thickness compared to the same CNT in Fig. 2(a). During the SnO2 CVD process on the CNT forests from the liquid-catalyst-dosed microhotplates, the sensor resistances marginally increased by ≈5 to 10 Ω depending on the time of deposition. Upon annealing the SnO2-coated CNT forests in air at 450 °C, the resistance across the sensor pads of the microhotplate increased steadily. The devices were observed to achieve stable baseline room-temperature resistances between ≈800 kΩ to 1 MΩ after several hours of annealing, representing the successful removal of the underlying CNTs. SEM images of the microhotplate surface following CNT removal are shown in Fig. 3(b) [though not the same area as Fig. 3(a)]. Remarkably, the surface morphology did not show signs of disintegration, maintaining the integrity of 1D structure. Energy dispersive x-ray spectra collected from these devices revealed peaks of Sn, Si, and Ti, the latter appearing from the substrate.
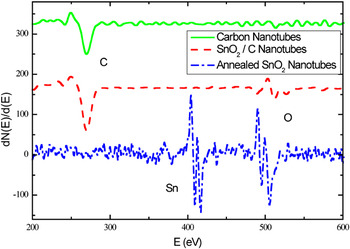
Auger electron spectroscopy confirms chemical changes in the CNT due to Sn(NO3)4 CVD and subsequent removal of the CNT template as shown in Fig. 4. The appearance of the oxygen feature (around 500 eV) following CVD is readily apparent; interestingly, the tin feature (around 430 eV) is weak. The electron escape depth at these energies (around 1 nm) is rather shallow,Reference Woodruff and Delchar28 therefore the appearance of tin features in energy dispersive spectroscopy and their absence in Auger could be due to signal attenuation by an adventitious carbon overlayer and oxide termination. The heat treatment in air to remove the CNT template resulted in the appearance of the tin feature. Also curious is the shape of the oxygen feature; a previous report of SnO2 Auger spectraReference Choi, Jung and Koh29 reveals no oxygen features above 514 eV; furthermore, assignment of these peaks to other elements known to be present in this system is inconsistent with published data.Reference Childs, Carlson, LaVanier, Moulder, Paul, Stickle, Watson and Hedberg30
Auger electron spectra of CNT sample grown on a macrosubstrate before (solid line) and after (dashed line) SnO2 coating, and after annealing in air (dot-dashed line) to remove the CNT template.

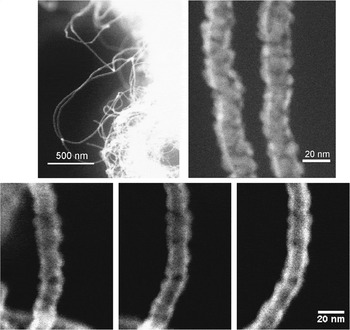
Representative results of the STEM-HAADF analysis are presented in Fig. 5. The low magnification image (top left) shows a number of tubes extending out from a dense, forestlike agglomerate composed of many individual tubes. The majority of these structures are 20 to 25 nm across. At higher magnification (top right), the STEM analysis reveals, to a certain extent, the polycrystallinity of the tubes and suggests that the structure of each is somewhat porous and open. In addition, the apparent intensity of the HAADF signal drops in the center of the structure relative to the perimeter. Because the STEM-HAADF image intensity mostly represents a projection of the combined average atomic number and thickness of the specimen at each image pixel, a greater intensity at the perimeter of the structure suggests that the interior is hollow.
Montage of STEM-HAADF images of SnO2 tube structures at low magnification (top left), high magnification (top right), and at varying specimen tilts with respect to the electron probe (bottom, −15°, 0°, and +15° from left to right). Enhanced brightness on the outer edges of the structure for all three imaging angles is evidence that the structure is a hollow NT.

To rule out the unlikely case that the SnO2 tubes are in fact “I-beam” or channel-type structures, with thick, vertical walls adjoining a thin, flat slab in the center, we have captured several images from the same tube at varying degrees of specimen tilt with respect to the beam (Fig. 5, bottom). Because the HAADF intensity is again seen to peak at the perimeter of the structure at all of the tilts examined, this confirms that the structure is tube-shaped, and that the tubes themselves exhibit a fairly uniform wall thickness (~5–6 nm).
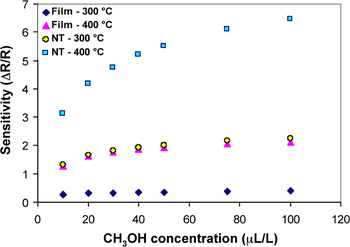
The gas sensing responses from the SnO2 NTs as well as the reference SnO2 thin film coated microhotplates to pulsed concentrations ranging from 10 to 100 μL/L (ppm) of methanol are shown in Fig. 6. The operating resistance value of the SnO2 NT film is much lower than values reported for undoped SnO2 NP sensing materials,Reference Sahma, Mädler, Gurlo, Barsan, Pratsinis and Weimar31, Reference Nayral, Viala, Fau, Senocq, Jumas and Maisonnat32 which were 1–100 MΩ. A comparative plot of the sensitivities of an NT sample and a thin film sample is shown in Fig. 7. The NTs presented much higher sensitivities than a thin film operated under identical conditions. The enhancement in sensitivity is likely due to the enhanced fraction of sensing material that is on the surface in the case of the nanotubes, compared to the thin film. The detected gas displaces oxygen ions, which act as electron trapsReference Moseley4 on the surface of the NTs. The reduction in traps gives rise to an increase in conductivity along the nanotube, both because of the released carriers and the reduction in negatively charged traps, which act to pinch off the conductance of the NT. This mechanism for tin oxide gas sensors generally produces devices that have good sensitivity, but limited chemical selectivity, because many reducing species can act to displace the adsorbed oxygen. Chemical selectivity is achieved through additional use of catalyst layers,Reference Lei, Jun, Mao, Xiong, Yang, Qi and Cui33–Reference Kim, Jun, Huh and Lee38 selection of operating temperatures in arrays,Reference Cane, Gracia, Gotz, Fonseca, Lora-Tamayo, Horrillo, Sayago, Robla, Rodrigo and Gutierrez39, Reference Dable, Booksh, Cavicchi and Semancik40 and temperature programmed sensing.Reference Cavicchi, Suehle, Kreider, Gaitan and Chaparala41 For temperature programming, the reduced resistance of the NT-based structure, compared to NP sensing materials, is advantageous. This results in a reduced resistance-capacitance time constant, allowing the sensing measurement to follow rapid temperature changes.
Gas sensing responses of SnO2 NTs to varying concentrations of methanol ranging from 10 to 100 μL/L (ppm). Methanol concentration is indicated by the stepped trace with axis on the right. Sensor response (axis on the left) at 300 °C is the upper trace and 400 °C is the lower trace.

Comparative plot of sensitivities (change in resistance divided by resistance in air) evaluated from SnO2 NTs and a SnO2 thin film operated under identical conditions as a function of methanol concentration ranging from 10 to 100 μL/L (ppm).

IV. CONCLUSIONS
In summary, we have successfully devised a simple scheme for the growth and integration of SnO2 NTs directly onto a microhotplate using CNTs as templates for gas sensing applications. A high-density of vertically aligned CNT arrays was grown directly on microhotplates using a bimetallic iron/alumina catalyst at 600 °C. The CNTs were then coated with a thin layer of SnO2 by CVD, and subsequently removed by annealing in air at 450 °C resulting in SnO2 NTs. The SnO2 NTs exhibited excellent gas sensing properties to trace concentrations of methanol and the sensitivities of the NTs were significantly higher than a SnO2 thin film operated under similar conditions. The synthesis process described may be used to create NT structures of any other metal oxide. Taking advantage of the thermal isolation between various elements of a microhotplate array, different metal oxide NTs may be grown on a single array, thereby providing a valuable approach toward the realization of a highly sensitive, microscale electronic nose.
ACKNOWLEDGMENTS
The authors acknowledge Christopher Montgomery for technical assistance with microhotplates. Certain commercial equipment, instruments, or materials are identified in this document. Such identification does not imply recommendation or endorsement by the National Institute of Standards and Technology, or does it imply that the products identified are necessarily the best available for the purpose.