In this article, we draw on ideas from the US realignment literature to look at British politics in terms of the temporal alternation of political power.Footnote 1 We believe that cycling is an important concept with applications to politics outside the United States.Footnote 2 In our view, cycles of party dominance provide context to historical patterns and provide a background structure upon which short-term effects such as economic conditions and the personality of leaders may be superimposed. For example, if one can show that homeostatic processes appear to underlie political competition, then projections of party dominance (such as Newt Gingrich’s view that the 1994 congressional election results in the United States heralded a period of very long-term Republican control at all levels of government) will be met with the scepticism that they deserve, and (b) identification of cyclic patterns can permit more reliable accounting for patterns of political competition.
To apply the idea of cycling to the British context, we must take into account the complications caused by the fact that while British politics was largely two-party politics from 1832 to the present, the rise to power of the Labour party – which replaced the Liberals as the main opposition to the Conservative Party over a period centred on about 1920 – gave rise to a three-party system; with the modern era as largely one of a three-party system where we have two large parties and one small party that does not consistently offer candidates throughout the nation, and which is highly inefficacious in translating its votes into seats.Footnote 3
However, despite the complications caused by seeking to apply US inspired realignment models to the case of multiparty competition, in two important ways it is actually easier to apply such models in Britain than in the United States. First, in the United States we need to distinguish evidence on realignment derived from presidential elections from that derived from House and Senate elections. This distinction has given rise to ongoing disputes among American electoral scholars as to whether realignments must simultaneously happen in both presidential and congressional elections, or whether various lags must be built into the model for one or the other type of contest, or whether data from one type of contest is to be given definitional priority. Because Britain has a parliamentary system (and because only the lower chamber has up to now been elected), this type of problem of potentially conflicting sources of data on which to judge realignment does not arise. Secondly, and relatedly, because Britain is (or rather, at least until very recently was) a unitary system, in looking at realignment in Britain, we do not need to worry about the vexing problem of differences in how realignments play out in the various state legislatures as compared to the national parliament. In one important way, however, the United States and Britain are similar: both use single-member districts with first-past-the-post balloting. We believe it is striking that we find party cycles of similar length and pattern in the United States and Britain, despite the conventional view that the American party system is unlike that of virtually every other industrial society in that it does not feature highly disciplined parliamentary parties and, for the last 150 years, has had only two parties with strength in the legislature.
Our questions in this article are twofold. First, do regular cycles in party strength occur in British politics – and if so what is the mean cycle length? Secondly, if such ebbing and flowing has occurred, what political forces might account for these patterns, and can we expect similar forces to have such effects in the future?
In the next section, we describe the evidence about changing party strength over time in which we seek to discern cycles. We also address some important methodological questions, such as whether seats or votes should be used to evaluate party strength, how the transition from Liberal to Labour party prominence (as well as other third-party effects) should be handled, and how endogeneity resulting from the power of governing parties to time elections to their advantage should be dealt with. In the succeeding section, we look at possible causes of the cycling we have found.
Evidence for cycling
Party Seat Share in the United Kingdom: 1832–2005
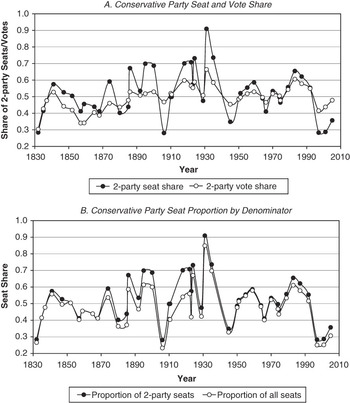
In Figure 1, we present time-series plots of major-party parliamentary strength in the United Kingdom over the period 1832–2005, which encompass the full historical period to date since the expansion of the franchise that began with the Reform Act.Footnote 4 We focus on the Conservative party, as it has persisted as a major party throughout the study period from 1832 to 2005. The identity of the second major party, however, is time-dependent and is defined here as the party other than the Conservatives with the highest number of seats/votes, i.e., the Liberal party from 1832 to 1918 and the Labour party from 1922 to 2005. The plots in Figure 1A depict the major-party seat shares and vote shares, respectively, of the Conservative party.
Historical time-series for the United Kingdom, 1832–2005 Note: No interpolation or smoothing has been performed.

In order to compare the empirical observations to the projections of the two-party voter-interaction model presented later in this study, we focus first on the two-party breakdown of seat/vote shares between the Conservative party and the Liberal/Labour party (with either Liberal or Labour as the second party depending on the year). The Conservative proportion of the two-party seat/vote share, however, tends to inflate the strength of that party, particularly for the period during which the opposition transitioned from Liberal to Labour. To gain perspective on the analysis, we also consider the Conservative proportion of all-party seats/votes as a measure of the independent strength of the Conservative party over time. Plots in Figure 1B compare Conservative party seat shares between the two-party and all-party assumptions. These plots suggest, as expected, that the choice of denominator (seat shares of the two main parties or, alternatively, of all parties) is of greatest importance during the transition years in which the Labour party rose to prominence.
The party distribution of nationally aggregate vote totals – as opposed to seat shares – suggests a somewhat different pattern, with the time series of vote totals displaying less regularity than that of seat shares. We believe that seat share is a more reliable indicator of party strength because seat share, not aggregate vote share, determines dominance in parliament and hence is the ultimate goal of each party. In particular, the aggregate vote totals include many constituencies that were not contested, particularly before about 1910, or in which there was no serious contestFootnote 5 and in which the proportions of the constituency vote received by each party may be misleading. The single-member-district system in the United Kingdom leads inevitably to wasted votes in some constituencies and an inherent bias in the translation of votes into seats.
Since the governing party can call elections, the timing of elections is partially endogenous to election prospects,Footnote 6 although there is now a five-year limit on the length of time between elections.Footnote 7 This is not a problem in determining the existence of dominant periods by spectral analysis – the initial statistical method used below – because the analysis makes no claim about the cause of any patterns that may emerge. It simply determines whether a (dominant) periodicity exists, whatever its cause may be. With regard to the length of periods, however, endogenous timing tends to exaggerate and potentially extend the strength shown by the governing party. A governing party suffering waning strength may be able to hang on until the end of its term, whereas a governing party experiencing temporary strong support in mid-term may call an election immediately in order to lock in a full additional term. These strategies may extend hegemony (half-cycles) a few years, but do not prevent an eventual reversal of fortune followed by control by the opposition party, which in turn may find the same opportunities to stretch its hegemony. Thus, the existence of cycles – and whatever rough regularity they may exhibit – appears unaffected by endogenous timing, although the length of cycles may be marginally increased. Calling elections when a government is perceived to be strong, furthermore, may increase the amplitude of each major party’s performance relative to its mean performance (above the mean for the governing party and below the mean for the opposition).
A more significant difficulty in tracking and interpreting party support in the United Kingdom arises because of frequent splitting and reorganization of the parties, including major-party coalitions. As early as 1846, the Conservatives split over repeal of the Corn Laws, with a free trade faction (the Peelites) defecting to the Liberals (formerly Whigs). The Peelites (under the Liberal–Conservative banner) formed a coalition with the Liberals (Whigs) in 1852. The Liberals themselves suffered splits over Irish home rule in 1885–86 and again in 1900 over policy in South Africa. From the mid-1880s to Irish independence at the end of the second decade of the twentieth century, Liberal support in Ireland varied greatly depending on support for nationalist parties. During the First World War, the Liberals participated in grand coalitions with the Conservatives, first when Herbert Henry Asquith invited Conservatives to provide support and then with David Lloyd George as prime minister in a coalition dominated by the Conservatives. During the early 1920s, the Liberals splintered and were hardly a major player again until the latter half of the century. During the Second World War (well after the election of 1935), a grand coalition developed involving this time Labour and the Conservatives.
Because spectral analysis depends on data at equally-spaced time points and British elections are not equally spaced, the Conservative proportions of the seats/votes have been linearly interpolated at equally-spaced time points, thereby obtaining estimates of the state of the system at these interpolated points. We realize that these are only estimates, as the actual state of the system may not have moved linearly from one election to the next. We are, however, most interested in long-term patterns that may be less affected by short-term errors. Since the mean time duration between elections is (2005–1832)/(44–1) = 4.02 years, the time points are placed at four-year intervals, resulting in the time points 1832, 1836, 1840, …, 2004, i.e., forty-four time points.
Spectral Analysis Periodograms
In order to investigate possible periodicity in the seat and vote shares of the Conservative party, we perform a spectral analysis – a procedure that decomposes the pattern of seat (or vote) shares over time into a spectrum of cycles of different lengths, just as a prism separates white light into a spectrum of colours of different wavelengths or frequencies.Footnote 8 The output of such an analysis is conventionally represented by a periodogram, a plot that emphasizes the dominant frequencies (or, alternatively, cycle lengths) that make up the time series spectrum. Specifically, a periodogram plots on the Y-axis the squared amplitude corresponding to a cycle length against that cycle length on the X-axis, i.e., the relative strength of the contribution of each associated frequency to the overall pattern of the time series. The peaks in the plot represent the strongest frequencies in the (Fourier) decomposition of the time series; reciprocals of these frequencies represent the corresponding strongest periods or cycle lengths reflected in the time series.
Since the time series of interpolated data is recorded every four years, each of these cycle lengths must be multiplied by four to obtain cycle lengths in years. Note that a ‘period’ represents a complete cycle, such as a duration of Conservative ascendancy plus a duration of Liberal/Labour ascendancy, i.e., the time for the political landscape to return to a specified state. Hence, the average duration that one party is in power is half a period as defined by the periodogram. Note that each position on a periodogram integrates information equally from the entire historical period. The x coordinate represents a cycle length (reciprocal of a frequency) while the y coordinate represents how strongly that cycle length is reflected in the pattern shown by the data.
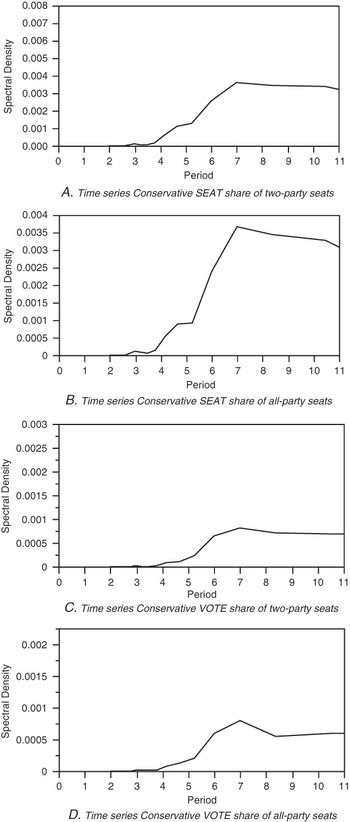
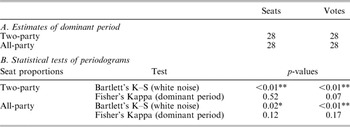
Since our interest is in longer-duration periods, we first smooth the data, using a centre-weighted moving average, defined by replacing each value st by  . Smoothing depresses the amplitude of the shorter cycles, permitting any longer cycles to stand out; technically, this operation is called a low-pass filter, because it permits cycles of low frequency (i.e., longer cycles) to pass through.Footnote 9 Periodograms constructed from the smoothed data are presented in Figure 2.Footnote 10 For example, the highest peak in the periodogram for the Conservative seat share occurs for a cycle length of about x = 7 interpolated time points, or about 4 × 7=28 years. In turn, this means a shift from one party to the other, on the average, about every fourteen years. Of course, this represents an average and is approximate, but overall the plot suggests that there is more evidence of a cycle of about twenty-eight years than cycles of any other period. For both seat and vote shares, the durations of the most prominent periods as estimated from the periodograms are each about twenty-eight years (see Table 1A), whether Conservative strength is measured in seat share or vote share and whether the denominator is the two-party or the all-party total.
Spectral analysis for the United Kingdom interpolated for 1832–2004 in four-year intervals and smoothed Note: Seat/vote proportions are for the Conservative party throughout, which are interpolated to time points at four-year intervals from 1832 to 2004 and smoothed using a centre-weighted moving average by replacing each value  by
 . In each plot above, the spectral density peaks at about 7 units, suggesting cycle lengths of about 4 × 7 = 28 years. Each series has been detrended and a 10 per cent taper has been applied.

Statistical Tests for Spectral Analysis and Estimation of Dominant Periods for Interpolated Data for the United Kingdom: 1832–2005

Notes: Estimates of a dominant period in Table 1A employ a low-pass filter; test statistics in Table 1B are based on analysis of periodograms from unsmoothed data. Data are based on Conservative party seats/votes as a proportion of the two major parties and of all parties. The opposition major party was defined as the party other than the Conservatives with the highest number of seats/votes, i.e., the Liberal party 1832–1918 and the Labour party 1922–2005. Bartlett’s Kolmogorov–Smirnov tests were used for testing the null hypothesis of white noise; Fisher’s Kappa tests were used to determine whether the most dominant period was statistically significant. *Significance at the 0.05 level; **significance at the 0.01 level.
Two hypothesis tests were performed on the corresponding periodograms, using unsmoothed data.Footnote 11 First, Bartlett’s Kolmogorov–Smirnov statistic tests whether the time series is distinct from pure randomness, by computing the absolute distance between the cumulative periodogram and the cumulative distribution for a uniform distribution (the latter represents the expected value for white noise).Footnote 12 All Bartlett’s test statistics (for seat and vote shares and for two-party or all-party assumptions) were significant at the 0.05 or 0.01 level, indicating that pure randomness is consistently rejected. Fisher’s Kappa statistic tests whether the most prominent period observed is statistically significant, by determining whether the largest amplitude in the periodogram (which represents the most prominent period) differs significantly from the mean amplitude.Footnote 13 Fisher’s Kappa tests are not significant at the 0.05 level. Thus, spectral analysis for seat share is mixed: white noise is generally rejected, but dominant cycles are not statistically significant (see Table 1B and Figure 2). Later, we further assess the evidence for cycling using the vote-interaction model developed below.
Yule, in an effort to account for random disturbances, suggests an alternative method for estimating the lengths of dominant cycles by regressing the time series on its first and second lags, then solving the resulting finite-difference equation and determining the period of the solution of this equation.Footnote 14 This second-order autoregressive method is cited by Lebo and Norpoth, who applied it to British data from 1929 to the present.Footnote 15 Application of the Yule method to the time series of interpolated Conservative two-party seat share over the period 1832–2004 yields a period of about thirty years; similar analysis for all-party seat shares yields a period of about twenty-nine years. Restriction to 1928–2004, roughly the era analysed by Lebo and Norpoth using the Yule method,Footnote 16 provides estimates of twenty-seven years for two-party proportions and twenty-eight years for all-party proportions.Footnote 17 Although the coefficient of the second lagged variable in the autoregression is not statistically significant, the Yule estimates of cycle length along with those from spectral analysis consistently point towards values in the range of twenty-five to thirty years. This robustness in our parameter estimates under a variety of different statistical techniques gives us greater confidence that a half-cycle of party dominance of about thirteen to fifteen years is empirically well supported for the United Kingdom.
We turn now to the development of a dynamic model that represents our attempt to demonstrate that a simple negative-feedback loop involving only one dimensional political competition can generate the evidence for cycling that we have discussed above, and thus may account, in part, for an important feature of British political history.
Accounting for cycling: a voter–party interaction model
Early modelling of change in party vote share was done by Alesina, Londregan and Rosenthal and by Erikson, all of whom focused on the partisan business cycle in American politics, which incorporates effects of economic growth on elections.Footnote 18 Lin and Guillén, focusing on change in party control of the American presidency, used spectral analysis for the period 1828–1992 to estimate ‘pseudo periods’ of about twenty-six years.Footnote 19 These authors modelled party control as a renewal process (a discrete analogue to reliability theory), concluding that the hazard rate of defeat rises over time, leading to more cyclical behaviour than would be expected if party turnovers depended entirely on randomly-spaced critical events. Carlsson and Karlsson, using a moving-average model based on generational behaviour, estimated a cycle length of twenty-five years;Footnote 20 whereas Midlarsky, using time domain analysis for 1860–1980, obtained an estimate of twenty-eight years.Footnote 21 Berry et al. argue that American politics follow a 50–60 year Kondratiev long-wave cycle,Footnote 22 although there are four distinct phases over the course of the long wave that are virtually identical to two smaller 25–30 year cycles that match the rest of the literature cited here. Using spectral analysis for the period 1854–2006, we have elsewhere estimated cycle lengths of from twenty-six to twenty-eight years for party vote for the American presidency and for party seat share in each chamber of Congress.Footnote 23 We have also obtained similar estimates for cycle lengths by fitting our voter–party interaction model by least squares. Thus, a number of authors – using a range of methods – have obtained remarkably similar estimates of cycle lengths for American party politics, all in the range of 25–30 years, estimates remarkably similar to those we (and others) obtain for British elections.Footnote 24
Here, to account for why cycling might occur, we adapt the interaction model between voters and parties we have introduced earlier for American politics.Footnote 25
The Voter–Party Interaction Model
Our purpose is to model the political forces that can account for cycling in party strength. Following the theoretical work of Downs,Footnote 26 numerous studies have documented the importance of issues and ideology to both voters and parties. Choice of a party with like-minded views on issues or with an ideology similar to that of the voter has been shown to be a significant component of voter decision making. At the same time, parties have policies they hope to implement, as well as a need to adopt policies that can attract a winning vote share. For simplicity, we consider a one-dimensional spatial model of electoral competition and assume that parties have policy-seeking motivations. Thus, each party or candidate faces a trade-off between, on the one hand, advocating policies near its ideal point representing a preferred policy position that it can hope to implement if it is able to form the government and, on the other hand, positioning itself nearer the median voter in an effort to enhance its chances of success. Accordingly, there are centrifugal as well as centripetal forces influencing party position. In our earlier work, we have postulated four principles for the interaction between the electorate and the political parties:Footnote 27
• First, each party has policy motivations to move towards its ideal point over time (a centrifugal force).Footnote 28
• Secondly, in its desire to win, each party is willing to move incrementally from its present position in the direction of the median voter position by an amount that is proportional to its distance from the median voter (a centripetal force). This assumption is an extension of the logic of DownsFootnote 29 and implies that, other things being equal, when the median voter is to the left of centre, the Conservative party makes a larger adjustment than the Labour/Liberal party – an action that is consistent with empirical research by Adams et al., who find that parties shift towards public opinion when the latter shifts away from the party’s position.Footnote 30 An analogous argument applies when the median voter is right of centre. The assumption is also consistent with the results of Hobolt and Klemmensen, who find that British party leaders shift their policy positions in the direction of the median voter’s location (in the previous election) and that the shift is greater if the distance between a party leader’s position and the median voter is greater.Footnote 31 The trade-off implied by our first and second assumptions is embodied in Equations 1 and 2 below.
• Thirdly, the party in power may enjoy an advantage in the next election – due in part to government control over election timing – that is independent of the spatial distance between party and voter positions (see Equation 3 below).Footnote 32
• Fourthly and finally, voters – at least those near the centre of the voter distribution and hence the median voter – move away from the position of the party in power, by an amount proportional to the distance between the median voter and the party’s position (see Equation 4 below). In other words, swing voters, including the median voter, may react negatively to policies implemented by the party in power, and increasingly so as the median voter diverges further and further from the government position.
This fourth assumption is consistent with the observations of a number of scholars who draw their inspiration largely from American politics. These scholars include Arthur Schlesinger Jr, who found cycles in the liberal and conservative mood of the American polity and observed, ‘As political eras, whether dominated by public purpose or private interest, run their course, they infallibly generate the desire for something different’.Footnote 33 Similarly, Stokes and Iversen suggest several forces, in addition to movements of the business cycle, that tend to restore rather than disrupt party balance,Footnote 34 including greater voter response to governmental mistakes than successes, ability of an out-party to make more flexible and extravagant promises, vulnerability of the in-party to splits as its majority grows,Footnote 35 alternating moods of liberalism and conservatism, and a popular belief in rotation in office. Bartels and Zaller, who are analysing American politics, not only suggest that the longer the out-party is out, the more likely it is to nominate appealing candidates, but they also suggest that voters may react over time to the party in power because innovative political leaders may give way to less skilful successors, seasoned advisers may burn out, and scandals accumulate, while the governing party faces increasingly intractable problems after dealing with the easier issues.Footnote 36 In line with this approach, the thermostatic model associated with Wlezien – a model that has been well supported in the United States – suggests that voter preferences move counter to the ideological direction of the government, as voters react to governments that – pursuing their own ideological goals – find themselves out of step with their constituents.Footnote 37
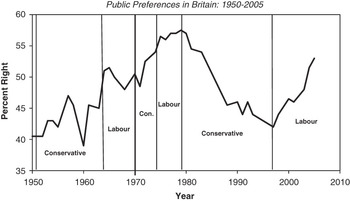
There seems no reason why the numerous homeostatic factors tending to promote alternation in power identified by scholars studying American politics would be restricted to political competition in America. Indeed, Bartle, Dellepiane and Stimson develop a time series of voter preferences in Britain (see Figure 3),Footnote 38 which they compare with the expectations of the thermostatic model.Footnote 39 They find that model fit is simple and straightforward from 1974 to the present: voter preferences moved to the right under Labour (1974–79 and again 1997–2005), whereas they moved left under the Conservatives (1979–97). Bartle et al. note that at first sight the public mood does not appear to move in accord with thermostatic predictions during the previous period of 1951–74. They point out, however, that during 1951–64: ‘the Churchill, Eden, Macmillan and Home Conservative governments … did many “Labour things”, increasing spending on the NHS, education and the welfare state as well as giving the trade unions a greater role in the mixed (corporatist) economy.’ Similarly, during 1964–70, Wilson’s Labour government ‘was forced to introduce “cuts” in spending and tried to take the first faltering steps to curb trade union power’. Furthermore, Left–Right estimates of party platforms of the party in government by the Comparative Manifesto Project were nearly all left of centre during 1951–70, whichever party was in power.Footnote 40 During this period, Bartle et al.’s measure of policy preference, ignoring some zigs and zags, moves generally towards the right. Thus, if we interpret the thermostatic model as predicting that voter mood reacts to actual government policy rather than simply to the stereotypical image of the party in power, politics in this earlier period conforms largely to the thermostatic model.Footnote 41
Voter Preference in the United Kingdom Source: ‘Percent Right’ is from Bartle, Dellepiane and Stimson (‘The Moving Centre’) and personal communication from John Bartle. ‘Percent Right’ is the percentage of ‘Right’ preferences out of the total of ‘Left’ and ‘Right’ preferences on domestic issues, scaled using the Dyad Ratios algorithm (Stimson, Public Opinion in America). Periods of party control of the government are indicated.

We assume, furthermore, that there is uncertainty about the location of the median voter;Footnote 42 specifically, the median voter is represented by a probability distribution. We introduce the following notation:
PC = Preferred (ideal) position of the Conservative party.
PL = Preferred (ideal) position of the Liberal/Labour party.
M(t) = Expected value of the median voter distribution at time t.
C(t) = Position of the Conservative party at time t.
L(t) = Position of the Liberal/Labour party at time t.
As the parties attempt to resolve the tension between their incentives to win vote share by moving towards the median voter,Footnote 43 while at the same time advocating their preferred policy positions, the party movements may be modelled as:

and

where the terms M(t)−C(t) and M(t)−L(t) represent the signed distance from the expected median voter position to the party position, α is the median convergence parameter and β is the party policy-motivation parameter.
We assume that the Conservative vote share is the proportion of voters who are nearer the Conservative position, plus an in-party effect that aids the Conservatives when the model projects that they control the government and detracts when they do not. Similarly, the Conservative seat share is assumed to be determined by the proportion of voters who are nearer the Conservative position, plus an in-party effect that aids the Conservatives when – according to the model – they constitute a majority and detracts when they do not. Specifically, the (expected) Conservative seat share in the election (t + 1) is the quantity E(t + 1) given by

where γ is the in-party advantage parameter and σV is the standard deviation of the voter distribution. We assume that the voter distribution is normally distributed, where Φ denotes the standard cumulative normal distribution function. Finally, the movement of the median voter away from the position of the incumbent party is modelled as:

where δ is the voter reaction parameter and

so that the term W(t)−M(t) represents the signed distance from the incumbent party’s position to the (expected) position of the median voter. The Voter–Party Interaction Model is defined by Equations 1–4. We set the party ideal positions to PL = −1 and PC = 1.Footnote 44
To summarize, the model involves four parameters:
α = median convergence parameter
β = party policy-motivation parameter
γ = in-party advantage parameter
δ = voter reaction parameter.
Model Fitted to British Election Data, 1832–2005
Analytic solution of the four simultaneous non-linear difference equations developed in the previous section is difficult if not intractable. Instead, we fitted model projections statistically to the observational data of party seat shares, using smoothed values for both empirical data and model projections to estimate the parameters of the voter-party interaction model.Footnote 45 Any set of values of the parameters α, β, γ, δ and the phase shift determines a time series using those parameters and generated by model Equations 1–4, just as a set of regression parameters determines a regression equation and associated predicted values for all observations in the dataset.
Before fitting the model, we detrended the raw time series and introduced a dummy variable to take account of the transition era during which both the Liberal and Labour parties received significant seats and votes while Labour strength waxed and that of the Liberal party waned. This dummy variable is equal to 1 for the years around transition, 1916–32, and 0 for the non-transition years, 1832–1912 and 1936–2004. Thus, model fitting was applied to the residuals obtained when the raw time series is regressed on both the linear trend over time and the dummy transition variable. We refer to the model thus adjusted for linear trend and the dummy transition variable as the Full Model. We employed an iterative method to choose model parameter estimates to minimize the sum of least square errors between the theoretically projected time series and the empirical time series.Footnote 46
The endogeneity problem discussed earlier is also relevant in the voter-interaction model. To avoid assessing the state of the system at time points determined endogenously, we perform model projections at equally-spaced time points as indicated above, even though the actual elections were not held in those years. We project the state of the system at these equally spaced time points, fitting the model by least squares deviations between the model projections and the interpolated actual election results.Footnote 47 As we have noted, the fact that governing parties try to call elections at times when temporary effects are favourable to themselves suggests that there is an added benefit to incumbency beyond the traditional ones, so that the in-party (incumbency) parameter γ introduced above should be somewhat higher than it might be if governing parties had no control over election timing.Footnote 48
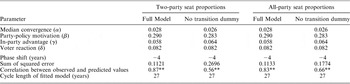
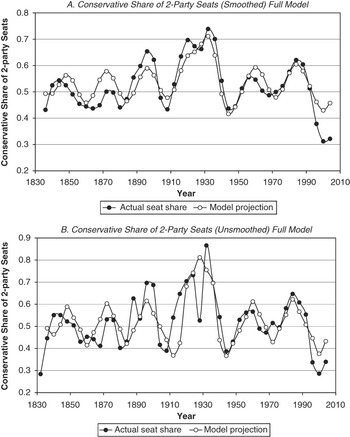
Estimated parameters for the Full Model for seat share are presented in Table 2; model projections along with the empirical time series are presented in Figure 4A. Model fit for seat share appears quite plausible visually and the correlation between observed and model projected values is significant, and does not depend on whether two-party or all-party proportions are used.Footnote 49 The model suggests a definite cyclical pattern with a cycle length that averages about twenty-seven years, although it varies from about twenty-four years during the periods 1832–96 and 1960–2004 to about thirty-two years for the period 1896–1960.Footnote 50
Parameter Estimates for the Voter–Party Interaction Model: Seat Share in the United Kingdom, 1832–2004

Notes: The Full Model specifies a dummy variable to account for the transition period (1916–32) in addition to a linear trend and the 4-parameter voter–party interaction equations. Model projected cycle length varies from 24 years for the periods 1832–96 and 1960–2004 to 32 years for the period 1896–1960; the mean cycle length in both models is 27 years. Seat proportions are for the Conservative party throughout, which are interpolated to time points at 4-year intervals from 1832 to 2004 and smoothed using a centre-weighted moving average by replacing each value  by
 [
 for the most recent time point]. The symbol (**) indicates that the correlation between model prediction and the empirical data was significantly positive at the 0.01 level.
Model fits for smoothed and unsmoothed seat share for equally-spaced time points: United Kingdom, 1832–2004 Notes: Seat proportions are for the Conservative party throughout, which are interpolated to time points at 4-year intervals from 1832 to 2004 and (in part A) smoothed using a centre-weighted moving average by replacing each value  by
 . The Full Model specifies in addition to a linear trend a dummy variable to account for the transition period: 1916–32. The model fits for seat share demonstrate a strong cyclicity. By contrast, time series plots for vote share (as opposed to seat share) do not appear periodic, either for two-party or for all-party proportions, and are omitted; parameter estimation for vote shares is unstable.

The usual R 2 statistic for the proportion of variance explained is not available for assessing model fit (because the relevant sums of squares are not additive). Instead, we use as our measure of model fit the correlation between the observed values and the values predicted by the model. (In a linear regression, this statistic is, when squared, the familiar R 2.) As indicated in Table 2, this measure of model fit for the Full Model is 0.87 and 0.83 for the two-party and all-party proportions, respectively, suggesting strong evidence for cycling. Both of these correlations are significant at the 0.01 level.Footnote 51
Adjustment of the model by replacing the constant in-party advantage parameter by a variable parameter (which decays exponentially while each government is in power) yields a small reduction (about 4 per cent) in the sum of squared error, small changes in parameter values, and a positive parameter value for decay. We prefer the more parsimonious model without this extra parameter.Footnote 52
Alternatively, fitting the model with no smoothing of either data or model projections yields parameter estimates that differ from those obtained with smoothing at most by 0.004 and generates estimates of cycle lengths of twenty-seven years, the same as those obtained by using smoothed data (see Table 2). The model fit for unsmoothed data (using two-party seat share) is presented in Figure 4B and in general visually tracks the empirical time series; the corresponding plot (not shown) for all-party seats is similar. As expected, without smoothing, the sums of squared errors of the fitted models are substantially larger, while the correlations between observed and predicted values are smaller (0.68 and 0.69 for two-party seats and all-party seats, respectively), but still statistically significant.
Overall, both the data (smoothed or unsmoothed) and the model projections suggest a fairly regular pattern of cycles in Conservative strength, with a peak about 1840 before the split over the Corn Laws, a minor peak in the 1870s followed by a stronger one in the 1890s when the Liberals suffered splits, and a more extended but less regular peak in the 1920s and 1930s during the transition from the Liberals to Labour. Finally, the plots portray a relatively weak peak in the 1950s and a strong peak in the 1980s during the Thatcher Government.
Model Fitted to British Election Data for the 1950–2005 Period Only
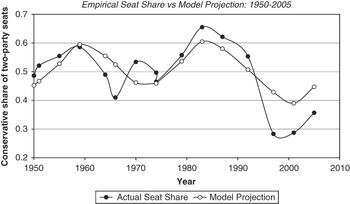
It can be instructive, as was suggested by a referee of an earlier version of this article, to compare the empirical record during the past decades with the model projection. The most recent Conservative electoral hegemony began with their rise to power in 1979. Conservative seat share reached its peak in the mid-1980s, after which it declined with increasing rapidity amid disillusionment and scandal during the 1990s until Labour won a striking victory in 1997 under Tony Blair. The Labour margin held strong through the election of 2001 but decreased in the election of 2005.
A detailed comparison between the empirical time series and model projections (based on unsmoothed data) for the 1950–2005 period – which includes the current cycle described above – is presented in Figure 5. The plots illustrate that the model projections track the actual seat share rather closely throughout this era even without smoothing, except for a brief stretch around 1970. Furthermore, as illustrated in Figure A3 in the Web Appendix, since the mid-1960s the location of the median voter projected by the voter–party interaction model has closely tracked public preferences as estimated by Bartle, Dellepiane and Stimson.Footnote 53
Model fits for unsmoothed seat share for election years: 1950–2005 Notes: Empirical and model projections are from unsmoothed data; model projections for election years were obtained by interpolation from projections at 4-year intervals. Model parameters are estimated from the entire 1832–2005 study period.

Comparison to Alternative Models
Are there alternative factors that might account for party patterns and that provide alternative/complementary explanations to the thermostatic approach we have made use of here? Initially, we confirmed that our four-parameter model does not achieve spurious fits to random data with correlations at all comparable to that obtained when fitted to real data. We show, however, that even a reduced two-parameter voter-interaction model could be capable of approaching the fit we obtained with the full four-parameter version.Footnote 54
Perhaps the most commonly mentioned substantive factor that might drive the political pattern is the national economy, either objectively measured or as perceived by voters.Footnote 55 However, economic factors alone do not fully capture the cyclic patterns we have demonstrated, although, like other authors, we do find that economic factors are related to incumbent success. For example, Lewis-Beck finds significant effects of economic perceptions on support for the incumbent party in Britain, while Lewis-Beck and Paldam report that economic changes explain about one-third of the change in the vote.Footnote 56 Powell and Whitten find that growth of gross domestic product (GDP) is significantly related to electoral success for countries whose governments are perceived to have clear responsibility, as is the case in Britain.Footnote 57 Duch and Stevenson summarize findings that economic voting for the incumbent government is relatively high in Britain.Footnote 58 Wlezien, Franklin and Twiggs, however, re-analyse the study by Lewis-Beck and find that evidence of the effects of economic perceptions on vote choice was substantially overstated due to endogeneity.Footnote 59 Similarly, Evans and Anderson find that vote choice affects economic evaluations more strongly than economic evaluations affect vote choice.Footnote 60 Sanders and Gavin find that economic evaluations derive more from media presentations than from objective changes in the economy;Footnote 61 Clarke, Stewart and Whiteley find that personal economic expectations and emotional reactions to national economic conditions may affect party support.Footnote 62 In a cross-national analysis, Hellwig finds that the effects of growth in the GDP on the incumbent vote are weaker in older democracies and in parliamentary polities, particularly those with more polarized parties.Footnote 63 He also provides evidence that governments successfully use election timing to avoid blame for poor economic performance.
Regression analysis for the sixteen elections from 1950 to 2005 shows that the projection of the voter–party interaction model is strongly related to the Conservative seat share (p < 0.001) with an R 2 of 0.62 (no smoothing was used in this analysis). Adding the one-year growth in GDP (while controlling for interaction with the government in power) improves the R 2 only to 0.71 (with even less improvement in adjusted R 2), and the additional independent variables are not statistically significant. Figure 5 plots both the empirical and model-projected Conservative seat share versus election year for this era, illustrating that the empirical data generally track the cyclical behaviour predicted by the model. Regression on GDP growth alone for the 1950–2005 era (while controlling for incumbency), however, explains only a fraction (R 2 = 0.14) of the variation in incumbent seat share.Footnote 64 Moreover, even in so far as economic factors explain political movement, they simply replace the question ‘Why do political cycles occur?’ with the question ‘Why do economic cycles occur?’ In any event, far from claiming that cycles explain all fluctuations in party strength, we suggest merely that determining cycles (and offering a thermostatic rationale for why they might occur) may provide a background against which other factors (party decisions, charismatic leaders, economic forces and wartime exigencies) are superimposed.
A second alternative – an autoregressive model – although seemingly parsimonious, does not directly specify the political forces that underlie party strength. Furthermore, under an autoregressive model, the projection of the dependent variable for each time point depends not only on the parameters of the model but also on the immediately preceding values of the dependent variable itself. Projected values of the voter-interaction model, by contrast, depend on the data only via the model parameters. Once these parameters have been estimated, the projected values of the entire series are self-generating. Given that an autoregression model projects each value directly from recent data, we might expect its projections to correlate more strongly with the actual dependent variable than the projections of the voter-interaction model. The reverse, however, is the case: for the Conservative party proportion of two-party seats, correlation between actual and projected values for the autoregression model is 0.60; the corresponding correlation for the voter-interaction model is 0.68. What we believe is the explanation for the superior fit of our model is that it incorporates not just the immediate past, but also homeostatic factors that create a time-dependent path.
Discussion
We recognize that the empirical accuracy of the modelling developed in this article is limited by a number of factors, such as the existence of parties other than the major two, the change in identity of the Conservative party’s main opposition, endogenous election timing and changes in the socio-demographic make-up and ideology of the parties over time. Nevertheless, we have provided evidence for ebb and flow in party strength as measured by seat shares over an extended period of British history. Our spectral analysis of the seat shares in parliament over a period of one and three-quarter centuries suggests evidence for cycles with a cycle length averaging about twenty-eight years.
The second contribution of this article is to suggest how a parsimonious model of voter and party motivations and behaviour can generate such a pattern of stable oscillation. Our adaptation of our earlier voter–party interaction model offers a plausible fit to the time series of Conservative party seat share from 1832 to the present – a fit that is further improved by incorporating a dummy variable for the period of transition from Liberal to Labour prominence, which is taken to be 1916–32.Footnote 65 In order to model cyclic patterns, that model incorporates party motivations to resolve a trade-off between seat maximization and desired policy, the effects of in-party advantages (from both electoral prospects and election timing), and voter reaction to the party in power and to its policies. The fit of this model is good, considering that there are more than forty data points with only four parameters (and a choice of phase angle), and we can provide a better fit than either a model using only economic data or one that is purely autoregressive in form. Also, the voter–party interaction model suggests gradual rather than abrupt changes in party control and, as we have seen, the empirical record is compatible with this expectation.
The voter-interaction model offers a political mechanism that can help explain the observed oscillation of party strength as voters move away from the party in power, while parties dance between their own preferences and those of the voters. Moreover, the cycles that our model implies are a natural part of the political process, rather than being driven solely by exogenous forces. Note that we are not claiming that the voter–party interaction model predicts the future in detail, but rather that a model generated from a few parameters estimated from historical data can describe a generally regular pattern over a long historical period and that that general pattern might be expected to persist.Footnote 66 Of course, we would also emphasize that models such as ours are intended to provide baseline (cyclic) trends, but what happens in any given election period will depend upon factors that, by definition, are not in the long-run historical model.
Given the differences between the United States and Britain (for example, a presidential system with fixed election times versus a parliamentary system where incumbents can call new elections, and dramatic differences in the historical importance of third parties), it is remarkable how similar our estimate of a full cycle averaging about twenty-eight years is to the estimates of cycle length for American data such as those we found in earlier work for the president and the two houses of Congress.Footnote 67 But we also wish to address the claim that, in both the United States and Britain, models of cycling, however useful for understanding historical patterns, are less relevant or even inappropriate today. In the United States, many authors have noted a weakening of the strength of party identification, as indicated by the growth in the number of those who identify as independents and the rise in split-ticket voting patterns, and various students of American politics have proposed that the notion of realignment be replaced with the idea of dealignment. Similarly, because of the relatively strong voting strength exhibited by the Liberal-Democrats in recent decades, and the rise of regional parties, it might seem that we are in a period in which the two major parties may be weakened in Britain, and so studying cycles of dominance between the two leading parties may be rather beside the point.
But, in the United States, very recently, party identification has been on the rise and split-ticket voting on the decline, and there is now strong evidence for the continuation of post-1932 realignment cycles, for example, with 1994 being one such inflection point.Footnote 68 Similarly, even as we recognize the importance of third (and fourth, etc. parties) in British politics,Footnote 69 there are good reasons to see the study of cycling as very much still relevant to understanding British politics.
With regard to party dominance (as opposed to individual party identity), the last thirty years has been a period of unusually pronounced party strength, first by the Conservative party and more recently by Labour, as each has in turn held huge majorities in parliament. And it is seats as our measure of party strength that we focus on in this article. Starting about 2008, Labour consistently trailed the Conservatives in public opinion polls by 10–20 percentage points, and in fact in the general election of 2010 received significantly less seats than the Conservatives, although the latter found it necessary to form a rare coalition with the Liberal-Democrats in order to govern. Thus, Britain has gone through a complete cycle of ebb and flow in thirty-one years, in close accord with the 28–30-year projection of our model.
 , where st is the value in year t. We have used smoothed values because we wish to focus on long-term cycles. Calculations were performed with a time increment of four years.