


1. Introduction
Glathrate air-hydrate crystals, substituting for air bubbles in the deeper layers of polar ice sheets at high load pressures and low temperatures, were first predicted by Reference MillerMiller (1969), and then observed by Reference Shoji and LangwayShoji and Langway (1982, Reference Shoji and Langway1987) in available ice cores from Antarctica (Byrd) and Greenland (Dye-3, Camp Century). Understanding of the unique natural phenomenon of the air-phase-state transformations in ice remains one of the key objectives of paleoclimatic interpretations of atmospheric air-content and gas-composition records obtained in deep-ice-core studies.
Further detailed optical-microscope investigations of the air bubbles and air hydrates were performed on fresh ice cores from Vostok station, East Antarctica (Reference Barkov and LipenkovBarkov and Lipenkov, 1984; Reference LipenkovLipenkov, 1989; Reference Lipenkov and SalamatinLipenkov and Salamatin, 1989; Reference Uchida, Hondoh, Mae, Lipenkov and DuvalUchida and others, 1994a), and continued in laboratory experiments (Reference HondohHondoh, 1989; Reference Hondoh, Anzai, Goto, Mae, Higashi and LangwayHondoh and others, 1990; Reference Uchida, Hondoh, Mae, Duval, Lipenkov, Maeno and HondohUchida and others, 1992,Reference Uchida, Hondoh, Mae, Duval and Lipenkov1994b; Reference Ikeda, Uchida and MaeIkeda and others, 1993; Reference HondohHondoh, 1996). The new data were examined on the basis of mathematical modelling and scale analysis in Reference Salamatin, Hondoh, Uchida and LipenkovSalamatin and others (1998b). It was shown that the rate-limiting step of the conversion of air bubbles, occluded in ice, to air hydrates was the nucleation of the hydrate crystals. The latter process is primarily responsible for a large (several hundred meters thick) transition zone where pre-existing air bubbles and clathrate air-hydrate crystals coexist in polar ice sheets. For example, first air-hydrate crystals at Vostok are found at 550 m depth where the bubble supersaturation (the difference between the bubble pressure and the hydrate dissociation pressure) is about 1.2 MPa. The entire transformation of air bubbles to air hydrates takes the time period τz ∼30 ka and proceeds to 1250 m depth, where the last bubbles disappear at the supersaturation of about 6.2 MPa.
The model simulations in Reference Salamatin, Hondoh, Uchida and LipenkovSalamatin and others (1998b) are restricted to the case when air hydrate, after nucleation, rapidly coats the bubble wall and then grows as a spherical hydrate shell, filling up the bubble. This type of conversion, denoted in Figure 1 as type A, was dominant in the laboratory observations of secondary air-hydrate growth in air cavities formed due to the decomposition of the initial hydrate crystals after ice-core recovery (Reference Uchida, Hondoh, Mae, Duval, Lipenkov, Maeno and HondohUchida and others 1992,Reference Uchida, Hondoh, Mae, Duval and Lipenkov1994b). The following two counterparts of the transformation have been described mathematically: (1) the diffusive air- and water-mass transfer through the hydrate layer in opposite directions, and (2) hydrostatic compression of the bubble confined to the hydrate shell and surrounding ice, both plastically deformed under the excess load pressure. The model constrained by the laboratory experiments allows us to estimate the typical time-scales of these processes (hereafter denoted as τD and τc, respectively), which can be of the same order of magnitude at relatively high laboratory temperatures. However, extension of these results to the extreme conditions (low temperatures) of central Antarctica leads to the following ratios between the timescales downward in the transition zone:

Two types of air-bubble-an-hydrate transformation. Here rc is the radius of a spherical ice cell influenced by nitrogen (qN2) and oxygen (qo2) mass fluxes from neighbouring air bubbles and air hydrates, rb is the equivalent-sphere radius of the an bubble, and rh is the radius of the bubble-hydrate complex; Vb and Vh are the bubble and hydrate volumes, respectively
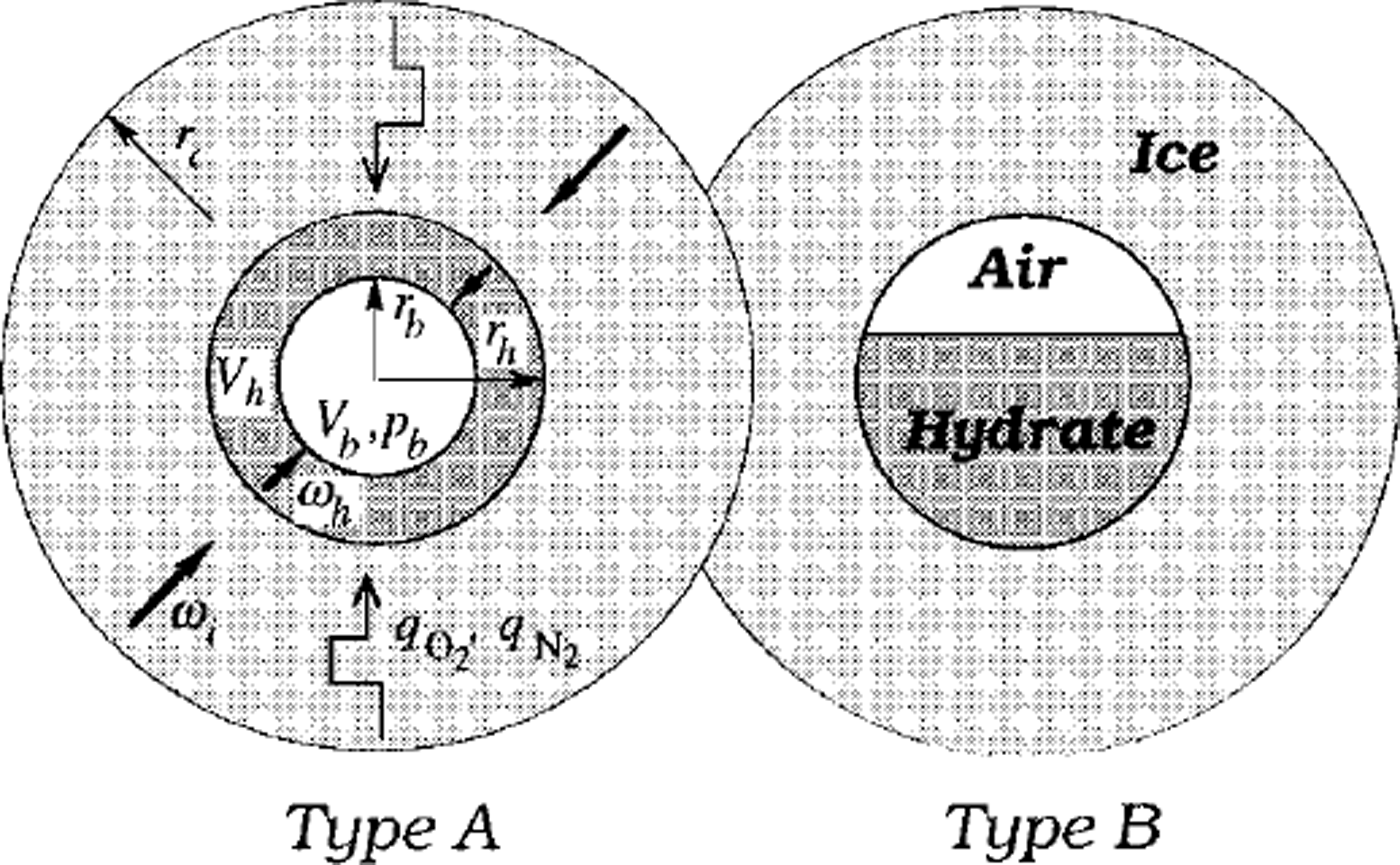
Another type, B, of post-nucleation conversion of air bubbles to air hydrates was also observed by Uchida and others (Reference Uchida, Hondoh, Mae, Duval, Lipenkov, Maeno and Hondoh1992). As shown in Figure 1, in this case the air-hydrate crystal does not coat the bubble wall but instead gradually grows inward, maintaining a flattened interface with the gaseous phase. This type of transformation might be even more common for polar ice sheets, where air bubbles initially do not have the air-hydrate structure on their surface, and coating clathration would be very difficult. The absence of the hard hydrate shell (Salamatin and others, Reference Salamatin, Hondoh, Uchida and Lipenkov1998b) around the bubble may reduce the compression time τc by one order of magnitude. Nevertheless, for both types A and B the post-nucleation conversion of an air bubble to air hydrate in polar ice sheets, being at least 2-4 orders faster than the hydrate nucleation, remains limited by the bubble compression. Only a very short stage at the very beginning of the post-nucleation transformation might be controlled by the diffusion, when, due to the high supersaturation of the bubble, a large quantity of air is abruptly converted to hydrate crystal, and the bubble pressure, initially close to the load pressure, simultaneously drops to the dissociation pressure level.
An important peculiarity of the process was revealed in Salamatin and others (Reference Salamatin, Hondoh, Uchida and Lipenkov1998b). The rate of air-mass diffusive transport through the hydrate layer is estimated to be 10-50 times lower than the rate of water-mass transfer. This implies that in the laboratory tests, conducted at 255-270 K, the gas diffusion is too slow to change noticeably the "frozen-distribution of the air constituents in the growing hydrate layer. As a result of the dominant clathration of oxygen, maximum concentrations of nitrogen are obtained in the central part of the hydrate at the end of clathration. By contrast, in polar ice sheets the typical time for air diffusion in hydrate crystal is still much less than τc, and the gas compositions in the bubble and the growing hydrate are close to thermodynamic equilibrium. The only, yet non-crucial, exception might be the B-type conversion process at the end of the transition zone, when the rates of the air diffusion in hydrate crystals become comparable with those of the bubble compression. Thus, in applications to the natural, low-temperature conditions the mathematical model of the post-nucleation air-hydrate formation (Salamatin and others, Reference Salamatin, Hondoh, Uchida and Lipenkov1998b) should be reduced to the case of compression of the quasi-equilibrium bubble-hydrate complex at the dissociation pressure and under the excess load pressure in the surrounding ice matrix.
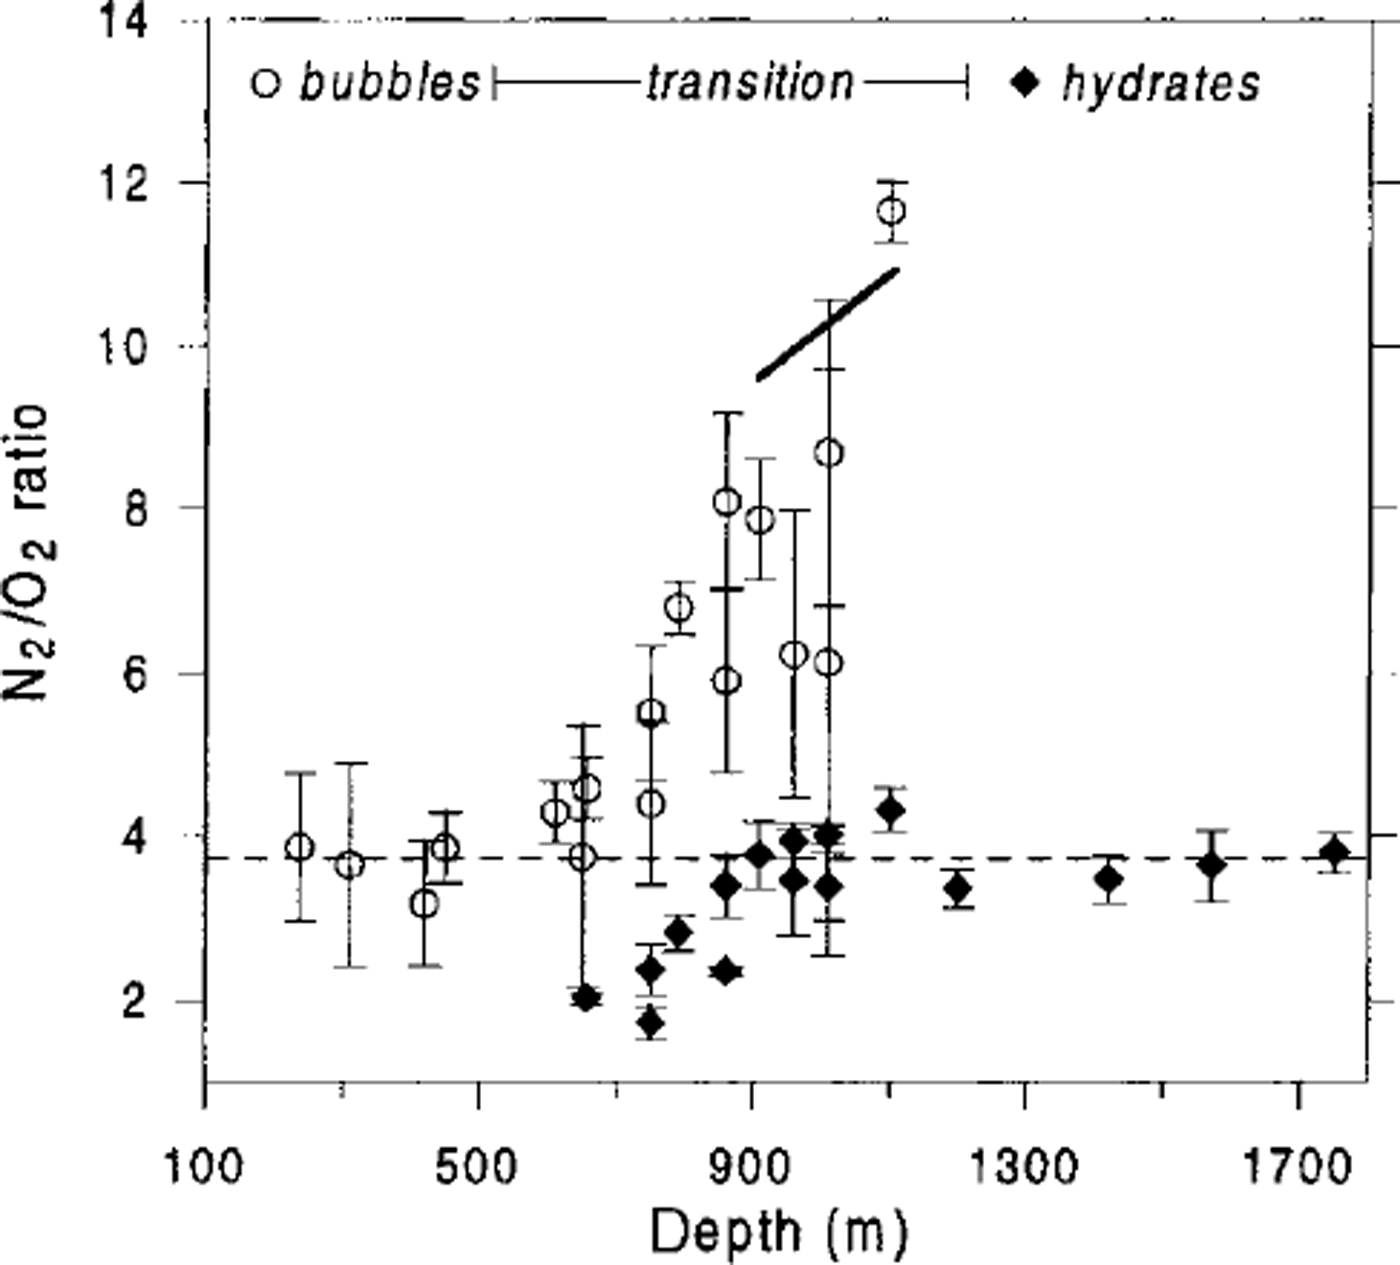
Recent detailed measurements of Raman spectra of individual air bubbles and air-hydrate crystals in Vostok ice cores performed by Fukazawa and others (Reference Fukazawa, Ikeda, Hondoh, Duval, Lipenkov and Mae1996) and Ikeda and others (Reference Ikeda1999) confirm significant changes in N2/O2 ratios in both groups of inclusions coexisting in the transition zone, as previously found by Nakahara and others (Reference Nakahara, Shigesato, Higashi, Hondoh and Langway1988) in air hydrates from the Dye-3 ice cores. The N2/O2 ratio in the first air hydrates observed at the beginning of the transition zone at Vostok is around 2, i.e. about two times less than the present-day air value (3.7) in surrounding air bubbles. The hydrate oxygen enrichment vanishes by the end of the transition, while the N2/O2 ratio in bubbles dramatically increases to 11.7 in the last air inclusions. Hence, selective diffusion of the air constituents between the non-nucleated air bubbles and hydrate crystals (Ikeda and others, Reference Ikeda1999) must be admitted as another process that essentially controls air-hydrate formation in polar ice sheets. The latter findings call for additional theoretical work to develop a mathematical model adequately extending that by Salamatin and others (Reference Salamatin, Hondoh, Uchida and Lipenkov1998b) to extreme polar-ice-sheet conditions. Such a study is attempted in this paper.
The experimental data reviewed above on the evolution of the air-bubble and air-hydrate-crystal ensembles in the transition zone at Vostok are sufficiently representative to constrain the model. Unfortunately, very important GISP2 and GRIP publications on the Greenland Summit ice cores (e.g. Pauer and others, Reference Pauer, Kipfstuhl and Kuhs1996,Reference Pauer, Kipfstuhl and Kuhs1997,Reference Pauer, Kipfstuhl, Kuhs and Shoji1999) deal mainly with the ice-core samples retrieved from the deeper part of the transition or below it and lack the necessary information on air inclusions.
2. Model of Air-Hydrate Crystal Growth
Basic notations, assumptions and relations
Fast post-nucleation conversion of air inclusions to air hydrates in ice sheets, especially rapid in the B-type clathration, makes the probability of finding a "semi-bubble" (an air inclusion partly transformed to air hydrate) extremely low. With this in mind, let us consider (see Fig. 1) a single initially spherical air bubble which converts to air hydrate in infinite ice matrix containing only non-nucleated air bubbles and complete air-hydrate crystals. The current volumes, Vb and 14, of the air and the hydrate for both possible types of post-nucleation conversion are linked to the equivalent-sphere radius rb of the bubble and to the external radius rh of the whole bubble-hydrate complex (semi-bubble):

At the very moment of the air-hydrate nucleation, bubble pressure is close to the load pressure P1 in ice (Reference Lipenkov, Salamatin and DuvalLipenkov and others, 1997; Reference Salamatin, Lipenkov and DuvalSalamatin and others, 1997), but almost immediately, as an initial air-hydrate layer (or crystal) forms on the bubble wall, the pressure drops to the hydrate dissociation pressure pd (Reference Salamatin, Hondoh, Uchida and LipenkovSalamatin and others, 1998b). Based on the considerations presented in the introduction, we assume that in the following compression stage of the conversion the free gas phase is in equilibrium with the hydrate.
Hence, in accordance with Van der Waals and Plat-teeuw’s theory (Reference Van der Waals and Platteeuw1959)

where
 and
 are mole fractions of nitrogen and oxygen in the air bubble and the hydrate crystal growing on its walls,
 , and
 and
 are the respective dissociation pressures of pure N2- and O2-hydrates expressed in MPa after Reference MillerMiller (1969) as functions of temperature T (in K):

The process of post-nucleation conversion of a single bubble to an air hydrate in an ice sheet is quite short, and T is considered hereafter as a constant parameter.
The air in bubbles downward along the transition zone becomes more enriched with nitrogen (Reference IkedaIkeda and others, 1999). As for air hydrates, even at the beginning of the transition, their N2/O2 ratio does not fall below 2. Natural predominance of nitrogen with its mole mass MN, close to the oxygen mole mass MO2 allows us to use in mass-balance calculations the gas state equation for standard atmospheric air, disregarding the minor (3-4%) changes in its mole mass
 and density ρ (or pressure p) caused by the gas composition variations:

where zg and Rg are the non-ideal compressibility coefficient (depending on thermodynamic conditions) and the gas constant. For the same reasons, the densities of the air (mainly nitrogen) and water components ρh a and ρhw in the clathrate hydrate phase at the dissociation pressure are assumed to be constant and are taken after Hondoh (Reference Hondoh1989) and Hondoh and others (Reference Hondoh, Anzai, Goto, Mae, Higashi and Langway1990).
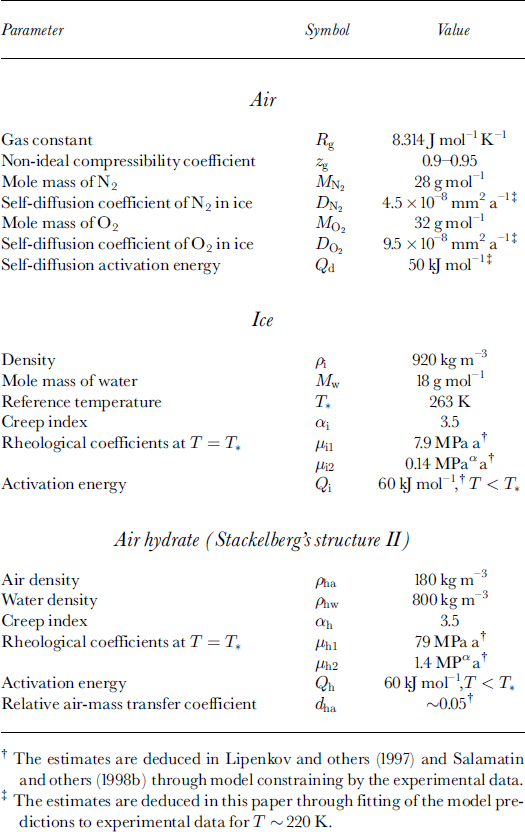
All the main physical characteristics and parameters used in this study, and their symbols and values, are presented in Table 1.
Physical properties of air-ice-hydrate system and model parameters
Mass-balance equations
The mass of nitrogen and oxygen in the air bubble and the hydrate, growing on its wall, changes due to the gas diffusive transport between the developing bubble-hydrate complex and the surrounding sources and sinks of air molecules, i.e. other air and hydrate inclusions distributed in the ice. Consequently, the equation of the total gas mass balance in the semi-bubble takes the form (normalized by the factor Ma/(zgRgT)):

where t is the time. The overall surface mass fluxes of nitrogen qN2 and oxygen qO2 from neighboring air and hydrate inclusions to the semi-bubble are normalized by the factor Maρi/Mw (Mw is the mole mass of water), i.e. expressed as the equivalent ice-volume flow rate of the same number of water molecules. Parameters pha and piw, defined as

are the pressures at which the densities of air and water molecules in free gaseous phases are equal to those in air hydrate (ρha) and in ice (ρi), respectively.
Correspondingly, the total mass balance of nitrogen is described by the relation:

The outer fluxes of the air constituents are consumed on the hydrate interfaces with ice and air by the clathration process for which the surrounding ice serves as an infinite source of water molecules. The volume deformation rate (divergence) of the ice, ωi, at the contact with the bubble-hydrate complex is determined by the ice mass-balance equation:

The above consideration does not depend on the actual form of the growing hydrate and its location in (or around) the bubble. In the A-type conversion process, however, water molecules have to move through the hydrate shell toward the bubble (see Fig. 1), and the bubble air diffuses in the opposite direction toward the ice to form new quantities of air hydrate at both phase boundaries. As a result, the divergence of the spherical hydrate layer, ωh, differs from cuh and the bubble-air mass-balance equation gives:

where parameter dha, introduced by Reference Salamatin, Hondoh, Uchida and LipenkovSalamatin and others (1998b), can be interpreted as the mass fraction of the air hydrate formed of the initial bubble air at the interface with the ice due to the diffusion of the air through the hydrate shell. The value 1 -dha is the relative quantity of the air hydrate formed at the interface with the gas phase due to the diffusion of water. In the case of the B-type conversion the hydrate crystal is a continuum incompressible structure without any cavities, and ωh = 0.
Equations (2)-(4) generalize the earlier developed model (Reference Salamatin, Hondoh, Uchida and LipenkovSalamatin and others, 1998b) of the conversion of an air bubble to clathrate air-hydrate crystal in ice under the basic assumption that the gas components in the bubble-hydrate system evolving under polar-ice-sheet conditions are in thermodynamic equilibrium, and the bubble pressure after nucleation is equal to the hydrate dissociation pressure.
Air-constituents diffusion through ice
Nitrogen- and oxygen-mass exchange between coexisting air bubbles and hydrates in ice sheets is the diffusive mass transfer (Reference IkedaIkeda and others, 1999), resulting in considerable fractionation of the air components. The driving forces are the gradients of mole concentrations of nitrogen and oxygen in the ice matrix. At the phase boundaries their values are proportional to the corresponding partial pressures of the equilibrium gaseous (vapor) phases. Thus, at the ice-hydrate interface the concentrations of the air constituents dissolved in the ice are determined by the dissociation pressures pdN2 and pdO2 multiplied by the mole fractions of the respective gas components in the hydrate crystal, while at the air-ice interface the concentrations are related to the corresponding partial fractions of the bubble pressure. These concentrations are the same in the vicinity of semi-bubbles undergoing different types of conversion, provided that the air pressure in them is equal to the dissociation pressure pd. In non-nucleated bubbles the pressure is identified with the load pressure p1 which in the transition zone is much higher than the dissociation pressure, thus causing the air diffusion.
Actually we have also to distinguish the gas composition
 of the reference bubble-hydrate system from the mean gas compositions of the surrounding non-nucleated bubbles
 and coexisting completely formed hydrate crystals
 , which fractions in the total inclusion number concentration N0
are nh
and 1 – nb, respectively. Hence, for instance, the background mole concentration of nitrogen in ice is determined by the averaged partial pressure induced by both groups of inclusions:

where the averaging parameter 7 ranges from 0 to 1, following the value nb.
The difference between the latter value and the equilibrium "nitrogen-vapor" pressure at the external surface of the growing hydrate crystal
 is the driving force of the nitrogen mass transfer. The same considerations are valid for the pressure
 in the case of oxygen.
The choice of parameter 7 is not obvious and will be discussed in section 4. Here, at the stage of simulating the conversion of a single reference bubble to air-hydrate crystal, the pressures
 and
 should be regarded as given model parameters. Thus, γ just links them to the averaged gas compositions of neighboring air bubbles and hydrates, so its particular value is not important. As a reasonable approximation we take γ ≈ nb.
To evaluate the diffusive mass fluxes, we use the conventional cell-model approximation for diluted multiphase media illustrated in Figure 1. A spherical semi-bubble of type A or B with growing air hydrate is confined to a spherical ice cell of a specific volume related to one inclusion, that is of radius

The averaged, background concentrations are assumed on the cell boundary, at r = rc. Gas solubility in ice is very low, and the total amount of air dissolved in the ice is negligibly small (Reference IkedaIkeda and others, 1999). For the latter reason, the nitrogen and oxygen diffusion through the spherical ice layer toward the developing bubble-hydrate complex is a quasi-stationary, spherically symmetric process. The obvious solution of the corresponding boundary-value cell problem yields:

Here, by definition,
 and
 are the self-diffusion (permeation) coefficients of pure nitrogen and oxygen in ice at a given (fixed) temperature T and dissociation pressures
 and
 , respectively.
It is also worth noting that volume concentrations of bubbles and hydrates within transition zones of ice sheets are very small and τb, τh ≪ τc. In such a case the cell-model approach is not crucial: the diffusive fluxes in Equations (5) and their analogues practically do not depend on the cell size.
Hydrostatic compression
After air-hydrate nucleation, the pressure in the bubble abruptly decreases to the dissociation pressure pd. The difference between the load pressure in the ice matrix p1 and pd is resolved in plastic compressive deformations of the ice and the hydrate around the bubble. A mathematical description of non-linear creep flow and pressure relaxation in bubbly media (Reference Salamatin and DuvalSalamatin and Duval, 1997) allowed us to construct an approximate model for hydrostatic compression (or decompression) of the air bubble converting to hydrate crystal (Reference Salamatin, Hondoh, Uchida and LipenkovSalamatin and others, 1998b) in case of the A-type transformation.
The ice and clathrate air hydrate are described as non-linear viscous isotropic materials with similar polynomial flow laws relating effective strain rates e0 and deviatoric stresses τ0:

where as and μsl, μs2 are the exponent (creep index) and the rheological coefficients (constants) at the reference temperature T*, and Qs is the activation energy. Subscript "s" corresponds to ice (s = i) or to hydrate (s = h).
As a final result, the ice and hydrate volume deformation rates, ωi and ωh, introduced in Equations (4), are linked to the pressure drop – pd by the following relation: Pl

The integrals Ψs(ω), s = i, h, are approximately evaluated and written in the form:

The ice flow law (Equation (6)) was confirmed in special studies of the bubbly-ice densification process in polar ice sheets (Reference Lipenkov, Salamatin and DuvalLipenkov and others, 1997; Reference Salamatin, Lipenkov and DuvalSalamatin and others, 1997). In mechanical tests (Reference Duval and CastelnauDuval and Castelnau, 1995) and in laboratory experiments on the air-hydrate formation (Reference Salamatin, Hondoh, Uchida and LipenkovSalamatin and others, 1998b) performed at relatively high temperatures, ice appeared to be somewhat softer than in natural polar conditions. We use here, however, the in situ ice rheology as determined by Reference Lipenkov, Salamatin and DuvalLipenkov and others (1997) for the Vostok region. In accordance with Reference Salamatin, Hondoh, Uchida and LipenkovSalamatin and others (1998b), air hydrate, when treated as a plastic material, was found to be at least one order harder than ice. This is in good agreement with the direct experimental measurements by Reference Stern, Kirby and DurhamStern and others (1996) performed for methane clathrate hydrates. Plausible values of the rheological parameters in Equations (6) and (7) estimated by Reference Lipenkov, Salamatin and DuvalLipenkov and others (1997) and Reference Salamatin, Hondoh, Uchida and LipenkovSalamatin and others (1998b) are given inTable 1.
Equations (4) and (7) for the idealized hard spherical hydrate shell around the bubble in the A-type conversion process represent the limiting case of the lowest rates of the bubble compression and, hence, the bubble-to-hydrate transformation. At the same time, taking coh = 0, instead of Equation (4b) for the B-type conversion, we assume that the growing hydrate crystal is freely squeezed into the bubble and does not hinder the bubble-compression and ice-deformation processes. Thus, we come to the upper bound of the conversion rates.
Initial conditions
The system of simultaneous Equations (1)–(7) needs to be supplemented with additional relations which determine the initial values of characteristics describing the conversion of a reference bubble to clathrate air hydrate after the hydrate-crystal nucleation on the bubble wall at t = 0. Let us designate by subscript "0" the bubble volume Vb0
(bubble radius τb0) and the bubble (load) pressure p10 just before the nucleation; the gas composition is identified with
 ,
 . Due to relatively high rates of air and water diffusion through clathrate hydrate almost immediately after nucleation, the hydrate crystal, growing on the bubble wall, reaches the size at which the initial supersaturation is removed and the bubble pressure drops from p10
to the dissociation pressure pd. Gas composition of the bubble also changes from
 to
 . This momentary process is too fast to be noticeably influenced by the air diffusion from neighboring inclusions and compressive deformation of the ice. Thus, the mass-conservation law for the bubble air (Reference Salamatin, Hondoh, Uchida and LipenkovSalamatin and others, 1998b) determines the initial volumes of the air bubble and the hydrate crystal after its nucleation:

where pd corresponds to the initial bubble-air composition
 which, being in equilibrium with the hydrate crystal (see Equations (1)), satisfies the following transcendental equation:

The load pressure in the ice matrix does not remain constant as the transforming bubble-hydrate complex sinks into the ice-sheet thickness:

The rate of loading Lp is proportional to the ice accumulation rate b, that is Lp ∼ gPib (g is the gravity acceleration), but should be corrected to account for the thinning of the overlying ice stratum in the vertical direction due to global ice-sheet dynamics (e.g. Reference Salamatin, Lipenkov and DuvalSalamatin and others, 1997).
3. Results of Simulations
Finite-difference and iteration methods were employed to solve non-linear differential Equations (1)-(10) numerically. A special interactive computer system has been developed in the DELPHI visual programming medium to perform computational experiments and to study the process of the conversion of an air bubble to air-hydrate crystal in transition zones of ice sheets. This software is used here to simulate the air-hydrate formation process in Antarctica at Vostok station.
Preliminary notes on model parameters
The most uncertain but principal parameters of the model (Equations (1-10)) are the permeation (self-diffusion) coefficients of nitrogen and oxygen in ice. There are as yet no reliable data on their values reported and available from direct measurements, especially at the extreme conditions typical of polar regions. However, preliminary estimations can be made. The mechanism of the diffusion in ice is thought to be an interstitial one and for water molecules was studied by Reference Goto, Hondoh and HigashiGoto and others (1986). Additional experiments were conducted to measure the diffusion coefficients of hydrogen (Reference Strauss, Chen and LoongStrauss and others, 1994) and noble gases (Reference Satoh, Uchida, Hondoh and MaeSatoh and others, 1996). Reference IkedaIkeda and others (1999) extrapolated these data to N2 and O2 at 263 K by calculating the potential barriers of the gas-water molecular interactions, which are the proxy for the activation energy of the gas molecule jumps in ice lattice. They also estimated the concentrations of N2 and O2 in ice from the Van der Waals diameters of the gas molecules using the gas solubility measurements by Reference Satoh, Uchida, Hondoh and MaeSatoh and others (1996). Combining these results, we arrive at a rough prediction of the diffusive permeation coefficients of N2 and 0 2 in ice at 263 K for dissociation pressures
 and
 , respectively:
 and
 . Thus
 is noticeably greater than
 . The in situ diffusive transport of air molecules in ice was indirectly estimated by Reference Uchida, Mae, Hondoh, Lipenkov and DuvalUchida and others (1994c) from the growth rate of air-hydrate crystals in the Antarctic ice sheet. They found the air permeation coefficient to be of the order of 10−7 to 10−6 mm2 a−1 (∼10−20 to 10−19 m2 s−1) at 233 K and 10 MPa. This agrees with Reference IkedaIkeda and others’ (1999) data if the difference in temperature is taken into account.
Recent observations of the gas fractionation in Vostok ice cores (Reference IkedaIkeda and others, 1999) imply that the typical time τE of the diffusive gas-mass exchange between the air bubble transforming to air-hydrate crystal and its neighbors, coexisting bubbles and hydrates, at the beginning of the transition zone at 220 K could be comparable with the compression (air-hydrate formation) time τc . Hence, for nb ∼ 1 and for the time-scale ratios discussed in the introduction, at the beginning of the transition, τE should be 105 times larger than the diffusion time τD in air hydrate. The gas-mass exchange time-scale τE for an air-hydrate crystal can be derived from Equations (3) and (5), as

In accordance with Reference Salamatin, Hondoh, Uchida and LipenkovSalamatin and others (1998b)

where the diffusive mass-transfer coefficient in air hydrate D for the Vostok transition zone at 220 K is about 10−2 mm2 a−1. Thus, the corresponding values of the self-diffusion coefficients of the air constituents in ice should be of the order of 10"7 mm2 a-1 (∼10-21 m2 s−1). The latter estimate is consistent with the above predictions by Reference Uchida, Mae, Hondoh, Lipenkov and DuvalUchida and others (1994c) and Reference IkedaIkeda and others (1999) and is confirmed below (seeTable 1) by model constraining.
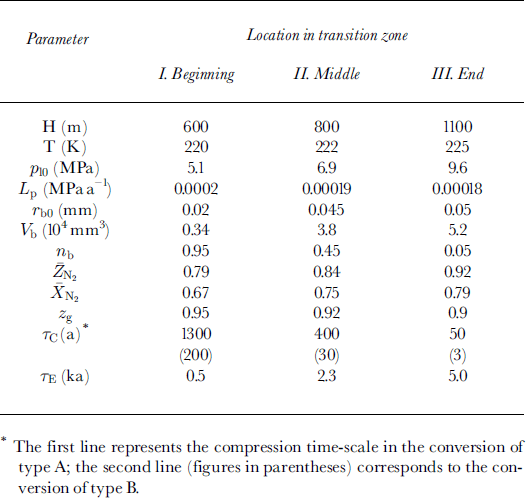
The present-day environmental conditions of the air-hydrate crystal growth on bubble wall after its nucleation at different depth levels (h) at the beginning, in the middle and at the end of the transition zone at Vostok are presented in Table 2. Direct optical-microscope observations of the Vostok ice cores by Reference LipenkovLipenkov (1989) showed that, in spite of the hydrostatic compression, the mean radius
 of air bubbles within the transition zone remains substantially constant, slightly varying from 0.06-0.065 mm in the upper part to 0.045-0.05 mm at the end. This becomes possible due to the preferential, selective clathration of bubbles of minimal, "critical" size: τb ∼ 0.02-0.025 mm. The number fraction of such bubbles rapidly decreases with depth, thus increasing the initial dimensions of air inclusions involved in clathration. Our choice of the initial bubble radii (τb0) inTable 2 follows this tendency.
Present-day initial environmental conditions of air-hydrate formation within transition zone in Antarctic ice sheet at Vostok station
The rate of loading Lp has been estimated in accordance with the mean ice-accumulation rate at Vostok station, b « 24 mm a−1, determined over the past 22 years (Reference Barkov and LipenkovBarkov and Lipenkov, 1996).
The number concentration of inclusions N0 is taken equal to 0.8 mm−3 (τc ∼ 0.67 mm) in all simulations.
Computational experiments and discussion
The time-scale of the gas-mass exchange, τE, given by Equation (11), depends on the bubble number fraction nb and is proportional to the squared radius of the air bubble converting to air-hydrate crystal. It has minimal values in the upper part of the transition zone, where the air-hydrate formation (compression) time τc reaches its maximum and where air bubbles have initial atmospheric gas composition and dominate in the inclusion ensemble (nb ≈ 1). Accordingly, first computational tests showed that at the beginning of the transition zone the initial gas composition of a growing hydrate, determined by Equations (8) and (9), rapidly changes (due to the selective diffusion of oxygen from the neighboring bubbles) to a certain new one, distinguished as
 ,
 , which further remains constant during the formation and development of the crystal unless the air composition in the neighboring bubbles itself is changed. At the end of the transformation, when the amount of air in the bubble becomes small, the ratio between the righthand sideflux terms in Equations (2) and (3) is equal to


Substituting
 and
 for
 and
 in Equations (5), we obtain a theoretical estimate for the permeationcoefficients ratio valid at the beginning of the transition:

For present-day conditions at Vostok station, at about 650 m depth the load pressure is Pl « 5.6 MPa, and the dissociation pressures at temperature T « 220 K are
 and
 . For atmospheric air trapped in bubbles
 , while, in accordance with Reference IkedaIkeda and others (1999), the N2/O2 ratio in air hydrates is
 . Therefore, Equation (12) predicts

This relationship is hereinafter fixed in all computer simulations. It is additionally validated in section 4. However, it should be noted that this estimate is rather sensitive to feasible changes in depth (load pressure) and N2/O2 ratios. For instance, at the 600 m level, where Pl ≈ 5.1 MPa, the
 ratio would be 2.5 for the same degree of the fractionation and would range from 1.8 to 2.6 if
 varies within ±5% limits.
The post-nucleation transformation of an air bubble to air-hydrate crystal in polar ice sheets, being mainly controlled by the bubble compression, does not noticeably depend on the gas-mass exchange between the semi-bubble and the neighboring air and hydrate inclusions. On the other hand, the latter process is primarily responsible for the total size and the growth rate of the air hydrates after the conversion. Approximately, at the beginning of the transition, where nb
≈ 1, the bulk air-mass flux from bubbles to hydrates is determined by the initial supersaturation,
P1 – pd, and the mean size of the air hydrates is related to their mean age. Ice-core analysis shows that the corresponding radius, τh, of the hydrate crystals at 700 m depth at Vostok is about 0.036 mm (Vh
= 1.95 × 10⁻⁴ mm3). They are mainly formed below 620 m, and their mean age can be estimated as 1.5–2ka at the present-day accumulation rate of about 24 mm a−1. The diffusive permeation coefficients of nitrogen and oxygen presented inTable 1 are obtained (with accuracy not worse than ±10%) to satisfy the latter constraint:
 ,
 , corresponding to a temperature of 220 K (dissociation pressures
 and
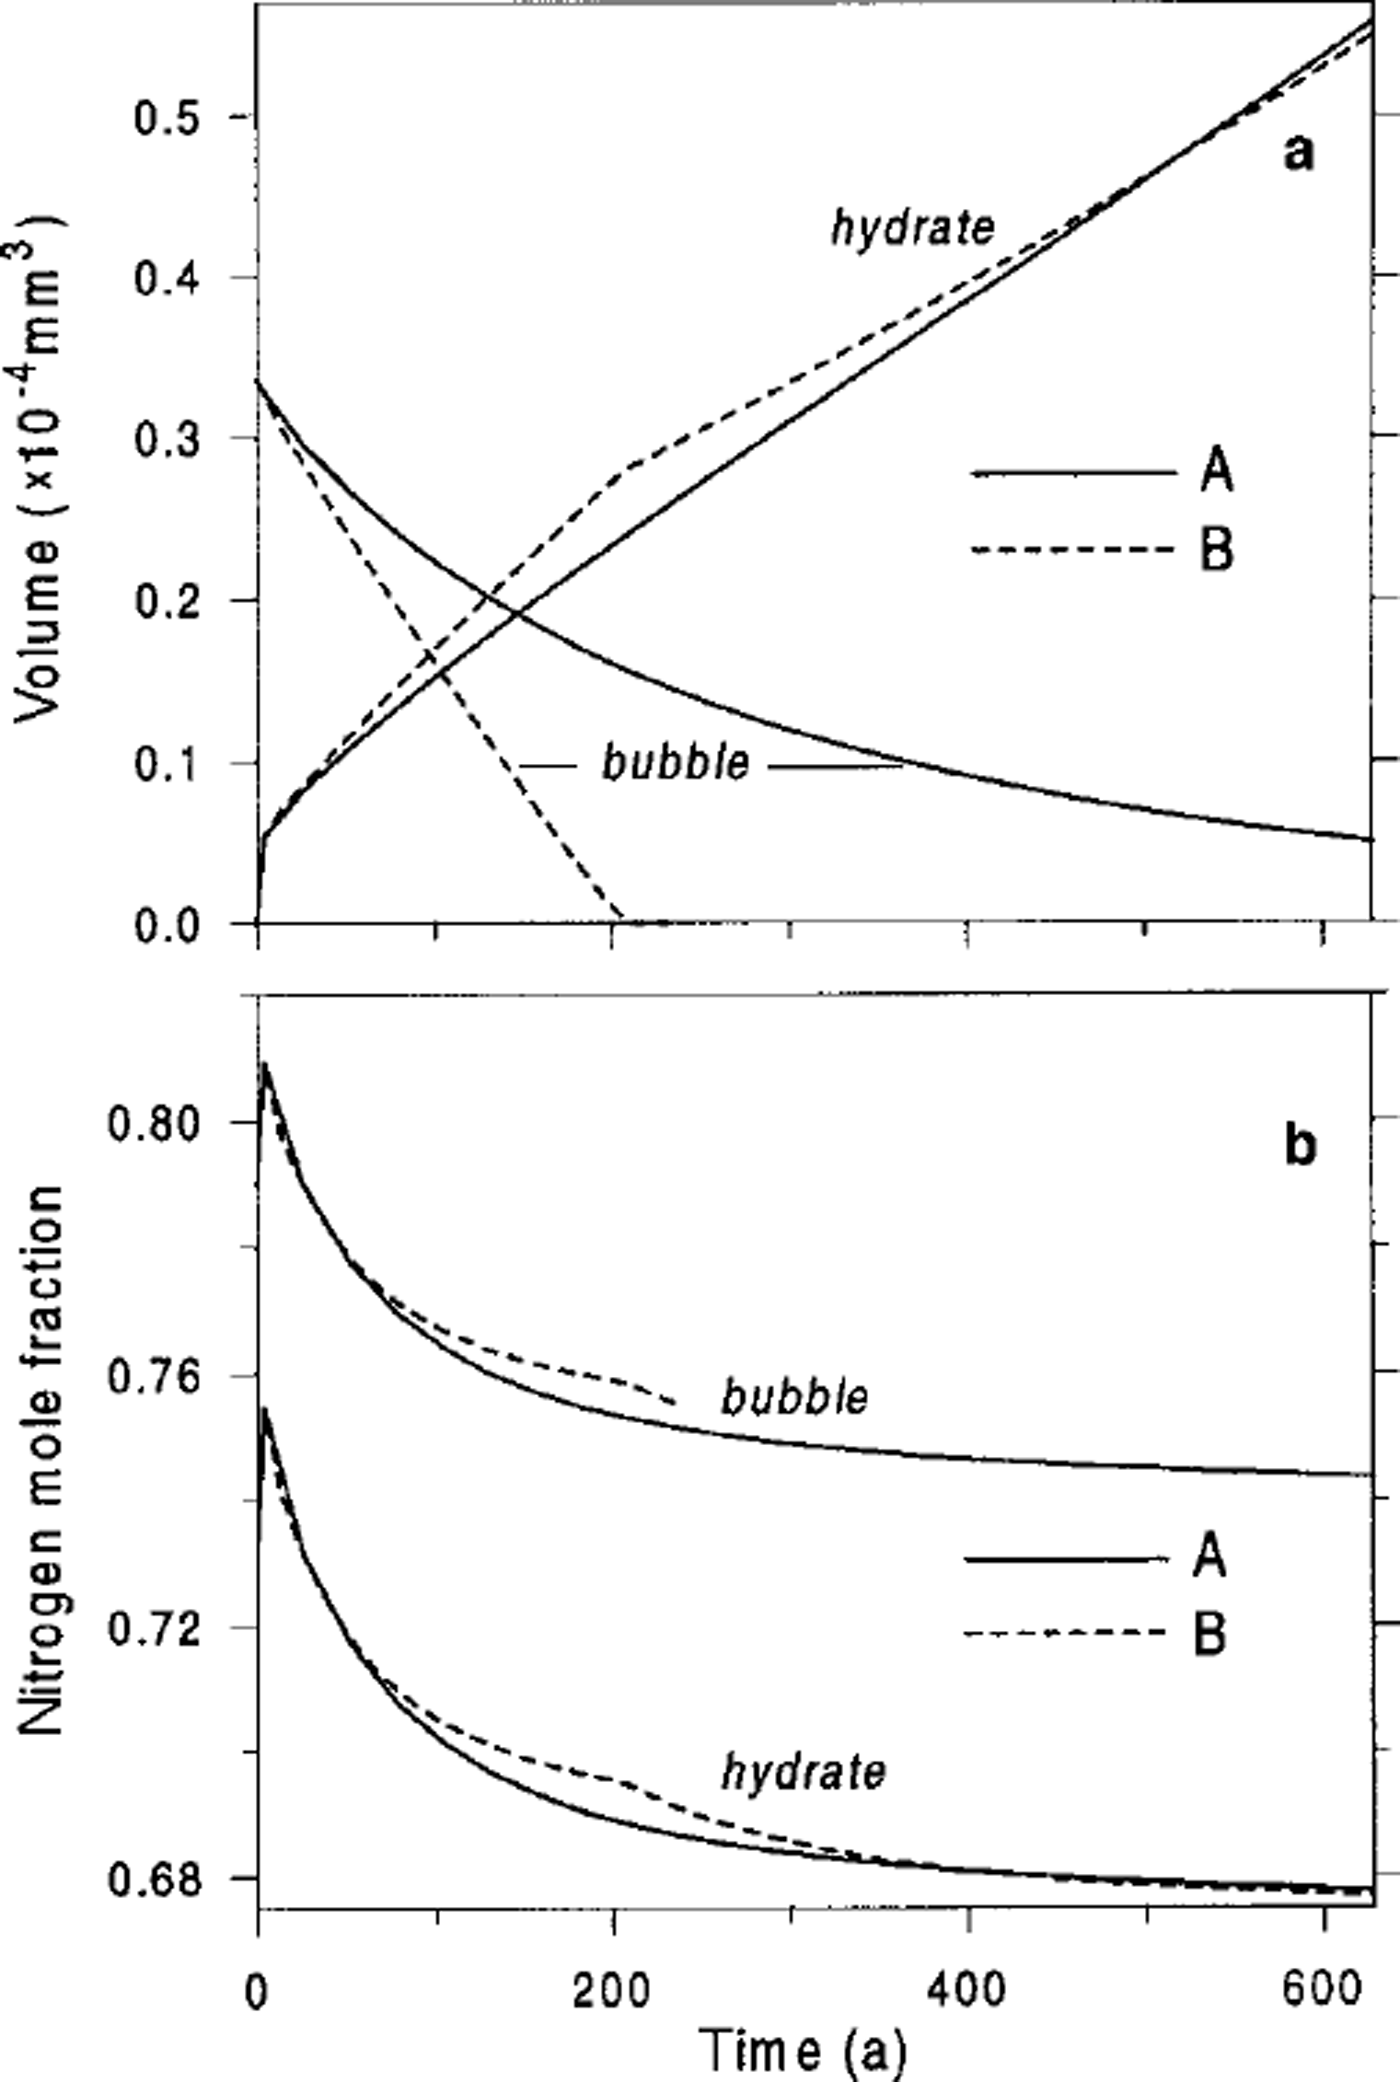
 ). Figure 2 shows the described process of air-hydrate crystal growth and the temporal changes in the gas composition of the developing bubble-hydrate complex at the beginning of the transition zone at Vostok. The limiting difference between types A and B of the post-nucleation transformation of an air bubble to clathrate air hydrate can be clearly seen.
Air-bubble and air-hydrate characteristics vs tine simulated for the beginning of the transition zone at Vostok (600m depth), (a) Volumes, Vh. Vh. (b) Nitrogen mole fractions,
 . A and B indicate type of bubble-to-clathrate conversion.
The deduced estimates of the self-diffusion coefficients of the air components in ice agree well with the preliminary ones discussed in the previous subsection. Based on these results obtained for 220 K as well as on the predictive calculations performed by Reference IkedaIkeda and others (1999) for 263 K, we can attempt to evaluate the self-diffusion activation energy Qd defined by the conventional relation:

where subscript "s" designates either oxygen (s = O2) or nitrogen (s = N2), and permeation coefficient Ds* corresponds to the reference temperature T* and linearly depends on pressure (gas concentration). In general, we should have assumed different activation energies for the air components, but limited confidence in the extrapolation procedures of Ikeda and others (Reference Ikeda1999) at 263 K inclines us not to do this. Finally, on average, taking into account the difference in dissociation pressures at different temperatures, we obtain Qd = 50±3Jmol−1, which is very close to the self-diffusion activation energy of water interstitial in ice (Goto and others, Reference Goto, Hondoh and Higashi1986). This estimate is sufficiently reliable to account for relatively small temperature variations within the transition zones, for instance, 220-225 K at Vostok. In the case of Uchida and others (Reference Uchida, Mae, Hondoh, Lipenkov and Duval1994c), at 233 K and 10MPa, the N2- and 02-permeation coefficients would be 5.7 × 10⁻⁷mm2 a-1 (1.8 × 10⁻²⁰m2 s−1) and 1.6 × 10⁻⁶mm2 a-1 (5.2× 10⁻²⁰m2s-1), respectively, which corresponds to the lower bound of the range estimated in the cited study.
Figures 3 and 4 present the principal features of the air-hydrate formation process in the middle and at the end of the transition zone for present-day (Holocene) climatic conditions (seeTable 2). From Salamatin and others (Reference Salamatin, Hondoh, Uchida and Lipenkov1998b) the rate of bubble shrinking increases with depth (see Figs 2a-4a) following the increase in the initial relative supersaturation of bubbles, p10/pd, from 1.5 to 2.3. The values of the typical compression time τc given inTable 2 refer to the moment at which the volume of the disappearing air bubble becomes 100 times smaller than that of the growing hydrate. The time-scale of the air-hydrate formation decreases from 1300 a (or 200 a) at the beginning to 50 a (or 3 a) at the end of the transition zone for the conversion of type A (or B). On the other hand, the typical time τE for the gas-composition variation in a growing air hydrate, calculated in Table 2 in accordance with Equation (11), increases considerably with depth from 500 to 5000 a. As mentioned, this is for two reasons: (1) larger bubbles transform to air hydrates at greater depths, and (2) the decrease in bubble number fraction reduces the background concentration of air constituents dissolved in the ice. As a result, first air hydrates which appear at the beginning of the transition at Vostok acquire a large quantity of air from surrounding bubbles and completely change their gas composition due to the selective diffusion of oxygen during the period of their formation (see Fig. 2b). However, even in the middle of the transition zone (Fig. 3b), and especially at its end (Fig. 4b), the gas composition of the growing air-hydrate crystal remains practically constant in the course of the transformation, while the main changes in the composition of air hydrates formed in the middle of the transition take place in the post-conversion period. The continuous gas-mass exchange between the air hydrates and coexisting bubbles along with nucleation of new air hydrates play the principal role in the gas fractionation (Ikeda and others, Reference Ikeda1999) within the transition zone. This phenomenon is discussed in the next section.
Air-bubble and air-hydrate characteristics vs time simulated for the middle of the transition zone at Vostok (800m depth), (a) Volumes, Vh. Vh. (b) Nitrogen mole fractions,
 . A and B indicate type of bubble-to-clathrate conversion.

Air-bubble and air-hydrate characteristics vs time simulated for the end of the transition zone at Vostok (1100 m depth), (a) Volumes, Vb,Vh. (b) Nitrogen mole fractions,
 . A and B indicate type of bubble-to-clathrate conversion. ( c) Compressive deformation rates of the air-hydrate coat (ωh) and surrounding ice (ωi) in case A.

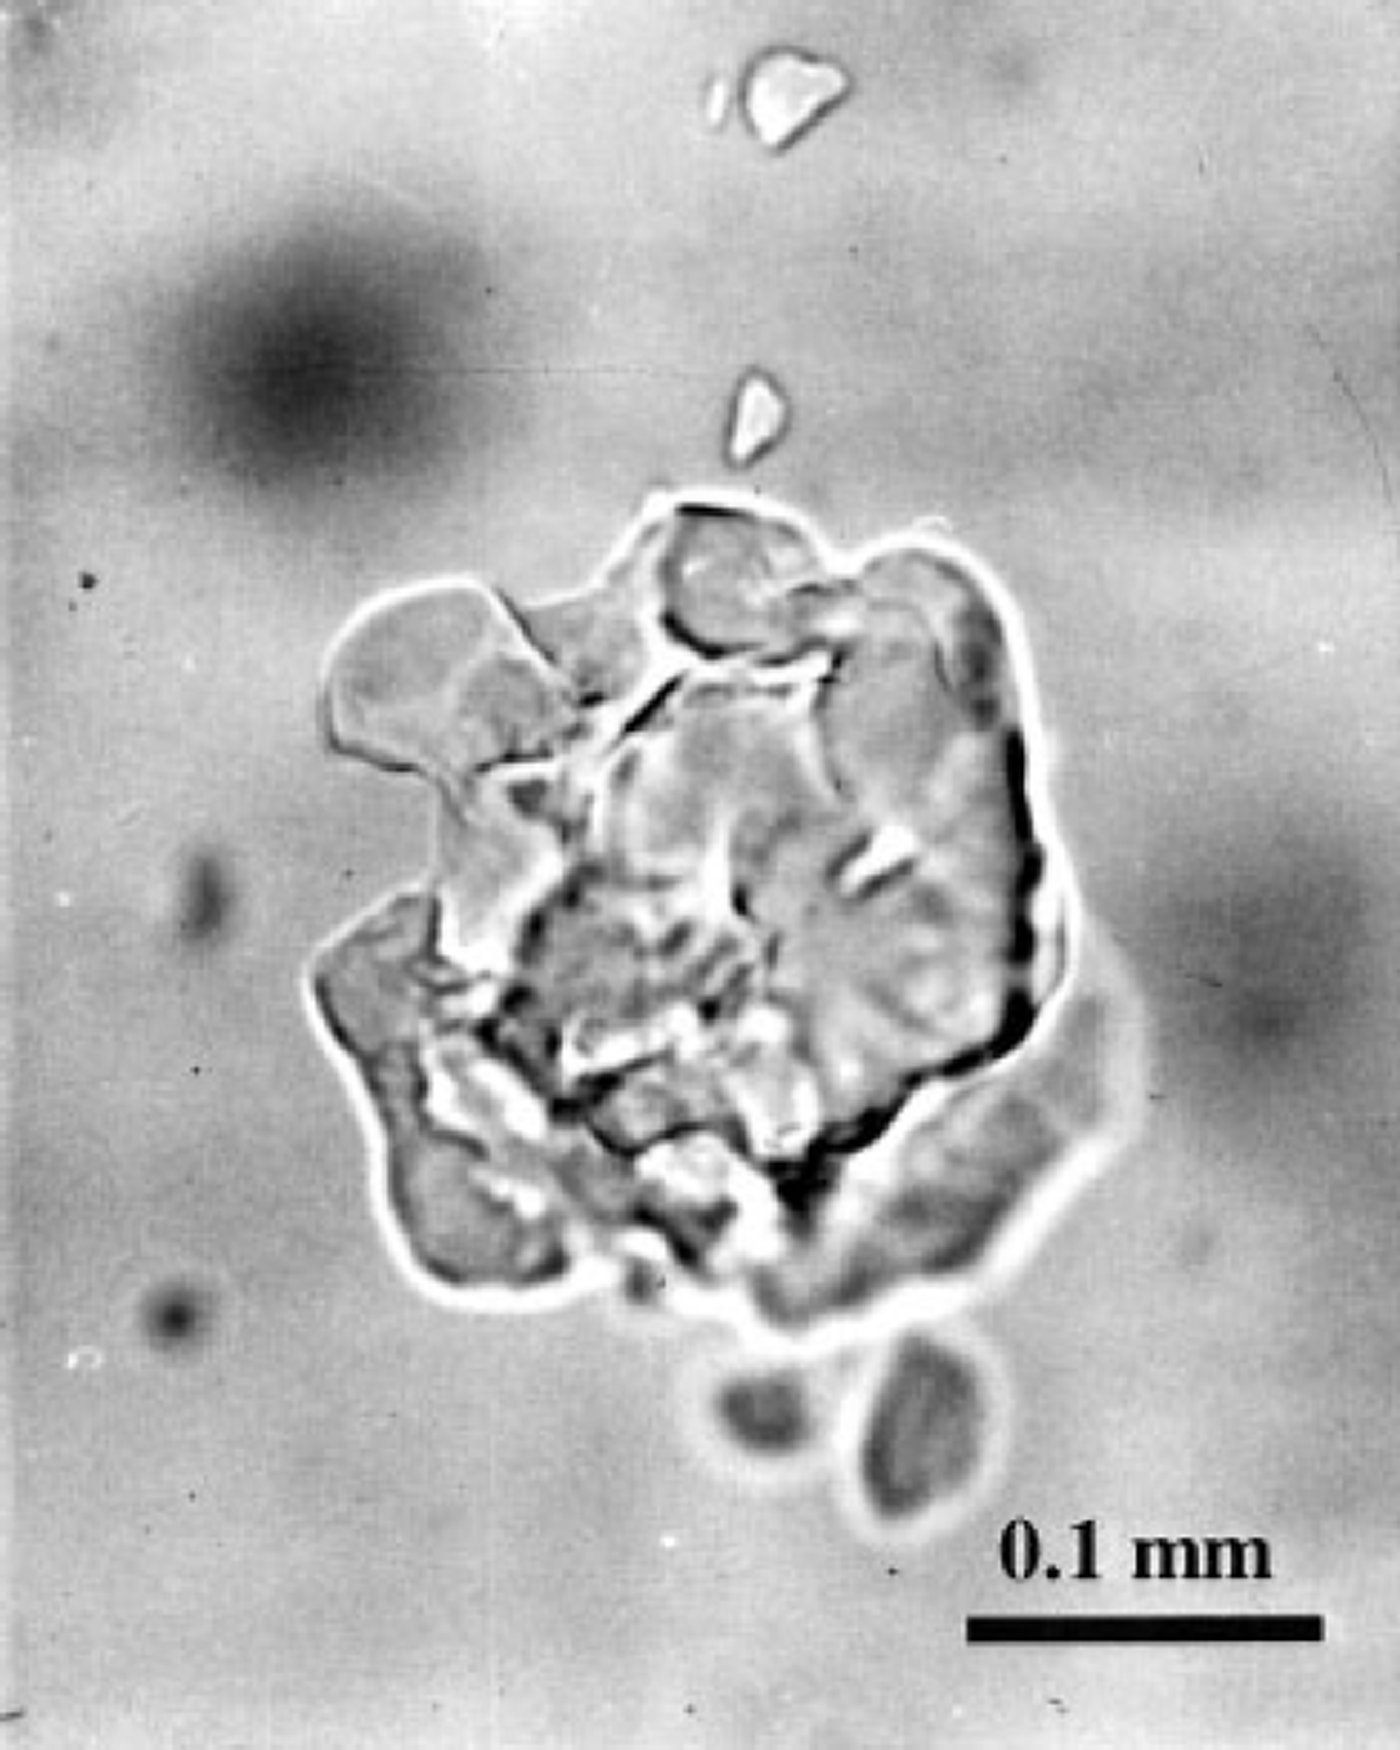
Another peculiarity of the post-nucleation conversion of air bubbles to air hydrates can be distinguished in Figures 2a-4a. Because of the high supersaturation of bubbles, a large quantity (30-60%) of air in them almost immediately after nucleation is converted to hydrate crystals. Figure 4c shows that for the A-type transformation the compressive deformation rates of the ice and the hydrate layers, surrounding the bubbles, reach their maximum values at this moment, these values being especially high in the deeper part of the transition zone. This may cause destruction of the hydrate shells, followed by further recrystallization of different pieces. At the same time, at high supersaturation the conversion of type B can also start with simultaneous nucleation of several hydrate crystals in a single air bubble. Thus, the probability of finding such "broken" (split into separate parts) air-hydrate crystals is proportional both to the local supersaturation of bubbles and to the rate of the hydrate nucleation in a unit of ice volume. The latter tends to zero as the number of bubbles diminishes at the end of the transition zone, decreasing the above probability. This may explain the experimental observation that air-hydrate crystals of several similar-sized splinter-like pieces (see Fig. 5) are common for the Vostok ice cores mainly in the middle of the transition zone.
Clathrate air-hydrate inclusion composed of several splinter-like pieces in the fresh Vostok ice core recovered from 850 m depth.
4. Gas Fractionation in the Transition Zone
Simplified mass-balance model
The averaged nitrogen and oxygen mass fluxes through the ice matrix toward air hydrates
 and bubbles
 are direct analogues of Equations (5):

where
 and
 are the mean radii of air-hydrate crystals and bubbles, respectively, assumed to be much less than the cell radius rc
(see Fig. 1).
The mass conservation of air components implies that and determines the parameter 7 as

and determines the parameter γ as

For the transition zone at Vostok the ratio
 and does not differ much from unity. Hence, the approximation γ ≈ nb
used in the previous section seems reasonable.
It is important to remember that the typical time τE of the gas-composition variations in a single air-hydrate crystal significantly exceeds the time-scale of the bubble-to-hydrate conversion (τc) throughout the transition zone, except maybe for its beginning at Vostok (see Table 2). This means that the gas composition of a newly formed air hydrate
 , at least in the deeper part of the transition zone, is initially close to that of the air bubble
 .
Thus, the mass-balance equation for nitrogen in gaseous (bubble) phase can be written in the following form:

which yields

Combining this equation with that written for oxygen, we obtain the principal relation which determines the rate of the bubble-gas composition changes (gas fractionation) in the transition zone:

To construct a complete model of the gas fractionation, Equation (14) should be considered together with the analogous one for
 which would include the additional gas-mass exchange term proportional to the rate of air-hydrate nucleation dnb/dt. To solve this system of simultaneous equations, we would need to know the kinetics of the nucleation itself. The latter problem is beyond the scope of this paper, although its solution would allow us to constrain the gas-fractionation model by the direct Raman spectra measurements (e.g. Reference IkedaIkeda and others, 1999) and to infer more valid estimates of the self-diffusion coefficients
 . It is proposed that these questions be studied in future. Nevertheless, even at the present stage of our knowledge it is useful to examine Equations (13) and (14) on the basis of scale analysis to derive the typical time τF of the bubble-gas fractionation in transition zones of ice sheets:

Naturally it has the same structure and is of the same order as τE at the beginning of the transition.
Let τ Z be the typical time of the hydrate nucleation covered by the transition zone. The principal conclusion can be deduced at this stage: a noticeable gas fractionation within the transition zone man ice sheet takes place only τF ≪ τZ, i.e when the rate of the air-hydrate nucleation is much less than the gas fractionation rate.
Model validation on Vostok data
We can easily estimate τF from Equation (15) for conditions in the transition zone at Vostok (see Tables 1 and 2). For the depth range 800-1100 m the gas-fractionation time for bubbles τF ∼ 300 a. Further, in accordance with Reference Salamatin, Lipenkov, Barkov, Jouzel, Petit and RaynaudSalamatin and others (1998a), the ice age is 28 ka at the beginning of the transition zone (550 m) and 94 ka at the end (1250 m). This 700 m stratum was formed in the cold glacial period when ice-accumulation rate was approximately half the present rate. Hence, the age of the ice layer that has now reached the end of the transition zone was about 60 ka at the beginning. Soon after that (approximately 10 ka), the Holocene warming started, with increased ice-accumulation rates, and the conversion of all bubbles to air hydrates took about 30-35 ka. This estimate of TZ for central Antarctica is much larger than rE and is two orders of magnitude larger than that of τF.
Thus, at Vostok, the bubble-gas fractionation in the deeper part of the transition zone, as nb
decreases, becomes a quasi-stationary process. Its principal limiting step is the nucleation of air hydrates. It determines the rate of the mean air-hydrate gas-composition evolution from its initial oxygen-enriched state to that close to atmospheric air. The gas composition in air bubbles simply follows the changing load (bubble) pressure to correspond with the gas composition of air hydrates and would be constant if the latter two factors remained unchanged. Mathematically this means that the lefthand side of Equation (14) becomes negligibly small compared with the gas-mass fluxes
 and
 .
Therefore,

and we come directly to the following relation:

which is an analogue of Equation (12) at the end of the transition zone.
Laboratory Raman spectroscopic studies by Reference IkedaIkeda and others (1999) showed that below 850 m the gas composition of air hydrates in the Vostok ice cores is close to atmospheric:
 Thus, if we fix the self-diffusion coefficients ratio
 , as determined before, then it is possible to use Equation (16) to evaluate the N2/O2 ratios in air bubbles. In the depth range 900-1100 m, the load pressure varies from 7.8 to 9.6 MPa, while the dissociation pressures are
 and
 . This leads to an N2/O2 ratio in bubbles of 9.6-10.9. The direct measurements by Reference IkedaIkeda and others (1999) give
 . The obvious agreement between the theoretical estimates and the experimental data (see Fig. 6) tends to support the validity of the developed model.
Comparison of direct measurements of N2/O2 ratios in air bubbles and air hydrates in the Vostok ice core (Reference IkedaIkeda and others, 1999), with theoretical prediction of the N2/O2 ratio in air bubbles at the end of the transition zone (bold line). Error bars correspond to the standard deviations of the measurements performed in the different inclusions of the same ice sample. Dashed line indiates atmospheric N2/O2 ratio (3.7).
Discussion: application to Greenland ice-sheet conditions
It might be interesting to apply the above theory to the analysis of air-hydrate formation conditions in the Greenland ice sheet, studied through the GRIP and GISP2 projects. The transition zone in the Greenland ice cores is found at 1000-1500 m depth (Reference Pauer, Kipfstuhl, Kuhs and ShojiPauer and others, 1999) with ice ages of about 5.3-9.4 ka (Reference MeeseMeese and others, 1997). It covers the Holocene period, with rather stable temperatures around 240 K and ice-accumulation rates close to 250 mm ^ (Reference Cuffey and ClowCuffey and Clow, 1997). Thus, the duration of the total phase transition from air bubbles to air hydrates (the typical time of nucleation) is τz ∼ 4 ka, i.e. one order of magnitude less than in the Vostok region in Antarctica.
To understand whether a noticeable gas fractionation could occur in central Greenland, we should estimate the corresponding time-scale τF, using Equation (15). The depth profiles of the hydrate number concentration and total gas-volume concentration along the GRIP ice core (Reference Pauer, Kipfstuhl and KuhsPauer and others, 1997,Reference Pauer, Kipfstuhl, Kuhs and Shoji1999) allow us to calculate the mean bubble radius
 . The dissociation pressure
 , the self-diffusion coefficient
 , and for load pressures Pi ∼ 10 MPa we get τF ∼ 200–400 a. Thus, the gas-fractionation rates (time-scales τF and τE) in central Greenland for present-day (Holocene) climatic conditions are comparable with those at Vostok, but at much (10 times) higher nucleation rates. As a result the number of oxygen- enriched hydrates and the mean degree of gas fractionation sharply decrease at the beginning of the transition zone. The variance of the gas composition (N2/02 ratios) in the air hydrates increases as τE becomes comparable with τz in the deeper part of the transition zone. Therefore, we come to the following conclusion. A significant gas fractionation, on average, is ruled out for air hydrates in the Greenlandice cores and might be detected only (1) as oxygen enrichment in rare hydrate crystals formed at the very beginning of the transition, or (2) as nitrogen enrichment in rare hydrate crystals newly formed at the end of the transition zone. Indeed, N2 / 0 2 ratios as low as 2.63 and as high as 4.49 were observed in the air hydrates by Reference Pauer, Kipfstuhl and KuhsPauer and others (1997). More evident (systematic and statistically valid) nitrogen enrichment might be expected in the air bubbles in the deepest part of the transition zone, but such data are so far not available.
5. Conclusion
On the basis of previous theoretical studies (Reference Salamatin, Hondoh, Uchida and LipenkovSalamatin and others, 1998b), a mathematical model of the post-nucleation conversion of air bubbles to clathrate air-hydrate crystals is elaborated in application to polar ice-sheet conditions. The limiting step of the phase transformation is the hydrostatic compression of the ice-hydrate-air system. Two possible types, A and B, of hydrate-crystal growth on the bubble wall, schematically depicted in Figure 1, are considered and represent the limiting (lower and upper) bounds of the transformation rates. Special emphasis is put on modelling the gas-mass exchange between coexisting air bubbles and air hydrates within the transition zones. All simulations are aimed at analysis and interpretation of the Vostok ice-core data.
The typical time for the post-nucleation conversion decreases along the transition zone at Vostok from 1300 a (or 200 a) at the beginning to 50 a (or 3 a) at the end, depending on the type of hydrate growth (A or B). Because of the high initial supersaturation of bubbles, a large quantity (30-60%) of air in them is converted to hydrate crystals almost immediately after nucleation. The compressive deformation rates of the ice and the hydrate layers, coating the bubble walls in the A-type conversion, reach their maximum values at this moment, with especially high values in the deeper part of the transition zone. This may cause destruction of the hydrates. In the B-type conversion, at high supersaturation of bubbles, several air-hydrate crystals can simultaneously nucleate on the wall of a single bubble. Both situations may equally explain the experimental observation that air-hydrate crystals of several similar-sized splinter-like pieces are common for the Vostok ice cores in the middle of the transition zone, where the relative rate of the nucleation is maximal.
The model of the selective diffusive transport of the air constituents from air bubbles to hydrate crystals through the ice matrix has been constrained by the data of optical-microscope observations of the bubble and hydrate ensembles (Reference LipenkovLipenkov, 1989), as well as by the Raman spectroscopic measurements of their N2/O2 ratios (Reference IkedaIkeda and others, 1999). The ratio between the diffusive permeation coefficients of oxygen and nitrogen is found to be
 , while the values of the coefficients themselves at the Vostok temperature of about 220 K are determined as
 and
 . The air-permeation (self-diffusion) activation energy is estimated to be Qd
≈ 50 kJmol−1. The gas-fractionation time-scale at Vostok, τF ∼ 300 a, appears to be two orders of magnitude less than the typical time of the air-hydrate nucleation τZ ∼ 30-35 ka. The condition for the extreme gas fractionation, τF ≪ τz, is satisfied, and a simplified model of a quasi-stationary gas-mass flux from air bubbles to air hydrates can be used to predict the total N2/O2 ratios in the last bubbles at the end of the transition zone at Vostok. Good agreement between the theoretical calculations and the Raman spectra data confirms the validity of the model. Application of the developed theory to the GRIP and GISP2 ice cores shows that significant gas fractionation, on average, is ruled out for air hydrates in central Greenland. A noticeable (statistically valid) nitrogen enrichment might be observed there only in the last air bubbles at the end of the transition zone.
Acknowledgements
The authors thank P. Duval, S. Mae, T Ikeda, and T Uchida for useful discussions, L. Pepin for her important contribution to the Raman spectra measurements on the Vostok ice core, and W. F. Kuhs, S. Kipfstuhl, J. M. Barnola, B. Stauffer and other participants in the International Symposium on Physics of Ice-Core Records (Shikotsukohan, Japan, 14-17 September 1998) for critical evaluation of the paper and important comments which helped to improve the final presentation of our study. Additional special thanks should be addressed to W. F. Kuhs who suggested many of the references and provided us with valuable material on air-clathrate crystals from the GRIP ice cores.
At different times, this work was supported in Russia by the Russian Federation State Committee for Science and Technologies and by the Russian Basic Research Foundation. In Japan, our study was funded through the grant-in-aid for International Scientific Research (Joint Research).



