NOMENCLATURE
- Ai, Bi
membrane and bending-membrane stiffness at node i
- b
width of plate
- D
displacement vector
- f
eigenparameter, i.e. load factor
- f *
trial value of f
- I, O
identity matrix and null matrix
- J
number of eigenvalues below f *
- J 0
number of fixed end eigenvalues below f *
- J m
number of fixed end eigenvalues of member m below f *
- K(f)
global stiffness matrix
- KΔ(f)
upper triangular form of K( f )
- l
length of plate
- L
longitudinal interval of mode repetition
- n
number of strips
- Nx, Ny, Nxy
stress resultant vectors
- u i, υ i
in-plane displacements at node i
- w i, φ i
out-of-plane displacements and rotations at node i
 $\overline {\varepsilon _x } $, $\;\overline {\varepsilon _y } $
uniform longitudinal and transverse strains
- ε xi, ε yi, ε xyi
membrane strains at node i
- κxi, κxi, κxyi
curvatures at node i
- λ m, λ n
longitudinal half-wavelength
- ξ
parameter defining mode repetition

Subscripts
- i
node number
- k
half-wavelengths for in-plane displacements
- m, n
half-wavelengths for out-of-plane displacements
- Q
number of unique values of k
1.0 INTRODUCTION
Mass minimisation is a crucial objective in aircraft design to reduce the cost of manufacturing, environmental impact and fuel consumption(Reference Che, Kennedy and Featherston1). This objective can be realized by using composite material, which can provide better performance than traditional metals in terms of the strength to weight ratio and the stiffness to weight ratio. Additionally, from a structural perspective, it is well known that stiffened wing and fuselage panels often have a postbuckling reserve of strength, allowing them to carry compressive and shear loads exceeding the initial buckling load(Reference Anderson and Kennedy2). Therefore the postbuckling behaviour is also considered when conducting an aircraft design. Figure 1 shows the behaviour of plate structures in buckling and postbuckling ranges. With increasing in-plane load P, the curve follows path A which for a perfect plate shows no displacement w until the critical buckling load is reached. After the bifurcation point B, the curve follows path C for a linear idealization. For large deflection analysis, the curve follows the non-linear path D with increasing slope. The path E indicates buckling and postbuckling behaviour for an imperfect plate.
Load-displacement graph for postbuckling problem.

Research on postbuckling has continued for over a century. The first postbuckling theory can be traced back to 1910 by von Karman who first introduced the large deflection theory(Reference Von Karman, Sechler and Donnell3). Later on, energy considerations for postbuckling analysis were made by Cox et al.(Reference Cox4) After that, Koiter(Reference Koiter5) developed the classical nonlinear bifurcation theory which accelerated the development of nonlinear buckling analysis. Local postbuckling analysis for stiffened panels was first investigated by Graves-Smith and Sridharan(Reference Graves-Smith and Sridharan6). Dawe et al.(Reference Dawe, Lam and Azizian7) used the finite strip method(Reference Cheung8) to analyse local postbuckling.
Stein(Reference Stein, Dawe, Horsington, Kamtekar and Little9) created an analytical postbuckling solution for isotropic and orthtropic plate under compression and shear.
Compared to the finite element method and finite strip method, the exact strip method saves computational time significantly due to a much smaller stiffness matrix. Unlike the finite strip method, the exact strip method(Reference Kennedy, Fischer and Featherston10) for prismatic plate assemblies requires no discretisation in the transverse direction. Instead, analytical solutions of the governing differential equations are obtained, resulting in transcendental eigenvalue problems for critical buckling and free vibration.
In the simplest (VIPASA) form of the analysis(Reference Wittrick and Williams11), the mode shape of buckling or vibration is assumed to vary sinusoidally in the longitudinal (x) direction. The computation is repeated for a set of user specified half-wavelengths λ and converges to the required eigenvalues (i.e. critical buckling loads or natural frequencies) for each λ to any required accuracy using the Wittrick-Williams (W-W) algorithm(Reference Wittrick and Williams12,Reference Wittrick and Williams13) . By choosing half-wavelengths λ which divide exactly into the panel length l, exact solutions are obtained for isotropic and orthotropic panels with simply supported ends and which carry no shear load.
In the VICON analysis(Reference Anderson, Williams and Wright14), the mode shape is represented by a series of sinusoidal terms with different half-wavelengths, in order to analyse panels which are anisotropic or carry shear loads. The eigenvalues are also found using the W-W algorithm, with an extension to allow constraints which couple the exact stiffness matrices for different half-wavelengths so as to satisfy the boundary conditions at the longitudinal ends of the structure. Thus a shear loaded panel can be accurately represented. VICON analysis improves the accuracy for these more general buckling problems and also retains the advantage of computational efficiency, having been shown to be more than 100 times faster than the finite element program STAGS(Reference Butler and Williams15).
This paper outlines recent developments in exact strip postbuckling analysis. The present analysis improves the previous postbuckling analysis in VIPASA to cover plates which are anisotropic or loaded in shear. The governing in-plane equations are derived and solved analytically, using a formulation which extends that of Che et al.(Reference Che, Kennedy and Featherston1) from VIPASA to VICON analysis by including more half-wavelengths. Implementation in the exact strip software VICONOPT(Reference Kennedy, Fischer and Featherston10) thus allows accurate postbuckling analysis for panels with shear loads and anisotropy. Numerical results are given and compared with finite element results to validate the proposed analysis.
2.0 EXACT STRIP ANALYSIS AND WITTRICK-WILLIAMS ALGORITHM
The exact strip method is a numerical analysis method which is similar to the finite strip method(Reference Cheung8) but provides faster and more accurate analysis by reducing the partial differential governing equations to ordinary differential equations which are solved analytically. As in many structural analysis methods, a global stiffness matrix K is assembled using the element stiffness matrices. The elements of K are transcendental functions of the loads and/or the vibration frequency. Thus the critical buckling loads and natural frequencies can be determined by solving the transcendental eigenvalue problem
 $${\bf{KD = 0}}$$
where D is the displacement amplitude vector.
The exact strip method reduces the global stiffness matrix to much smaller order than that of the finite element method. Computational time is therefore saved significantly. In addition the accuracy of exact strip method is more than enough for preliminary aircraft design. A disadvantage compared with the finite element and finite strip methods is that buckling or free vibration requires the solution of a transcendental, rather than a linear eigenvalue problem. However transcendental eigenvalue problems can be solved accurately, quickly and reliably using the W-W algorithm(Reference Wittrick and Williams12,Reference Wittrick and Williams13) .
Instead of finding the eigenvalues directly, the W-W algorithm counts the number of eigenvalues which lie below any trial value f * of f, the load factor or frequency of vibration. The eigenvalues can be referred to as critical buckling load factors or natural frequencies of vibration. The general form of the algorithm can be written as
 $$J = J_0 + {\rm{s}}\left\{ {{\bf{K}}\left( {{\kern 1pt} f^* } \right)} \right\}$$
where J is the number of eigenvalues lying between zero and the trial value f *; J 0 is the number of eigenvalues which would still be exceeded by f * if constraints were imposed so as to make all the displacements D zero; s {K (f *)} is known as the sign count of K, i.e. the number of negative diagonal elements of the upper triangular matrix K∆ (f *) obtained from K (f *) by Gauss elimination(Reference Wittrick and Williams13). J 0 can be calculated from
 $$J_0 = \sum _m J_m $$
where J m, the number of eigenvalues of member m exceeded at the trial value f * when its ends are fully restrained, can be obtained analytically or by numerical procedures(Reference Wittrick and Williams11).
3.0 EXACT STRIP SOFTWARE VICONOPT
VICONOPT(Reference Kennedy, Fischer and Featherston10) covers buckling, postbuckling and free vibration of prismatic assemblies of anisotropic plates loaded by a combination of longitudinally invariant in-plane stresses. The VIPASA analysis in VICONOPT assumes the displacements u, v and w vary sinusoidally in the longitudinal direction with half-wavelength λ as shown in Fig. 2. This assumption gives the out-of-plane displacements as
Simply supported end conditions in VIPASA analysis.

 $$w = f_1 (\,y){\rm{s}}in\left( {{{\pi x} \over \lambda }} \right)$$
where f 1( y) is a function of the transverse location y which is obtained from analytical solutions of the governing equations.
For an orthotropic panel with the simply supported boundary conditions shown in Fig. 2, straight nodal lines are located at sinusoidal intervals which depend on the half-wavelength λ. Therefore simply supported end conditions are automatically satisfied if λ divides exactly into the panel length l.
The above assumptions of no shear load or anisotropy are conditions of VIPASA analysis. If they are violated the nodal lines become skewed and are no longer parallel to the longitudinal ends. Thus the end conditions are not satisfied and VIPASA gives conservative buckling and vibration results, perhaps underestimating the critical buckling load by up to 50%(Reference Kennedy, Williams and Anderson16).
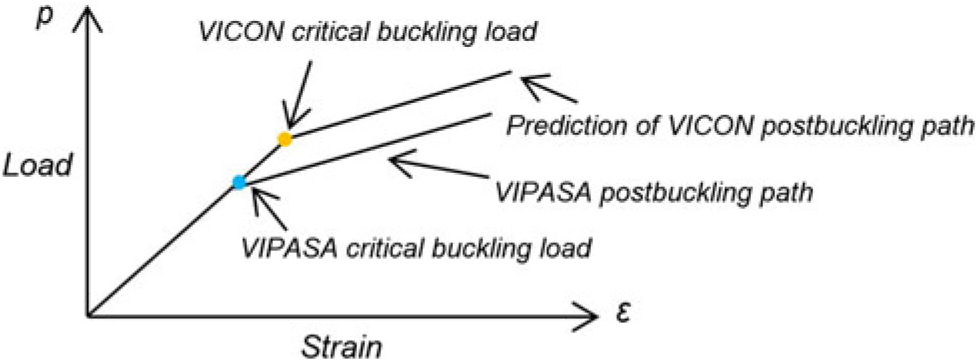
VICON analysis overcomes this weakness of VIPASA by coupling the stiffness matrices of different half-wavelengths and using Lagrangian Multipliers to minimise the total energy of the panel subject to point constrains, e.g. to approximate the required end conditions, see Fig. 2. It can therefore handle assemblies of plates which carry shear load or are made from anisotropic material, or which have a variety of boundary conditions including attachments to beam-type supporting structures(Reference Anderson, Williams and Wright14). Figure 3 shows the VIPASA and VICON differences in the initial buckling stage and a prediction of the VICON postbuckling path when there is shear or anisotropy.
Load and strain paths of VICON and VIPASA for shear or anisotropy.

An infinitely long panel is modelled, with the end supports repeating at longitudinal intervals of the panel length l, see Fig. 4. The mode shapes are assumed to repeat in the longitudinal direction at intervals of L = 2l/ξ, where ξ is a parameter in the range 0 ≤ ξ ≤ 1. The mode shapes can therefore be represented(Reference Anderson, Williams and Wright14) by a series of responses with half-wavelengths l/(ξ + 2m) where m is any integer. Sufficient accuracy is obtained by considering a finite series of half-wavelengths
Illustration of an infinitely long plate assembly with point supports (a) plan view (b) isometric view.

 $$\lambda _{\rm{m}} = {l \over {\left( {\xi + {\rm{2}}m} \right)}}{\rm{(}}m = 0,\; \pm 1,\; \pm 2, \ldots , \pm q)$$
where the integer q determines the number of terms in the series.
Like VIPASA analysis, VICON analysis uses the W-W algorithm to obtain the natural frequencies of vibration and the critical buckling loads. Derivations of the governing equations and stiffness matrices, and the use of Lagrangian multipliers can found in(Reference Anderson, Williams and Wright14,Reference Williams and Anderson17) .
4.0 POSTBUCKLING IN VIPASA
Aircraft structures such as stiffened panels can often carry loads far in excess of their critical buckling loads. By fully utilising the postbuckling reserve of strength, the aircraft mass can be significantly reduced. Postbuckling in VICONOPT(Reference Powell, Williams, Askar and Kennedy18) firstly assumed that plates with regular geometry are simply supported and buckle sinusoidally with half-wavelength λ. The stress distribution was assumed to remain invariant in the longitudinal direction. Later on, Anderson and Kennedy(Reference Anderson and Kennedy2) implemented a Newton iteration scheme into VICONOPT to improve the convergence on the critical buckling load and associated mode which solve Equation (1). The mode vector D = {D j;j = 1, ... n} includes displacements and rotations both at the longitudinal plate edges and strip edges of each plate. K = {K j ; i, j = 1, ... n} is the corresponding exact stiffness matrix, which is a transcendental function of the stress resultants in each strip, and hence also of D. Suppose that
 $${\bf{D}} = {\bf{D}}^* + {\bf{d}}$$
where D* is a trial mode vector and d = {d j; j = 1, ... n} is the adjustment needed to D* in order to solve Equation (1), The Newton iteration is expressed in the matrix form as
 $$\left( {{\bf{K}}^* + \sum _{j = 1}^n {{\partial {\bf{K}}^* } \over {\partial D_j }}d_j } \right)({\bf{D}}^ * + {\bf{d)}} = {\bf{0}}$$
where K* = K(D*). Neglecting higher order terms, Equation (7) becomes
 $$\sum _{j = 1}^n \left( {K_{ij}^* + \sum _{k = 1}^n {{\partial K_{ik}^* } \over {\partial D_j }}D_k^* } \right)d_j = - \sum _{j = 1}^n K_{ij}^{\bf{*}} D_j^{\bf{*}} \;(i = 1{\bf{,}} \ldots n{\bf{)}}$$
After solving the equation, adjustments vector d can be obtained. Substituting d into Equation (6) gives the mode vector D which is used in the new iteration.
Che et al.(Reference Che, Kennedy and Featherston1) obtained a more accurate stress distribution using an improved exact strip postbuckling analysis extended from Stein(Reference Stein, Dawe, Horsington, Kamtekar and Little9). In this method, plates are divided into longitudinal strips, for which the governing equations are derived and solved analytically. It utilizes the out-of-plane results obtained from VIPASA analysis which vary sinusoidally with one half-wavelength λ. The out-of-plane displacement and rotation at node i are given by
 $$\[{w_i} = {w_{ic}}\cos \left( {\frac{{\pi x}}{\lambda }} \right) + {w_{is}}\sin \left( {\frac{{\pi x}}{\lambda }} \right);{\psi _i} = {\psi _{ic}}\cos \left( {\frac{{\pi x}}{\lambda }} \right) + {\psi _{is}}\sin \left( {\frac{{\pi x}}{\lambda }} \right)\]$$
The in plane displacements are assumed to vary as the sums of linear, constant and sinusoidal terms with two half-wavelengths λ and λ/2.
 $$u_i = \overline \varepsilon \left( {x - {a \over 2}} \right) + \;u_{i0} + u_{ic} \cos \left( {{{\pi x} \over \lambda }} \right) + u_{is} \sin \left( {{{\pi x} \over \lambda }} \right)\;\; + u_{ic} \cos \left( {{{2\pi x} \over \lambda }} \right) + u_{is} \sin \left( {{{2\pi x} \over \lambda }} \right)\;\;$$
 $$v_i = v_{i0} + u_{ic} \cos \left( {{{\pi x} \over \lambda }} \right) + v_{is} \sin \left( {{{\pi x} \over \lambda }} \right)\;\; + v_{ic} \cos \left( {{{2\pi x} \over \lambda }} \right) + v_{is} \sin \left( {{{2\pi x} \over \lambda }} \right)\;\;$$
The improved method shows a great improvement compared to the previous one. However, because it is restricted to the VIPASA analysis, when solving problems of anisotropic plates or plates loaded in shear the skewed modes do not satisfy the end conditions and the results have unrealistically high errors or may fail to converge.
5.0 POSTBUCKLING IN VICON
VICON can solve shear loaded and anisotropic plate problems more accurately by coupling responses with more than one half-wavelength. Based on Che’s improved exact strip postbuckling method(Reference Che, Kennedy and Featherston1), accurate stress distributions can be found for each stage of the postbuckling. Previous postbuckling analysis with the VIPASA analysis of VICONOPT gives good agreement for orthotropic plates without shear, i.e. with no skewing in the mode shape. Therefore applying the improved exact strip method could also allow for postbuckling when the VICON analysis is used.
The previous method was based on out-of-plane deflection results obtained from VIPASA analysis, i.e. only one half-wavelength was included. In VICON analysis, the out-of-plane displacements are assumed to vary as the sum of sinusoidal responses with more than one half-wavelength. As a result, the in-plane displacements, strains and stress resultants to be found by the following analysis will involve responses with additional half-wavelengths, as shown in Fig. 5.
Calculation procedures.

5.1 Displacements
The plates are divided into n-1 strips with arbitrary width, as identified by the n nodes at the strip edges. At each node i, the out-of-plane deflections w i and rotations φ i about the x axis are assumed to vary as the sum of sinusoidal responses in the longitudinal direction with half-wavelengths λ m, and are written in the form
 $$\left[ {\matrix{
{w_i } \cr
{\varphi _i } \cr
} } \right] = \left[ {\matrix{
{\sum _m w_{imc} cos{{\pi x} \over {\lambda _m }} + w_{ims} sin{{\pi x} \over {\lambda _m }}} \cr
{\sum _m \varphi _{imc} cos{{\pi x} \over {\lambda _m }} + \varphi _{ims} sin{{\pi x} \over {\lambda _m }}} \cr
} } \right]$$
where the amplitudes w imc, w ims, φ imc and φ ims are obtained from a VICON eigenvalue analysis at the previous iteration.
According to classical plate theory, it is assumed that  $
\varphi _i = w_i ^'
$, where the prime indicates the derivative with respect to the transverse direction y. The subscript m denotes the sequence of out-of-plane half-wavelengths.
As described above, the in-plane displacements are assumed to be:
 $$\left[ {\matrix{
{u_i } \cr
{v_i } \cr
} } \right] = \left[ {\matrix{
{\overline {\varepsilon _x } \left( {x - {a \over 2}} \right) + \sum _k u_{ikc} cos{{\pi x} \over {\lambda _k }} + u_{iks} sin{{\pi x} \over {\lambda _k }}} \cr
{\overline {\varepsilon _y } \left( {\,y - {b \over 2}} \right) + \sum _k v_{ikc} cos{{\pi x} \over {\lambda _k }} + v_{iks} sin{{\pi x} \over {\lambda _k }}} \cr
} } \right]$$
The linear terms  $
\overline {\varepsilon _x }
$ and
 $
\overline {\varepsilon _y }
$ denote the applied longitudinal and transverse strains. The subscript k denotes the sequence of in-plane half-wavelengths. a is the plate length and b is its width.
5.2 Strains and curvatures
Based on von Karman’s large deflection theory, strains and curvature are given by:
 $$\left[ {\matrix{
{\varepsilon _{xi} } \cr
{\varepsilon _{yi} } \cr
{\varepsilon _{xyi} } \cr
{\kappa _{xi} } \cr
{\kappa _{yi} } \cr
{\kappa _{xyi} } \cr
} } \right] = \left[ {\matrix{
{{{\partial u_i } \over {\partial x}} + {1 \over 2}\left( {{{\partial w_i } \over {\partial x}}} \right)^2 } \cr
{{{\partial v_i } \over {\partial y}} + {1 \over 2}\left( {{{\partial w_i } \over {\partial y}}} \right)^2 } \cr
{{{\partial u_i } \over {\partial y}} + {{\partial v_i } \over {\partial x}} + {{\partial w_i } \over {\partial x}}{{\partial w_i } \over {\partial y}}} \cr
{ - {{\partial ^2 w_i } \over {\partial x^2 }}} \cr
{ - {{\partial ^2 w_i } \over {\partial y^2 }}} \cr
{ - {\rm{2}}{{\partial ^2 w_i } \over {\partial x\partial y}}} \cr
} } \right] = \left[ {\matrix{
{\varepsilon _{xi0} } \cr
{\varepsilon _{yi0} } \cr
{\gamma _{xyi0} } \cr
{\kappa _{xi0} } \cr
{\kappa _{yi0} } \cr
{\kappa _{xyi0} } \cr
} \matrix{
{\varepsilon _{xi1c} } \cr
{\varepsilon _{yi1c} } \cr
{\gamma _{xyi1c\;} } \cr
{\kappa _{xi1c} } \cr
{\kappa _{yi1c} } \cr
{\kappa _{xyi1c} } \cr
} \;\matrix{
{\varepsilon _{xi1s} } \cr
{\varepsilon _{yi1s} } \cr
{\gamma _{xyi1s} } \cr
{\kappa _{xi1s} } \cr
{\kappa _{yi1s} } \cr
{\kappa _{xyi1s} } \cr
} \;\matrix{
\cdots \cr
\cdots \cr
\cdots \cr
\cdots \cr
\cdots \cr
\cdots \cr
} \;} \right]\left[ {\matrix{
1 \cr
{\cos \left( {{{\pi x} \over {\lambda _1 }}} \right)\;} \cr
{\sin \left( {{{\pi x} \over {\lambda _1 }}} \right)\;} \cr
{\cos \left( {{{\pi x} \over {\lambda _2 }}} \right)\;} \cr
{\sin \left( {{{\pi x} \over {\lambda _2 }}} \right)\;} \cr
{\cos \left( {{{\pi x} \over {\lambda _3 }}} \right)\;} \cr
{\sin \left( {{{\pi x} \over {\lambda _3 }}} \right)\;} \cr
\vdots \cr
} } \right]$$
Substituting from Equation (13) into Equation (14) gives
 $$\left[ {\matrix{
{\user2{e}_i } \cr
{\user2{k}_i } \cr
} } \right] = \left[ {\matrix{
{\user2{e}_0 (w_i )} \cr
{\user2{k}_0 (w_i )} \cr
} } \right] + \left[ {\matrix{
{\user2{e}_1 } \cr
{\bf{0}} \cr
} } \right]u_i + \left[ {\matrix{
{\user2{e}_2 } \cr
{\bf{0}} \cr
} } \right]u_i^' $$
 $$w_i = \left[ {\matrix{
{w_{i1c} } \cr
{w_{i1s} } \cr
{w_{i2c} } \cr
{w_{i2s} } \cr
\vdots \cr
} } \right],u_i = \left[ {\matrix{
{v_{i0} } \cr
{v_{i1c} } \cr
{v_{i1s} } \cr
{v_{i2c} } \cr
\vdots \cr
{\matrix{
{u_{i0} } \cr
{u_{i1c} } \cr
{u_{i1s} } \cr
{u_{i2c} } \cr
\vdots \cr
} } \cr
} } \right],\user2{e}_i = \left[ {\matrix{
{\varepsilon _{xi0} } \cr
{\varepsilon _{xi1c} } \cr
{\varepsilon _{xi1s} } \cr
{\varepsilon _{xi2c} } \cr
\vdots \cr
{\matrix{
{\varepsilon _{yi0} } \cr
{\varepsilon _{yi1c} } \cr
{\varepsilon _{yi1s} } \cr
{\varepsilon _{yi2c} } \cr
\vdots \cr
{\matrix{
{\gamma _{xyi0} } \cr
{\gamma _{xyi1c} } \cr
{\gamma _{xyi1s} } \cr
{\gamma _{xyi2c} } \cr
\vdots \cr
} } \cr
} } \cr
} } \right],\;\user2{k}_i = \left[ {\matrix{
{\kappa _{xi0} } \cr
{\kappa _{xi1c} } \cr
{\kappa _{xi1s} } \cr
{\kappa _{xi2c} } \cr
\vdots \cr
{\matrix{
{\kappa _{yi0} } \cr
{\kappa _{yi1c} } \cr
{\kappa _{yi1s} } \cr
{\kappa _{xi2c} } \cr
\vdots \cr
{\matrix{
{\kappa _{xyi0} } \cr
{\kappa _{xyi1c} } \cr
{\kappa _{xyi1s} } \cr
{\kappa _{xyi2c} } \cr
\vdots \cr
} } \cr
} } \cr
} } \right]$$
The vector ε0 (wi) can also be partitioned into  $
\left[ {\matrix{
{\user2{e}_{0x} \left( {w_i } \right)} \cr
{\user2{e}_{0y} \left( {w_i } \right)} \cr
{\user2{e}_{0xy} \left( {w_i } \right)} \cr
} } \right]
$, where
 $$\user2{e}_{0x} \left( {w_i } \right) = {1 \over 2}\left( {{{\partial w} \over {\partial x}}} \right)^2 = {1 \over 2}\sum _m \sum _n \left( {\matrix{
{ - w_{imc} w_{inc} {{\pi ^2 } \over {\lambda _m \lambda _n }}{\rm{s}}in\left( {{{\pi x} \over {\lambda _m }}} \right){\rm{s}}in\left( {{{\pi x} \over {\lambda _n }}} \right)} \cr
{ + w_{ims} w_{ins} {{\pi ^2 } \over {\lambda _m \lambda _n }}{\rm{c}}os\left( {{{\pi x} \over {\lambda _m }}} \right){\rm{c}}os\left( {{{\pi x} \over {\lambda _n }}} \right)} \cr
{ - w_{imc} w_{ins} {{\pi ^2 } \over {\lambda _m \lambda _n }}{\rm{s}}in\left( {{{\pi x} \over {\lambda _m }}} \right){\rm{c}}os\left( {{{\pi x} \over {\lambda _n }}} \right)} \cr
{ - w_{ims} w_{inc} {{\pi ^2 } \over {\lambda _m \lambda _n }}{\rm{c}}os\left( {{{\pi x} \over {\lambda _m }}} \right){\rm{s}}in\left( {{{\pi x} \over {\lambda _n }}} \right)} \cr
} } \right)$$
 $$\user2{e}_{0y} \left( {w_i } \right) = {1 \over 2}\left( {{{\partial w} \over {\partial y}}} \right)^2 = {1 \over 2}\sum _m \sum _n \left( {\matrix{
{\varphi _{imc} \varphi _{inc} {{\pi ^2 } \over {\lambda _m \lambda _n }}{\rm{c}}os\left( {{{\pi x} \over {\lambda _m }}} \right){\rm{c}}os\left( {{{\pi x} \over {\lambda _n }}} \right)} \cr
{ + \varphi _{ims} \varphi _{ins} {{\pi ^2 } \over {\lambda _m \lambda _n }}{\rm{s}}in\left( {{{\pi x} \over {\lambda _m }}} \right){\rm{s}}in\left( {{{\pi x} \over {\lambda _n }}} \right)} \cr
{ + \varphi _{imc} \varphi _{ins} {{\pi ^2 } \over {\lambda _m \lambda _n }}{\rm{c}}os\left( {{{\pi x} \over {\lambda _m }}} \right){\rm{s}}in\left( {{{\pi x} \over {\lambda _n }}} \right)} \cr
{ + \varphi _{ims} \varphi _{inc} {{\pi ^2 } \over {\lambda _m \lambda _n }}{\rm{s}}in\left( {{{\pi x} \over {\lambda _m }}} \right){\rm{c}}os\left( {{{\pi x} \over {\lambda _n }}} \right)} \cr
} } \right)$$
 $$\user2{e}_{0xy} \left( {w_i } \right) = {{\partial w} \over {\partial x}} \cdot {{\partial w} \over {\partial y}} = \sum _m \sum _n {\pi \over {\lambda _m }}\left( {\matrix{
{w_{ims} \varphi _{inc} {{\pi ^2 } \over {\lambda _m \lambda _n }}{\rm{c}}os\left( {{{\pi x} \over {\lambda _m }}} \right){\rm{c}}os\left( {{{\pi x} \over {\lambda _n }}} \right)} \cr
{ - w_{imc} \varphi _{inc} {{\pi ^2 } \over {\lambda _m \lambda _n }}{\rm{s}}in\left( {{{\pi x} \over {\lambda _m }}} \right){\rm{c}}os\left( {{{\pi x} \over {\lambda _n }}} \right)} \cr
{ + w_{ims} \varphi _{ins} {{\pi ^2 } \over {\lambda _m \lambda _n }}{\rm{c}}os\left( {{{\pi x} \over {\lambda _m }}} \right){\rm{s}}in\left( {{{\pi x} \over {\lambda _n }}} \right)} \cr
{ - w_{imc} \varphi _{ins} {{\pi ^2 } \over {\lambda _m \lambda _n }}{\rm{s}}in\left( {{{\pi x} \over {\lambda _m }}} \right){\rm{s}}in\left( {{{\pi x} \over {\lambda _n }}} \right)} \cr
} } \right)$$
Substituting λ m = l/m, λ n = l/n into Equations (17)– (19) and simplifying,
 $$\user2{e}_{0x} \left( {w_i } \right) = {{\pi ^2 } \over {{\rm{4}}l^2 }}\sum _m \sum _n mn\left( {\matrix{
{\left( {w_{imc} w_{inc} + w_{ims} w_{ins} } \right){\rm{c}}os[(m - n){{\pi x} \over l}{\rm{]}}} \cr
{ + \left( {w_{ims} w_{ins} - w_{imc} w_{inc} } \right){\rm{c}}os[(m + n){{\pi x} \over l}{\rm{]}}} \cr
{ + \left( { - w_{ims} w_{inc} - w_{imc} w_{ins} } \right){\rm{s}}in[(m + n){{\pi x} \over l}{\rm{]}}} \cr
{ + \left( { - w_{imc} w_{inc} + w_{ims} w_{ins} } \right){\rm{s}}in[(m - n){{\pi x} \over l}{\rm{]}}} \cr
} } \right)$$
 $$\user2{e}_{0y} \left( {w_i } \right) = {1 \over {\rm{4}}}\sum _m \sum _n \left( {\matrix{
{\left( {\varphi _{imc} \varphi _{inc} + \varphi _{ims} \varphi _{ins} } \right){\rm{c}}os[(m - n){{\pi x} \over l}{\rm{]}}} \cr
{ + \left( {\varphi _{imc} \varphi _{inc} - \varphi _{ims} \varphi _{ins} } \right){\rm{c}}os[(m + n){{\pi x} \over l}{\rm{]}}} \cr
{ + \left( {\varphi _{ims} \varphi _{inc} - \varphi _{imc} \varphi _{ins} } \right){\rm{s}}in[(m - n){{\pi x} \over l}{\rm{]}}} \cr
{ + \left( {\varphi _{imc} \varphi _{ins} + \varphi _{ims} \varphi _{inc} } \right){\rm{s}}in[(m + n){{\pi x} \over l}{\rm{]}}} \cr
} } \right)$$
 $$\user2{e}_{0xy} \left( {w_i } \right) = {\pi \over {2l}}\sum _m \sum _n m\left( {\matrix{
{\left( {w_{imc} \varphi _{inc} + w_{ims} \varphi _{ins} } \right){\rm{c}}os[(m - n){{\pi x} \over l}{\rm{]}}} \cr
{ + \left( {w_{ims} \varphi _{inc} - w_{imc} \varphi _{ins} } \right){\rm{c}}os[(m + n){{\pi x} \over l}{\rm{]}}} \cr
{ + \left( { - w_{imc} \varphi _{inc} + w_{ims} \varphi _{ins} } \right){\rm{s}}in[(m + n){{\pi x} \over l}{\rm{]}}} \cr
{ + \left( { - w_{imc} \varphi _{inc} + w_{ims} \varphi _{ins} } \right){\rm{s}}in[(m - n){{\pi x} \over l}{\rm{]}}} \cr
} } \right)$$
Here c and s denotes the cos components and sin components respectively. The values of (m − n) and (m + n) decide the number of in-plane half-wavelengths λ m to be used, which are generalized from summations and subtractions of the out-of-plane wavelength terms. For example, if ξ = 1 and q = 2 in Equation (5), the out-of-plane half-wavelengths are λ m = l/m, m = (1, 3, 5). The summations and subtractions are shown in Tables 1 and 2, respectively.
Summations of half-wavelengths l/m and l/n, m,n=(1,3,5)

Subtractions of half-wavelengths l/m and l/n, m,n=(1,3,5)

Considering the unique values in Tables 1 and 2, the half-wavelengths for the in-plane displacements will be λ k = l/k, k=(0,1,2,3,4,5,6,8,10). When (m-n)=0, i.e. the half-wavelength λ k = ∞, its cosine term is a constant term while its sine term is identically zero and is omitted from the analysis.
In Equation (15),
 $$\user2{e}_1 = \left[ {\matrix{
J \cr
{{\bf{0}}_{2Q - 1} } \cr
{{\bf{0}}_{2Q - 1} } \cr
} \matrix{
{{\bf{0}}_{2Q - 1} } \cr
{{\bf{0}}_{2Q - 1} } \cr
J \cr
} } \right],\user2{e}_2 = \left[ {\matrix{
{{\bf{0}}_{2Q - 1} } \cr
{{\bf{0}}_{2Q - 1} } \cr
{I_{2Q - 1} } \cr
} \matrix{
{{\bf{0}}_{2Q - 1} } \cr
{I_{2Q - 1} } \cr
{{\bf{0}}_{2Q - 1} } \cr
} } \right]$$
 $$J = \left[ {\matrix{
{\lambda _1 {\pi \over l}} \cr
0 \cr
0 \cr
0 \cr
0 \cr
\vdots \cr
0 \cr
0 \cr
} \;\matrix{
0 \cr
0 \cr
{ - \lambda _2 \omega _i } \cr
0 \cr
0 \cr
\vdots \cr
0 \cr
0 \cr
} \;\matrix{
0 \cr
{\lambda _2 {\pi \over l}} \cr
0 \cr
0 \cr
0 \cr
\vdots \cr
0 \cr
0 \cr
} \;\matrix{
0 \cr
0 \cr
0 \cr
0 \cr
{ - \lambda _3 {\pi \over l}} \cr
\vdots \cr
0 \cr
0 \cr
} \;\matrix{
0 \cr
0 \cr
0 \cr
{\lambda _3 {\pi \over l}} \cr
0 \cr
\vdots \cr
0 \cr
0 \cr
} \;\matrix{
\cdots \cr
\cdots \cr
\cdots \cr
\cdots \cr
\cdots \cr
\ddots \cr
0 \cr
0 \cr
} \matrix{
0 \cr
0 \cr
0 \cr
0 \cr
0 \cr
0 \cr
0 \cr
{ - \lambda _k {\pi \over l}} \cr
} \;\matrix{
0 \cr
0 \cr
0 \cr
0 \cr
0 \cr
0 \cr
{\lambda _k {\pi \over l}} \cr
0 \cr
} } \right]$$
where I2Q−1 and 02Q−1 are unit and null matrices of order of 2Q-1, respectively and Q is the number of unique values of k found from Tables 1 and 2.
An analogous procedure can be used to find the curvatures κi. For simplicity, these are not given here, as the following section shows that they are not required when the coupling stiffness matrix B = 0, e.g. for the common situations of composite plates with a symmetric layup.
5.3 Stresses and equilibrium equations
The stress resultants N xi, N yi and N xyi are needed for the equilibrium equations and final analysis. For a general anisotropic plate, the relationships between stress and strain can be obtained by
 $$\left[ {\matrix{
{N_{xi} } \cr
{N_{yi} } \cr
{N_{xyi} } \cr
} } \right] = \left[ {\matrix{
{A_{i{\rm{1}}1} } \cr
{A_{i{\rm{1}}2} } \cr
{A_{i{\rm{1}}6} } \cr
} \;\matrix{
{A_{i{\rm{1}}2} } \cr
{A_{i{\rm{2}}2} } \cr
{A_{i{\rm{2}}6} } \cr
} \;\matrix{
{A_{i{\rm{1}}6} } \cr
{A_{i{\rm{2}}6} } \cr
{A_{i{\rm{6}}6} } \cr
} } \right]\left[ {\matrix{
{\varepsilon _{xi} } \cr
{\varepsilon _{yi} } \cr
{\varepsilon _{xyi} } \cr
} } \right] + \left[ {\matrix{
{B_{i{\rm{1}}1} } \cr
{B_{i{\rm{1}}2} } \cr
{B_{i{\rm{1}}6} } \cr
} \;\matrix{
{B_{i{\rm{1}}2} } \cr
{B_{i{\rm{2}}2} } \cr
{B_{i{\rm{2}}6} } \cr
} \;\matrix{
{B_{i{\rm{1}}6} } \cr
{B_{i{\rm{2}}6} } \cr
{B_{i{\rm{6}}6} } \cr
} } \right]\left[ {\matrix{
{\kappa _{xi} } \cr
{\kappa _{yi} } \cr
{\kappa _{xyi} } \cr
} } \right]$$
Substituting Equation (25) into Equation (15) gives
 $$\left[ {\matrix{
{N_i } \cr
{N_i^' } \cr
} } \right] = \overline {A_i } \left[ {\matrix{
{\user2{e}_0 (w_i )} \cr
{\user2{e}_0^' (w_i )} \cr
} } \right] + \overline {B_i } \left[ {\matrix{
{\user2{k}_0 (w_i )} \cr
{\user2{k}_0^' (w_i )} \cr
} } \right] + \overline {A_i } \user2{e}_1 \left[ {\matrix{
{u_i } \cr
{u_i^' } \cr
} } \right] + \overline {A_i } \user2{e}_2 \left[ {\matrix{
{u_i^' } \cr
{u_i^{''} } \cr
} } \right]$$
where
 $$N_i = \left[ {N_1 \;N_2 \;N_3 \; \cdots N_{2Q - 1} } \right]^T $$
 $$\overline {A_i } = \left[ {\matrix{
{A_{i{\rm{1}}1} I_{2Q - 1} } \cr
{A_{i{\rm{1}}2} I_{2Q - 1} } \cr
{A_{i{\rm{1}}6} I_{2Q - 1} } \cr
} \;\matrix{
{A_{i{\rm{1}}2} I_{2Q - 1} } \cr
{A_{i{\rm{2}}2} I_{2Q - 1} } \cr
{A_{i{\rm{2}}6} I_{2Q - 1} } \cr
} \;\matrix{
{A_{i{\rm{1}}6} I_{2Q - 1} } \cr
{A_{i{\rm{2}}6} I_{2Q - 1} } \cr
{A_{i{\rm{6}}6} I_{2Q - 1} } \cr
} } \right]$$
 $$\overline {B_i } = \left[ {\matrix{
{B_{i{\rm{1}}1} I_{2Q - 1} } \cr
{B_{i{\rm{1}}2} I_{2Q - 1} } \cr
{B_{i{\rm{1}}6} I_{2Q - 1} } \cr
} \;\matrix{
{B_{i{\rm{1}}2} I_{2Q - 1} } \cr
{B_{i{\rm{2}}2} I_{2Q - 1} } \cr
{B_{i{\rm{2}}6} I_{2Q - 1} } \cr
} \;\matrix{
{B_{i{\rm{1}}6} I_{2Q - 1} } \cr
{B_{i{\rm{2}}6} I_{2Q - 1} } \cr
{B_{i{\rm{6}}6} I_{2Q - 1} } \cr
} } \right]$$
 $
\user2{e}_0^' (w_i )
$ is the derivative of ε0(wi) with respect to y.
After obtaining all these expressions, the equilibrium equations are assembled and solved to find the in-plane displacements u and v.
 $${{\partial N_{yi} } \over {\partial y}} + {{\partial N_{xyi} } \over {\partial x}} = 0$$
 $${{\partial N_{xyi} } \over {\partial y}} + {{\partial N_{xi} } \over {\partial x}} = 0$$
Substituting Equation (25) into the Equations (30) and (31), for each node 2*(2Q-1) equilibrium equations are given in terms of the unknowns u i and υ i. After solving the equilibrium equations, substituting the values of u i and υ i back into Equations (14) and (25) gives the strains and stresses.
All the plate edges are restrained against out-of-plane deflection. Three different in-plane boundary conditions are considered on the longitudinal edges: free edges, fixed edges and straight edges. In the free edge case there is no restraint on transverse displacement. The fixed edge case has transverse displacement constraints on all components of v. For the straight edge case, the two longitudinal edges remain straight but can move towards or away from each other. Restraints are imposed on all the sinusoidal components of v but the constant component is unrestrained.
The results which follow will all be for the stress distributions in the initial postbuckling calculations when the strain is 2% above the critical buckling strain. In order to extend the present analysis to practical design levels, the Newton iteration procedure in VICONOPT will be used, i.e. utilizing the stress distributions obtained here to obtain out-of-plane mode shapes at further strain increments. Further VICON postbuckling results will be presented in future publications.
6.0 ILLUSTRATIVE RESULTS
In this section, illustrative results are given for two examples.
6.1 Composite plate loaded in compression
In order to compare the method with the previous (VIPASA) postbuckling analysis in VICONOPT, the first example is chosen from Che(Reference Che19). It is a symmetric balanced composite square plate with length 0.3m and thickness 0.002m. The composite consists of 8 layers with ply angles [0, 45, −45, 90, 90, −45, 45, 0]. The material properties are Young’s moduli E 11 = 121kNmm−2, E 22 = 1.30kNmm −2, shear moduli G 12 = G 13 = G 23 = 6.41kNmm−2 and Poisson’s ratio ν 12 = 0.38. The overall laminate stiffness are shown in Table 3. The plate is simply supported with respect to out-of-plane displacement w on all four edges, fixed against in-plane displacement v on the unloaded edges and free to deflect in-plane on the loaded edges. Uniform compression is applied to the left and right sides of the plate as shown in Fig. 6. For the postbuckling analysis the plate is divided into n=10 strips of equal width, and the VICON analysis uses ξ = 1 and q = 2 in Equation (5).
Loads and edge assignments for example 1.

Laminate stiffness of example 1

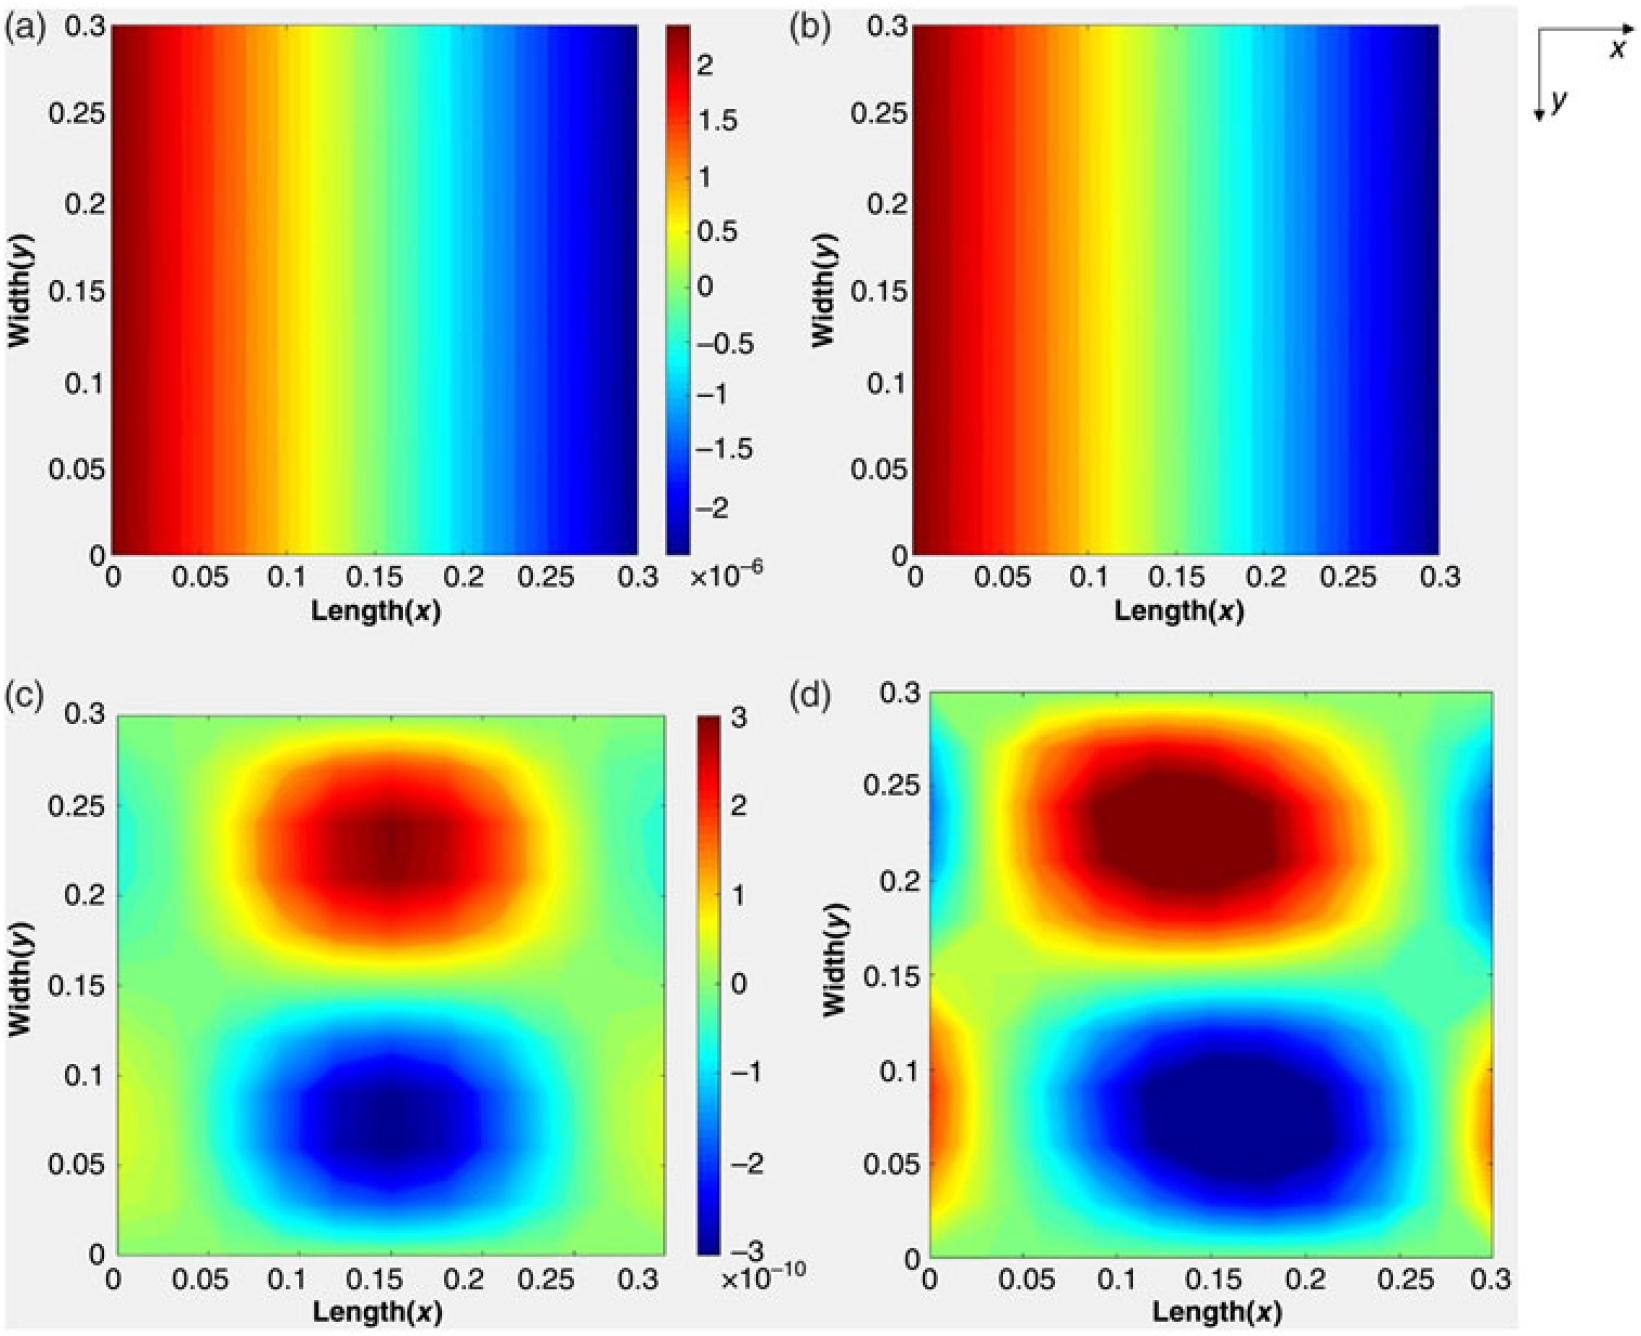
The analysis gives the first cycle of the postbuckling which for illustration utilises out-ofplane displacements with just three half-wavelengths obtained from VICON analysis when the longitudinal strain exceeds the initial buckling strain by 2%. Figure 7(a) and (c) shows the in-plane displacement contour plots. The results are validated against finite element analysis using a mesh of 20 × 20 ABAQUS S4R elements(20), see Fig. 7(b) and (d).
Variation of in-plane displacements (a) u displacement (present analysis). (b) u displacement (ABAQUS analysis). (c) v displacement (present analysis). (d) v displacement (ABAQUS analysis).

As shown in Fig. 7(a) and (b), the uniform compression leads to uniform u displacement contours. The left and right edges equally move to each other as shown in both the present result and the ABAQUS result. Figure 7(c) and (d) shows the v displacement contours. It can be seen that the present result is slightly skewed but less than the ABAQUS result. The reason can be found from the w displacement assumption from VICON which contains three half-wavelengths. Theoretically only an infinite series of half-wavelengths can represent the accurate results. Therefore three half-wavelengths result in losing some accuracy. The user can increase the number of half-wavelengths if required.
Figure 8 gives the longitudinal stress resultants N x, N y, N xy at the top surface of the plate. All the contours are antisymmetric and skewed as expected, and the results from the present analysis are close to the finite element results. A sample result from the previous VICONOPT analysis [Fig. 8(c)] fails to capture the antisymmetry and skewing.
Variation of stresses on the top surface of the plate. (a) N x (present analysis). (b) N x (ABAQUS analysis). (c) N x (previous VICONOPT analysis). (d) N y (present analysis). (e) N y (ABAQUS analysis). (f) N xy (present analysis). (g) N xy (ABAQUS analysis).

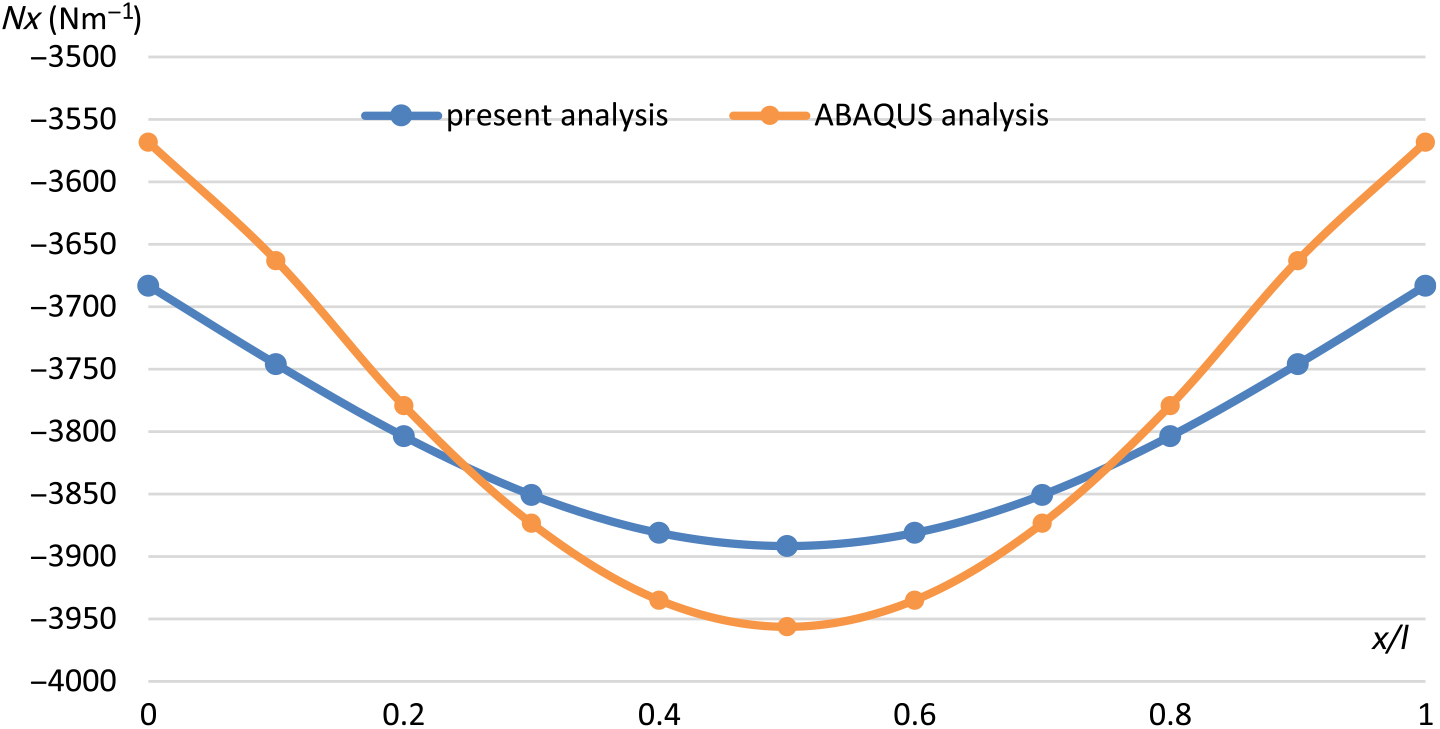
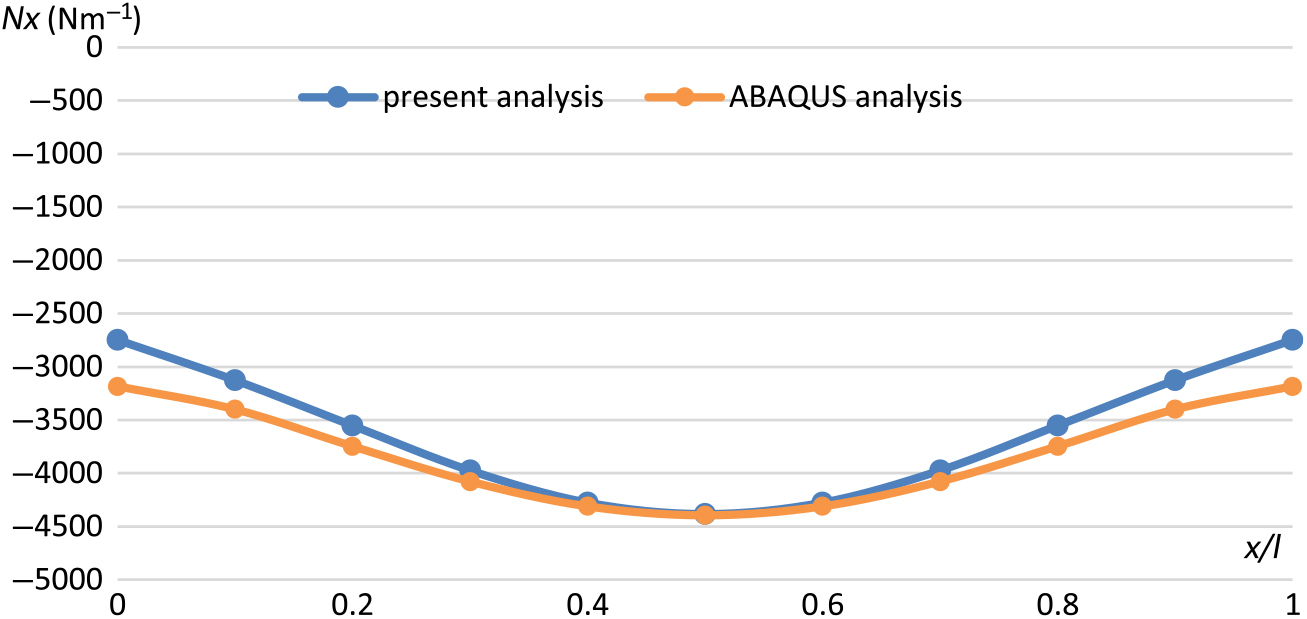
Figure 9 gives a quantitative comparison of stress resultant N x along the longitudinal centre line of the plate between ABAQUS and present analysis. The values are all symmetric as expected, with the compressive stress being greatest at the centre and decreasing towards the two ends. The greatest discrepancy of 3.2% occurred at the two ends of the plate. However the present analysis has less variation than ABAQUS which can be explained as due to displacement differences as demonstrated above.
Stress resultant N x on top surface of the plate.

6.2 Isotropic plate loaded in compression and shear
The second example is a square isotropic plate loaded under equal longitudinal compression N x and shear N xy. The plate has length 0.3m and thickness 0.001m with the material properties Young’s modulus E = 110 kNmm−2 and Poisson’s ratio ν = 0.3. All four edges are simply supported against out-of-plane displacement, fixed against in-plane displacement v on the unloaded edges and free to deflect in-plane on the loaded edges as shown in Fig. 10.
Loads and edge assignments for example 2.

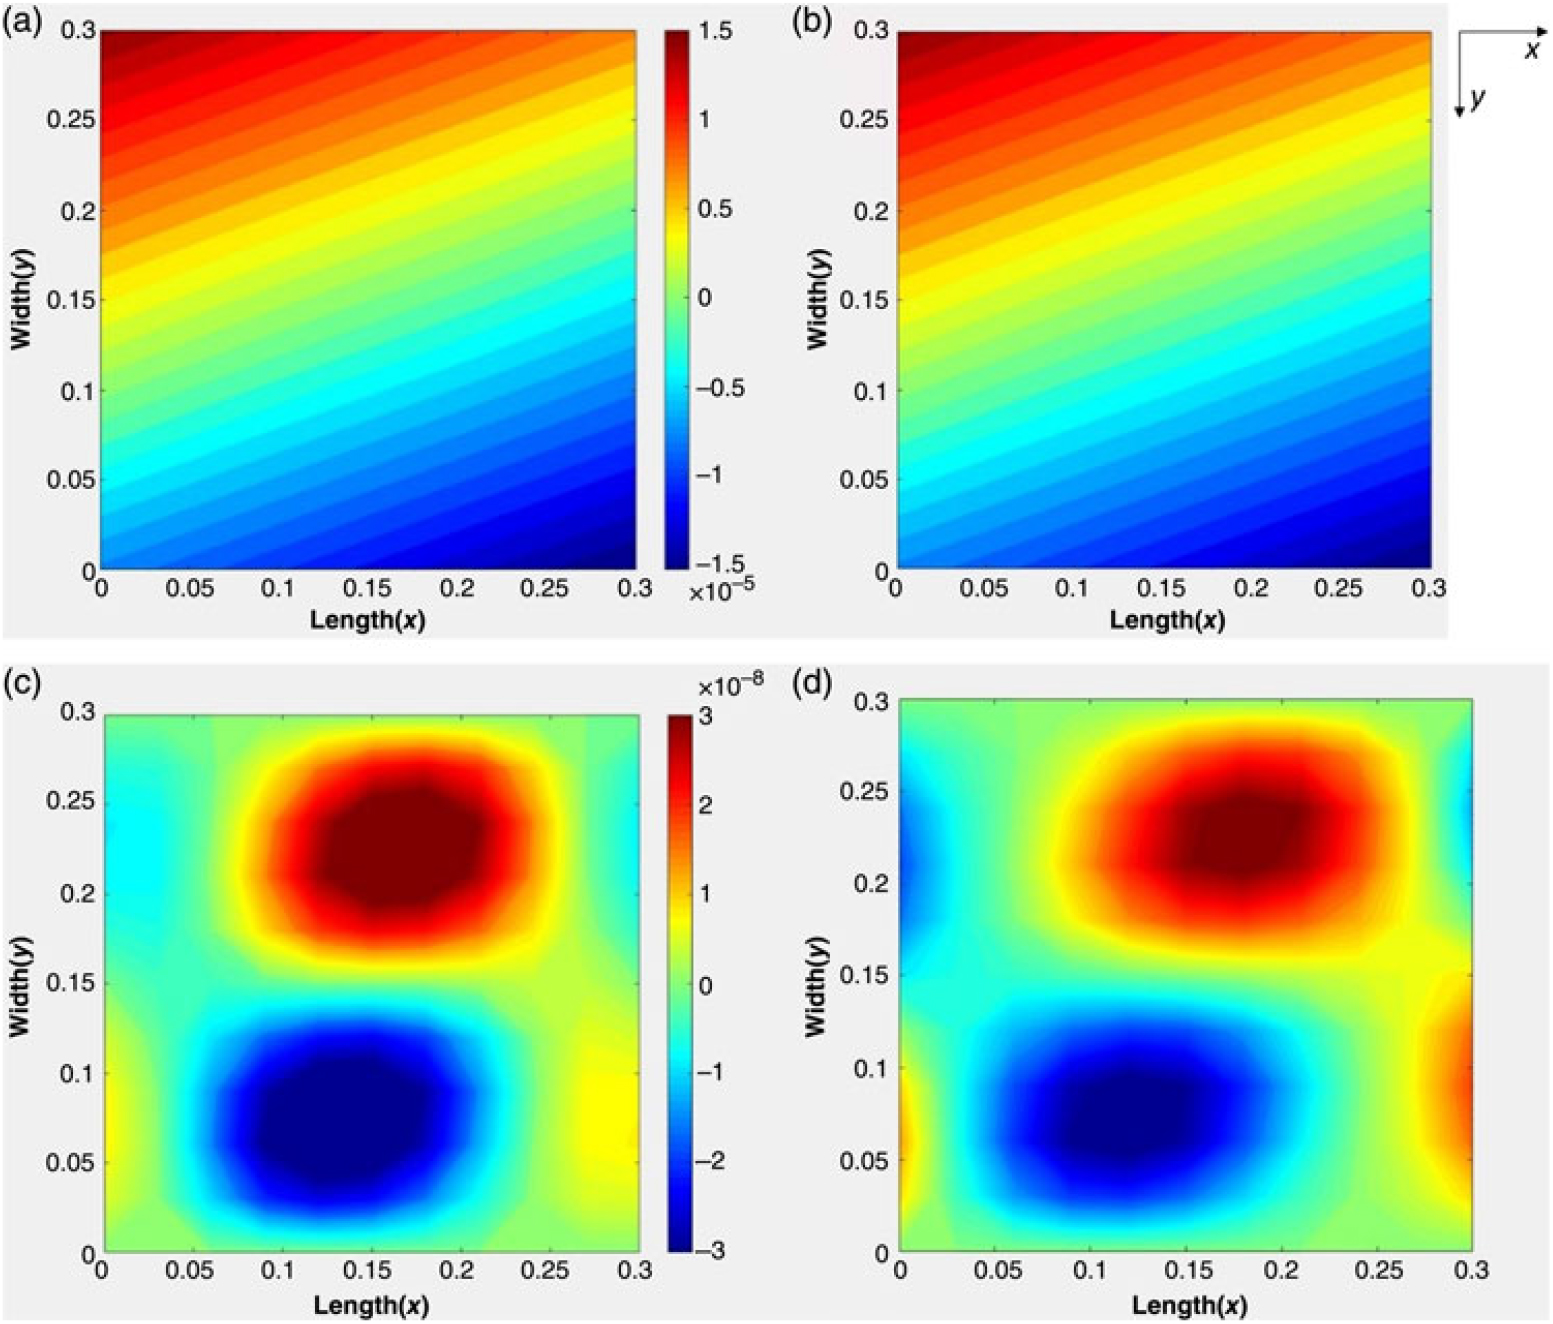
Figures 11 and 12 show the variation of stress resultants N x, N y and N xy from the present analysis and ABAQUS analysis. Figure 13 gives quantitative comparisons of N x along the longitudinal centre line. The biggest error is 13.6% at the two loaded ends. It can be seen that all the stresses are antisymmetric, and from the quantitative comparison the values from present analysis are almost the same as ABAQUS.
Variation of in-plane displacements (a) u displacement (present analysis). (b) u displacement (ABAQUS analysis). (c) v displacement (present analysis). (d) v displacement (ABAQUS analysis).

Variation of stresses on the top surface of the plate. (a) N x (present analysis). (b) N x (ABAQUS analysis). (c) N y (present analysis). (d) N y (ABAQUS analysis). (e) N xy (present analysis). (f) N xy (ABAQUS analysis).

Stress resultant N x on top surface of the plate.

It is noted that the sinusoidal assumption of the previous VIPASA postbuckling analysis precluded the possibility of mode jumping. The use of a series of half-wavelengths in the present VICON analysis will allow for gradual or discrete changes in the postbuckling mode as the load is increased.
7.0 CONCLUSIONS AND FUTURE WORK
Postbuckling analysis has been presented for anisotropic and shear loaded plates. The analysis is based on exact strip analysis, in which the mode shapes are assumed to be the sum of sinusoidal responses with different half-wavelengths which are coupled together to satisfy the boundary conditions at the longitudinal ends. Initial postbuckling results for two example problems show very good agreement with finite element analysis. The greatest error is only 3.2% in first example and 13.6% in the second example. It also can be seen there is a big improvement compared with a previous exact strip postbuckling analysis in which the mode shapes were assumed to be purely sinusoidal.
The two models all utilized the three different half-wavelengths for the w displacement obtained from VICON. Therefore some accuracy is sacrificed. However more half-wavelengths can also be used, but at the expense of increased computational time. The analysis currently only covers the first cycle of postbuckling, for which it achieves a good outcome. A full postbuckling analysis will be permitted by extending the Newton iteration scheme in the exact strip software VICONOPT. The analysis will also be further extended to cover stiffened panels, in order to provide more capabilities for preliminary aircraft design.