Racism and sexism were defining features of the 2016 US presidential election, which was part of a wider global trend in which authoritarian-populist parties and politicians have enjoyed electoral success (Norris and Inglehart Reference Norris and Inglehart2019). But was the role of racism and sexism limited to Donald Trump's unique appeal, or has his victory meant that vote choices in subsequent elections are becoming increasingly divided along these identity-based lines? As I show in this letter, both ‘denial of racism’ and ‘hostile sexism’ were unusually important in predicting support for Trump, but less central in down-ballot races featuring other Republican candidates in 2016. But midterm elections typically serve as a referendum on the sitting president, and in this case that president put issues related to the treatment of minorities and women front and center.
In this letter, I use the Cooperative Congressional Election Study's (CCES) competitive districts survey to examine whether hostile sexism and denial of racism were stronger predictors of vote choice in 2018 than they were for House races in 2016. The findings indicate that racism and sexism became even more prominent dividing lines between the two major parties in 2018, and that this happened mostly because less sexist and racist Republican voters switched to supporting Democrats. Additionally, a mediation analysis provides suggestive evidence that this pattern was related to Trump's position as president and head of the Republican Party. Ultimately, the evidence from the American case provides insight into how electoral politics may evolve in other countries that have also witnessed divisive rhetoric from prominent politicians and parties. My findings imply that even when this strategy succeeds in a single election, it may ultimately drive away at least as many voters as it attracts in subsequent electoral cycles.
Trump and the Activation of Racism and Sexism in 2018 House Races
In 2016, Americans' votes for president were more strongly related to their racial attitudes and attitudes towards women than they had been in previous election cycles (Cassese and Barnes Reference Cassese and Barnes2018; Schaffner, MacWilliams and Nteta Reference Schaffner, MacWilliams and Nteta2018; Setzler and Yanus Reference Setzler and Yanus2018; Sides, Tesler and Vavreck Reference Sides, Tesler and Vavreck2018; Valentino, Wayne and Oceno Reference Valentino, Wayne and Oceno2018). Much of the explanation for the heightened role of these identity-related attitudes focuses on the fact that the rhetoric of the campaign centered more explicitly on racial and gender equality than in previous cycles (Schaffner, MacWilliams and Nteta Reference Schaffner, MacWilliams and Nteta2018; Sides, Tesler and Vavreck Reference Sides, Tesler and Vavreck2018).
As I show below, however, the role of racism and sexism in 2016 was less pronounced when it came to how people voted in US House elections. To the extent that identity-based concerns were activated for the presidential election, the effect was weaker for down-ballot races. Yet, Trump's election to the presidency may have since altered the Republican Party's image on these dimensions. Indeed, while voters might have reasonably separated candidate Trump from other Republicans running for office in 2016, his election as president made him the clear head of the party. This is significant because, as Jacobson (Reference Jacobson2012) shows, the public's evaluations of a president can have a lasting influence on how they view that president's party. Thus Trump's reputation for expressing hostility towards women and minorities might have become more strongly attributed to the Republican Party after two years of his presidency.
Given that (1) perceptions of presidents can affect a party's long-term image and (2) mid-term elections are often a referendum on the sitting president (Jacobson Reference Jacobson2004), I expect to find that attitudes tapping racism and sexism were more strongly related to vote choices for House races in 2018 than they had been in 2016.
Design
One straightforward approach to comparing how well racial attitudes and sexism predict vote choice across election cycles would be to estimate models in each election year using cross-sectional survey data from each cycle. However, there are two main drawbacks to using such an analysis. First, since voters come in and out of the electorate it is challenging to use such a comparison to determine whether these factors were more important predictors in determining vote choices or whether it just appears that way because identity-oriented voters became a larger share of the electorate. Secondly, such an approach might also produce biased estimates if responses to questions about racial attitudes or sexism shift over time among partisans. For example, in recent decades white Democrats have registered increasingly lower levels of racial resentment and prejudice (Engelhardt Reference EngelhardtForthcoming; Hopkins and Washington Reference Hopkins and WashingtonForthcoming). Thus, comparing cross-sectional results over time may produce a stronger association not because racial attitudes became a stronger predictor of the vote, but because Democratic voters bring their racial attitudes more in line with their partisan preferences over time.
Accordingly, I rely on a single survey fielded during the 2018 midterm election. The survey asks respondents who they voted for in the 2016 presidential and House elections (during the pre-election wave of the survey) and then who they voted for in 2018 (during the post-election wave). Rivers and Lauderdale (Reference Rivers and Lauderdale2016) find that even 4 years later, 95 per cent of voters accurately recall who they voted for in the past presidential election. In Appendix Section 2, I use data from the CCES panel study to show that in 2014, respondents recalled their 2010 House vote with 92 per cent accuracy and with no clear bias among those who did not recall correctly. I also find that relying on recalled vote choice does not lead to significantly different inferences about the role of racial resentment in the 2010 House vote. Given the lack of bias with 4-year House vote recall in the CCES panel survey, I expect the 2-year recall used here to be highly accurate and unbiased as well.
A key advantage of this approach is the ability to examine vote choices among the exact same set of respondents with their traits fixed at a single point in time. Analyzing the same group of individuals increases the confidence that any differences we detect in the strength of the associations between the identity items and vote choice will be because they became more important predictors in 2018.
Data
To compare the influence of racial and gender attitudes on the House vote in 2018 and 2016, I use the 2018 CCES competitive districts survey (Ansolabehere, Schaffner and Luks Reference Ansolabehere, Schaffner and Luks2019). The survey is a supplemental study to the 2018 CCES focusing specifically on US House elections. The survey includes an oversample of 13,000 adults in fifty-two congressional districts that were rated as ‘competitive’ with the remaining 4,000 interviews spread across the 383 safe Democratic and Republican districts. For the analysis presented here, I use weights that are designed to adjust for the oversampling of competitive districts, which makes the sample nationally representative. However, in the Appendix I show that the results are consistent when the analysis is limited to voters living in competitive districts.
The competitive districts survey is particularly useful for this study because respondents were asked during the pre-election wave to report who they voted for in the 2016 House election. They were then asked in the post-election wave who they voted for in the 2018 House election. In both cases, the CCES does not use a generic ballot question, but rather provides respondents with the name and party affiliation of candidates who ran in the respondent's district in 2016 and 2018 (see the Appendix for question wording).
While the total sample size for the competitive districts survey was 17,000, the effective sample size for the analysis is limited in three main ways. First, the competitive districts survey (like the standard CCES), includes vote validation variables, which indicate whether an actual record of turnout was located for each respondent. Here, I only analyze respondents who were validated voters in 2018 (about 56 per cent of all respondents). Secondly, my investigation is limited to respondents who answered both the pre- and post-election waves of the survey (about 81 per cent of all respondents took the post-election wave of the survey). Finally, I excluded respondents who voted in a House race that did not include candidates from both major parties in either 2016 or 2018. Ultimately, these conditions reduced the effective size for the analysis to 6,076 respondents. The dependent variable for all of the analyses reported below is the respondent's two-party vote choice. I code these responses so that 1 indicates a vote for the Republican House candidate and 0 is a vote for the Democrat.
The key independent variables for these analyses are hostile sexism and denial of racism, two factors that were identified as especially important predictors of the 2016 presidential vote and which were included on the 2018 CCES (Schaffner, MacWilliams and Nteta Reference Schaffner, MacWilliams and Nteta2018). The patterns reported here are similar if racial resentment is used in place of denial of racism (see Appendix Section 8.3). The hostile sexism battery is part of the Ambivalent Sexism Inventory, which has been widely used in social psychological research for over two decades (Glick and Fiske Reference Glick and Fiske1996). The full original hostile sexism battery includes eleven items, but the 2018 competitive districts survey includes just two of these:
• When women lose to men in a fair competition, they typically complain about being discriminated against.
• Feminists are making entirely reasonable demands of men.
Responses were given on a five-point scale ranging from ‘disagree strongly’ (1) to ‘agree strongly’ (5), with strong agreement indicating higher levels of hostile sexism for the first item, but lower levels of sexism on the second item. I scale the two items using an Item Response Theory graded response model. This creates a normalized variable that I then re-scale to range from 0 to 1.
Denial of racism is also included in the analysis to capture racial attitudes that relate to contemporary conflicts over increasing racial diversity and white identity (DeSante and Smith Reference DeSante and Smith2020). The two items tapping this dimension of racial attitudes were:
• White people in the US have certain advantages because of the color of their skin.
• Racial problems in the US are rare, isolated situations.
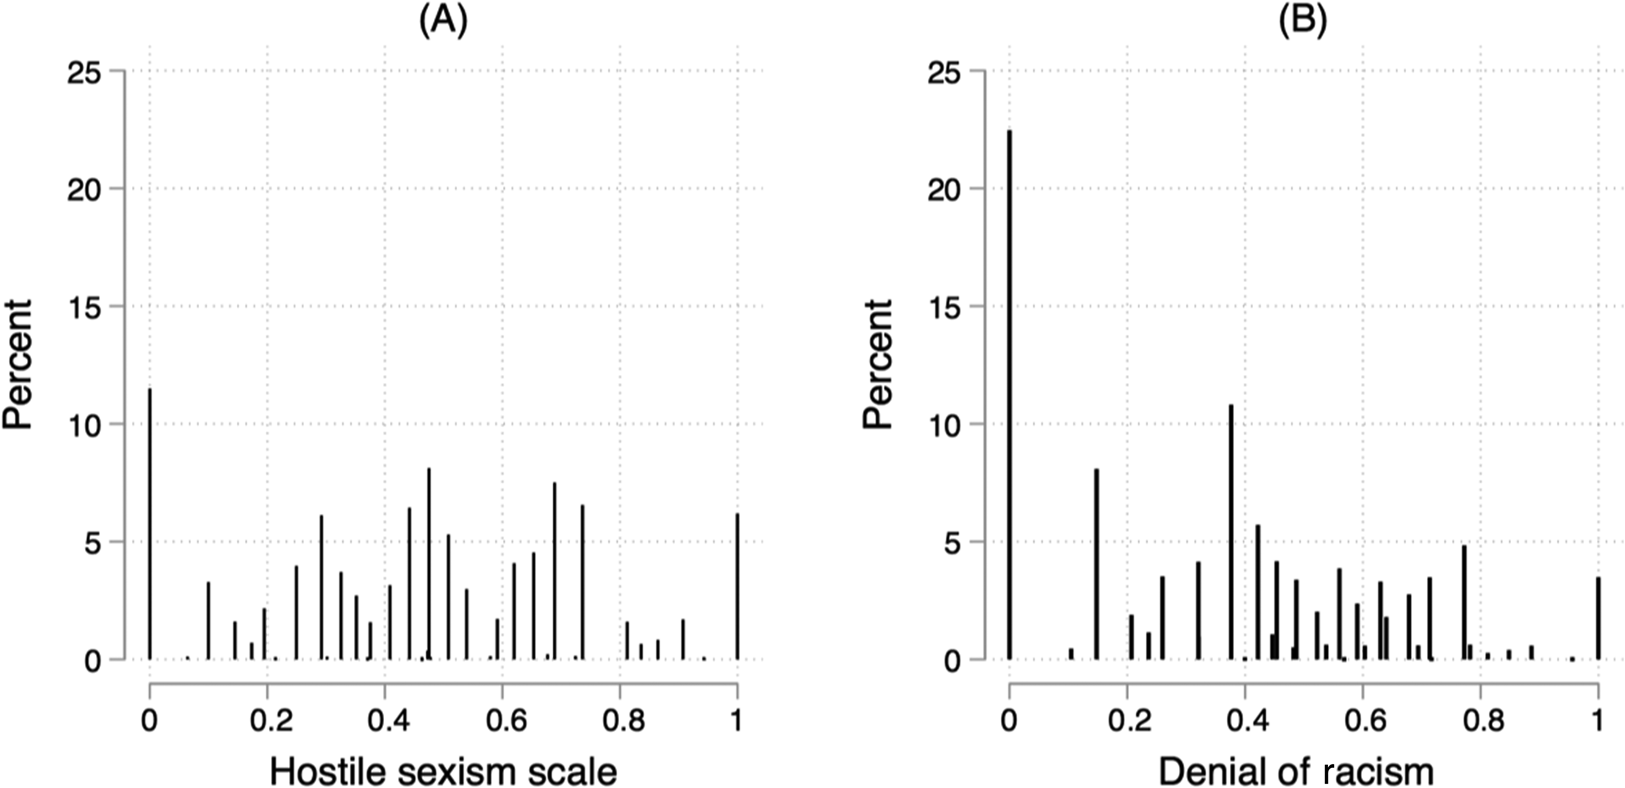
Like the sexism items, I scaled these using a graded response model so that they form a single dimension ranging from 0 to 1 (with 1 indicating the highest level of denial of racism). Figure 1 shows how each of these key items is distributed within the sample.
Distribution of Hostile Sexism and Denial of Racism Scales
Note: N = 9,791 registered voters from the 2018 CCES Competitive Districts Survey.

I also include a number of additional variables that may be simultaneously correlated with an individual's level of sexism or racism denial and might be expected to affect their vote choice. Each model includes controls for standard demographic variables including church attendance, gender, age, income, education and race. I also include controls for an individual's self-identification on a five-point ideological scale (ranging from strong liberal to strong conservative) and a seven-point partisanship scale (ranging from strong Democrat to strong Republican). Finally, I include a measure of the respondent's reported change in household income during the past year.
I use a bivariate probit model to simultaneously estimate the predictors of vote choice in both elections. This model accounts for the fact that the two outcomes (vote choices) will be correlated, even after accounting for the predictors in the model.
Results
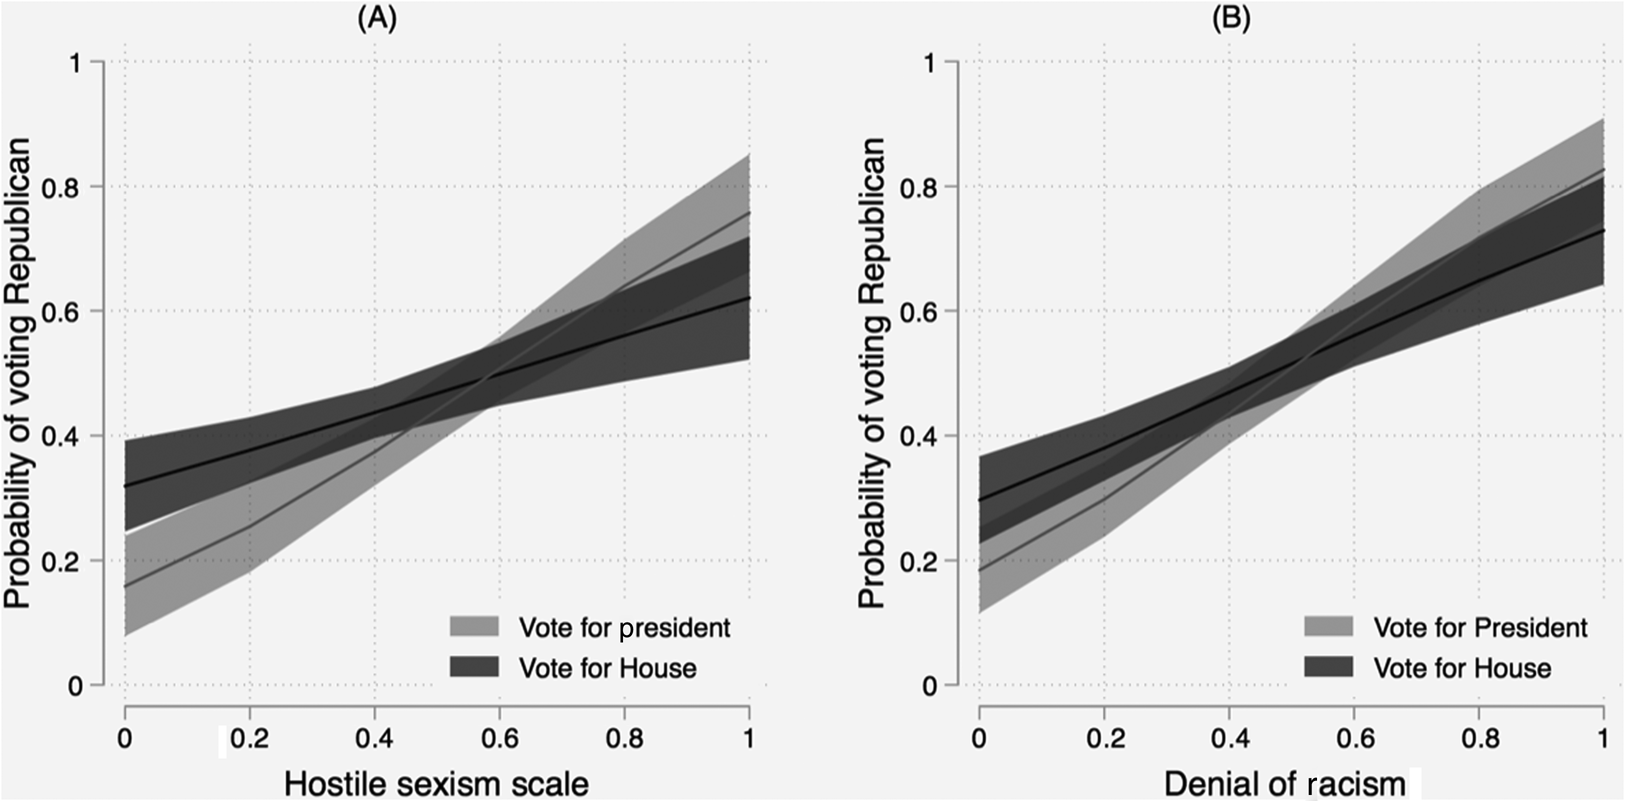
Before examining how 2018 House vote choices compared to those made by the same group in 2016, I begin by showing how denial of racism and hostile sexism predicted voting for both the House and the president in 2016. Figure 2 shows the predicted probability of voting for Trump and the predicted probability of voting for a Republican House candidate in 2016 based on the respondent's level of hostile sexism and denial of racism. The predicted probabilities are generated from a bivariate probit model (holding the control variables at their mean values) and the full results from the model can be found in Appendix Section 4. As the plots show, there was a stronger relationship between both sexism and denial of racism when it came to predicting whether an individual voted for Trump (over Clinton) than for whether a voter chose a Republican House candidate over a Democrat. A test for the difference in coefficients is significant for both hostile sexism (p = 0.005) and denial of racism (p = 0.027). Thus, this analysis confirms that these identity-based items were more important in the 2016 presidential race than they were for down-ballot contests.
Racism, sexism, and the vote for president and House in 2016
Note: predicted probability of voting for Trump and a Republican House candidate in 2016 while holding all other variables at their mean values. Plots produced from a bivariate probit model presented in the Appendix. Shaded areas represent 95 per cent confidence intervals.

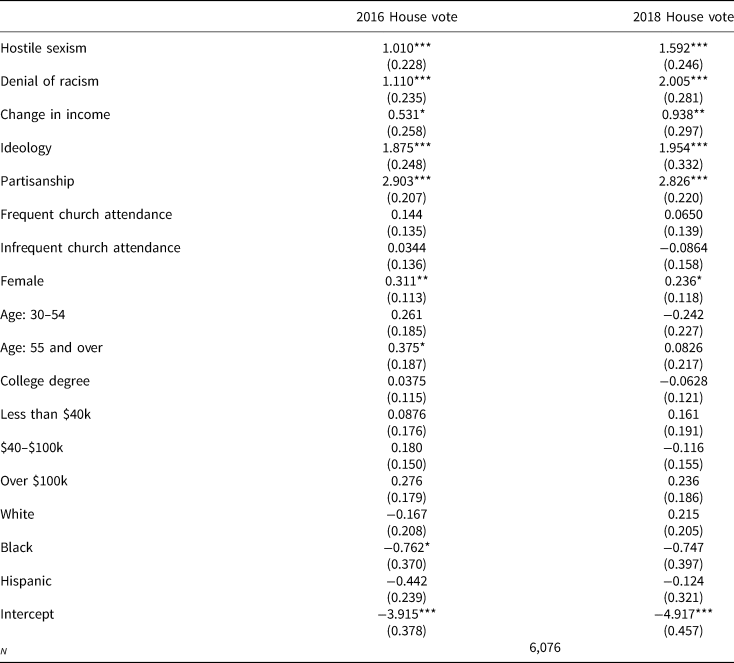
Having established that hostile sexism and denial of racism were more strongly associated with presidential vote choices in 2016 than they were for the House vote, I now turn to comparing the 2018 House vote patterns with those from 2016. Table 1 shows the coefficients from the bivariate probit model. The covariates are each measured in 2018 and are, therefore, fixed. Thus, differences in any coefficients across the two models indicate that the variable is more strongly (or weakly) associated with the House vote in one election compared to another.
Bivariate probit model estimating predictors of 2016 and 2018 House vote

Note: standard errors in parentheses. *p < 0.05, **p < 0.01, ***p < 0.001
I conducted difference-of-coefficients tests across the two models for each variable, and in only two cases were the differences statistically significant: the coefficients for hostile sexism and denial of racism were both significantly larger for the 2018 model (p = 0.024 and p = 0.002, respectively). In fact, the coefficient for hostile sexism increased in magnitude by more than 50 per cent while the 2018 denial of racism coefficient is nearly twice as large as that for 2016. Notably, for other political measures, such as ideology and partisanship, the coefficients are quite similar in magnitude.
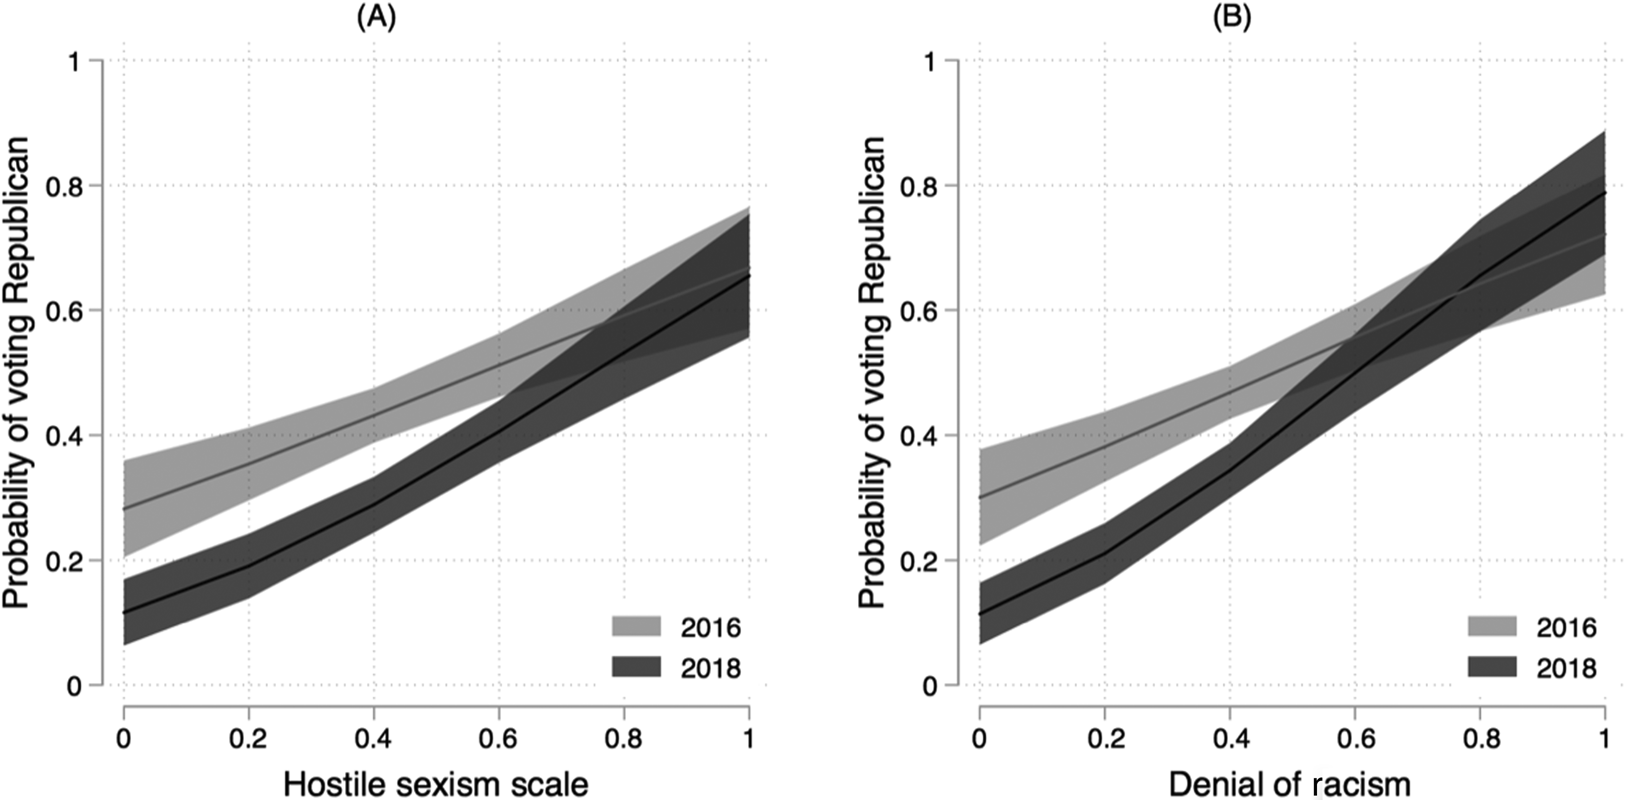
Figure 3 uses the bivariate probit model to plot the predicted probability that an individual voted Republican in 2016 and 2018 based on their levels of hostile sexism and racism denial, while holding the other variables in the model at their mean values. The figures both show a similar pattern. For example, Panel A shows that there is a positive relationship between a voter's level of hostile sexism and their probability of voting for the Republican House candidate in 2016. However, the darker shaded line shows that this relationship is even steeper in 2018. Furthermore, the increasing importance of sexism in 2018 appeared to be to the detriment of Republican candidates. Among those with the highest levels of sexism, the predicted probability of voting Republican was similar (and not statistically distinguishable). However, among those with lower levels of sexism, support for Republican candidates was about 15 points lower in 2018 than it was in 2016.
Racism, sexism and the vote for Republican House candidates, 2016 and 2018
Note: predicted probability of voting for a Republican House candidate in 2016 and 2018 while holding all other variables at their mean values. Plots produced from the bivariate probit model presented in Table 1. Shaded areas represent 95 per cent confidence intervals.

A similar pattern is evident in Panel B, which displays a stronger relationship between denial of racism and voting for Republicans in 2018. This mostly appears to come from those at the lower end of the scale being more likely to support Democrats in 2018 than they had been in 2016.
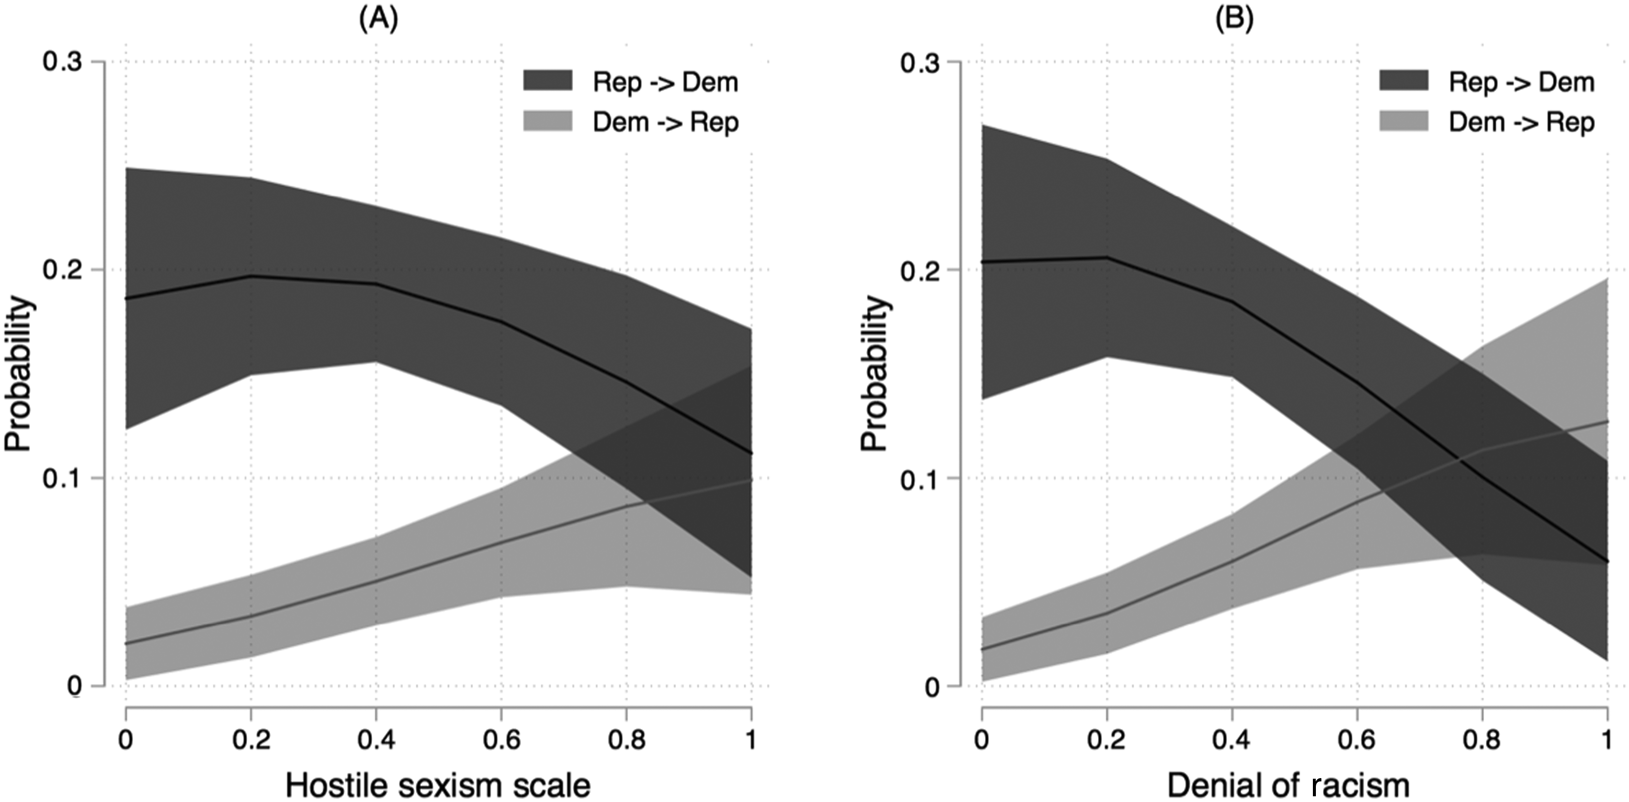
Another way of examining how hostile sexism and denial of racism were more important in 2018 than in 2016 is to use the model to assess how these variables are associated with vote switching between elections. Figure 4 shows these relationships. Each panel plots the predicted probability that a voter supported a Republican in 2016 but then a Democrat in 2018, as well as the predicted probability that a voter supported a Democrat in 2016 but then a Republican in 2018. Panel A shows that among voters who express lower levels of sexism, there is a much higher probability of having switched from away from voting Republican in 2018 than there was for shifting towards voting Republican. By comparison, among those who score highest on the hostile sexism scale, there is an approximately equal probability of shifting towards or away from the Republican Party.
Racism, sexism and vote switching between 2016 and 2018
Note: predicted probability of a respondent switching their support from 2016 to 2018 while holding all other variables at their mean values. Plots produced from the bivariate probit model presented in Table 1. Shaded areas represent 95 per cent confidence intervals.

Panel B shows a similar (but slightly stronger) pattern. People registering the lowest levels of denial of racism had about a 0.2 predicted probability of shifting from a Republican House vote in 2016 to a Democratic vote in 2018. By contrast, the probability of being a Republican-to-Democratic voter dropped to just 0.06 among those with the highest levels of racism denial. By contrast, people with low levels of racism denial were very unlikely to have voted Democratic in 2016 and Republican in 2018 (predicted probability of 0.02), but among those with the highest levels of racism denial, the predicted probability of being a Democratic-to-Republican voter increased to 0.13.
To get a sense of the significance of this vote shifting for the overall House vote margin, Table 2 shows a simple accounting of the amount of shifting among four different groups – those with low levels of sexism and racism (below the mean on both scales), those with low levels on one scale but not the other, and those with above-average values on both scales. Among the 36 per cent of voters with below-average values of sexism and racism, 4.4 per cent shifted from voting Republican in 2016 to Democratic in 2018. Only 0.5 per cent of this group shifted in the other direction. Thus given the size of the group, voters with low levels of sexism and racism accounted for an additional 2.8 points on the Democrats’ margin in 2018. Democrats also picked up significant support among voters with below-average sexism but above-average denial of racism. Altogether, voters who were below average on either or both the hostile sexism and denial of racism scales helped account for a 5-point shift in the Democratic direction for the House vote margin. By contrast, there was no net shift among voters with above-average levels of sexism and denial of racism.
Vote patterns by sexism and racism and effect on overall House vote margin

Note: values of low or high sexism/racism are defined by voters being below or above the mean on the hostile sexism scale and the denial of racism scale.
Overall, Figure 4 provides evidence of clear patterns of sorting, where less sexist and racist Republicans voted more Democratic in 2018, while more sexist and racist Democrats voted more Republican. And Table 2 shows that the net effect of these attitudes was that Republicans lost more support among less sexist/racist voters while failing to make gains among those with more sexist/racist attitudes.
The Role of Trump
To what extent was the role of sexism and racial attitudes attributable to Trump's effect on the Republican Party's brand? While observational data do not allow for a definitive test of the causal effect of Trump, I conducted a mediation analysis, which is described in Appendix Section 6. This analysis suggests that about one-third of the total effect of both hostile sexism and denial of racism on the House vote in 2018 operated indirectly through voters' opinions of Donald Trump. This would account for most of the increase in the coefficients for hostile sexism and denial of racism from 2016 to 2018 (as documented in Table 1), providing suggestive evidence of the importance of Trump's role in shaping the Republican Party's brand.
The Role of Candidate Traits
I also tested whether denial of racism and hostile sexism were stronger predictors of vote choice in races featuring women and/or minority candidates. Overall, there is limited evidence of such conditional effects – only one of twelve interaction terms was statistically significant. The full analysis can be found in Appendix Section 7.
Conclusion
So far, the scholarly consensus is that racial attitudes and sexism were more strongly predictive of the 2016 presidential vote than they had been of the presidential vote in 2012. This letter documents a continuation of this trend, at least as much as it applies to House elections. Attitudes toward minorities and women were already a significant predictor of the House vote in 2016, but they became even more so in 2018. Regarding the relationship between these attitudes and vote choice, the 2018 House vote looked much more like the 2016 presidential vote than the 2016 House vote. Once Trump became president and, therefore, the clear leader of the Republican Party, it is natural that this penchant for making explicit and controversial statements about minorities and women would become more ingrained into the broader partisan divide that structures how people vote in other elections.
Notably, this identity-based divide appears to have cost Republicans more votes than it gained them in 2018. This can be most clearly seen in the analysis of vote switching, which showed that lower levels of racism denial and sexism were strongly related to switching from voting Republican to Democratic in 2018, whereas Republicans did not see a net gain in votes among those with above-average levels of racism and sexism. While it is not yet clear whether the 2018 US election is indicative of a broader trend, it should serve as a warning to Republicans that they must soften their increasingly hardening image on issues related to racial and gender equality or face the prospect of being penalized in future elections. And in a moment when authoritarian-populist political movements have gained traction across the globe by making xenophobic appeals (Norris and Inglehart Reference Norris and Inglehart2019), it is encouraging to find that there may be a long-term cost to such strategies.
Supplementary material
Data replication sets are available in Harvard Dataverse at: https://doi.org/10.7910/DVN/BVNZC8 and online appendices at: https://doi.org/10.1017/S0007123420000319.
Acknowledgements
I thank Sam Luks for her work on the CCES survey and for her collaboration on related projects. I thank the Center for American Women in Politics for providing data on the sex of candidates in 2016 and 2018. I thank David Barney for providing data on candidate race in 2016 and Jeff Gulati for providing data on candidate race in 2018. Support for this research was provided by the National Science Foundation (Award no. 1756447).