Introduction
The Internet has altered the lives of individuals across the globe and political campaigns in the US have not been spared from this revolutionizing force. According to Pew, by 2008, 55% of the US adult population already turned to the Internet for political information (Smith Reference Smith2009). A year later, Druckman, Kifer, and Parkin (Reference Druckman, Kifer and Parkin2009, 343) declared campaign websites essential arguing that they “provide an unmediated, holistic, and representative portrait of campaigns”. Modern campaign websites have expanded to increase donor access, facilitate interaction with candidates, and foster personalized constituent experiences (Bimber Reference Bimber2014; Gibson, Ward, and Lusoli Reference Gibson, Ward and Lusoli2002; Smith and Duggan Reference Smith and Duggan2012). While this revolution spawned significant early research, recent efforts have shifted to concerns over the role of social media platforms, taking websites as perfunctory requirement for a campaign.
While the early literature on digital campaigning saw the use of websites as a forgone conclusion, nationalized, partisan polarization has thrown this assumption into question. The polarization of the national parties has resulted in more centralized control of party messaging alongside a nationalizing citizenry, and an increasing divide between opposing partisans (Abramowitz and Webster Reference Abramowitz and Webster2016; Cox and McCubbins Reference Cox and McCubbins2005; Hopkins Reference Hopkins2018). This increase in partisan polarization has left some candidates facing more ideologically homogenized constituencies. Candidates running in ideologically adversarial or moderate districts need to simultaneously appeal to both highly partisan primary constituents and moderate or adversarial general election constituencies. Under these polarized conditions, are candidates willing to employ substantial personalized campaign websites at the risk of alienating polarized voters, or are websites merely another tool to preach to the partisan choir in safe districts?
To better understand the interaction between polarization and state legislative campaign websites, this study introduces a novel data set that identifies the presence of campaign websites for all general election, and state legislative campaigns during the 2018 and 2020 campaigns. I argue that the growth of national partisan polarization has encouraged state legislative candidates to forgo websites in favor of the anonymity of partisan heuristics, especially in districts that leave them divided between polarized constituencies and general election appeals. Across the nation, approximately one-third of state legislative candidates do not establish a clearly identifiable website with significant variation across the candidates. To assess the drivers of individual variation, I model website presence against constituent demographics, resources, partisan contestation, and district-level citizen ideology. Competition and constituent preferences, rooted in age, income, race, and education, all contribute to higher likelihoods of website use. However, the more striking effect was the impact of constituent polarization on website presence. While candidates from both parties are more likely to employ websites in more homogenous districts, only Republicans are particularly averse to website use in ideologically opposing districts.
The effects present a pessimistic picture regarding the influence of polarization on campaign website use in the states. First, the low use of campaign websites provides a strong indication that candidates are willing to forgo individualized campaign content. In addition, the data reveals that candidates are averse to the risks associated with proselytizing within diverse districts and for Republicans in opposing districts. Candidates instead favor the safety of preaching to the partisan choir in safe districts. When candidates opt for anonymity or micro-targeting in situations of potential conflict within their districts, it reduces citizen exposure to potential policy distinctions between state-level candidates and the national political parties. Combined with the decline in local news coverage, this can present a serious challenge for local information to shift perceptions of nationalized partisan agendas, furthering citizen polarization (Moskowitz Reference Moskowitz2021). A careful analysis of these competing effects is necessary in order to reinvigorate the potential for digital campaign content to advance norms of democratic citizenship by diminishing polarization and nationalization of state political agendas.
Websites as reward and risk
The Internet revolution renewed hope in democratic norms by facilitating increased information and communication. In terms of engagement, the Internet has a mixed record for facilitating the mobilization of non-traditional groups or encouraging participation beyond donations (Bimber Reference Bimber1998; Reference Bimber2001; Bimber and Copeland Reference Bimber and Copeland2013). However, scholars have viewed websites as a key tool for campaigns, fostering the growth of consultants dedicated to facilitating digital content (Benoit and Benoit Reference Benoit and Benoit2005; Johnson Reference Johnson2002; McKelvey and Piebiak Reference McKelvey and Piebiak2018). Candidates and parties establish clear web presences to communicate campaign information, target critical donor communities, and enhance participation for core constituent groups (Bimber and Davis Reference Bimber and Davis2003; Druckman et al. Reference Druckman, Kifer and Parkin2009; Druckman, Kifer, and Parkin Reference Druckman, Kifer and Parkin2010; Reference Druckman, Kifer and Parkin2018; Gaynor and Gimpel Reference Gaynor and Gimpel2021; Gibson et al. Reference Gibson, Ward and Lusoli2002). Studies have shown that access to these online campaign portals corresponds to the increased likelihood of voting (Tolbert and McNeal Reference Tolbert and McNeal2003). As early as 2002, scholars highlighted how parties around the world had established a web presence and by 2008 scholars examining the US declared that “most if not all political campaigns will develop and maintain a presence on the Internet” (Gibson et al. Reference Gibson, Ward and Lusoli2002; Latimer Reference Latimer2009, 1036). Subsequent studies of congressional websites have found them to be consistent in spite of significant technological shifts (Druckman et al. Reference Druckman, Kifer and Parkin2018; Druckman, Kifer, and Parkin Reference Druckman, Kifer and Parkin2014). The growth of digital resources effectively facilitated the expansion of low-cost, substantial campaign content, with most scholars taking website use as a perfunctory component of a viable campaign.
However, little work has been done on evaluating the role of polarization and nationalization in shaping personalized campaign content through websites. Candidates, especially incumbents, have historically been averse to taking strong policy stances during campaigns that could prove unpopular in future elections (Arnold Reference Arnold1990; Druckman et al. Reference Druckman, Kifer and Parkin2009). While this aversion to concrete statements is a unique feature in individualized American politics, the centralization of party power under national polarization heightens this risk. The ideological polarization of America’s national parties has corresponded to a more direct and centralized control of partisan agendas and messaging from congressional leadership (Cox and McCubbins Reference Cox and McCubbins2005; Lee Reference Lee2016; Sinclair Reference Sinclair2011; Reference Sinclair2014). This has resulted in increased ideological distance between the two major parties and increased internal homogeneity within each party (Hare and Poole Reference Hare and Poole2014; Poole and Rosenthal Reference Poole and Rosenthal2011). The nationalization of partisan agendas has trickled down into constituencies across the nation, with an increased focus on national issues at the expense of local issues and a growing animosity for the opposition party (Abramowitz and Webster Reference Abramowitz and Webster2016; Hopkins Reference Hopkins2018). The resulting heightened risk of significant opposition might discourage candidates from running individualized digital campaigns due to the risk of alienating such strongly opposed partisan camps.
This risk is especially pronounced for candidates in state legislative races due to the lack of local control of partisan agendas. The twenty-first century has seen an increase in the influence of national partisan trends in state elections, with presidential elections dominating state races (Rogers Reference Rogers2016). At the same time, a significant decline in local news and the effective growth of intermittent “flashlight” coverage for local politics has reduced the potential for accountability in state politics (Abernathy Reference Abernathy2020; Conerly Reference Conerly2013; Graber Reference Graber1989; Moskowitz Reference Moskowitz2021). The nationalization of media sources within American politics has shifted the concerns and opinions of citizens, resulting in an almost exclusive focus on national partisan agendas (Hopkins Reference Hopkins2018). Modern voters reflect these shifts and are less interested in robust local campaign information but instead prefer some middle ground between concrete policy and simple partisan heuristics (Lipsitz et al. Reference Lipsitz, Trost, Grossmann and Sides2005). Nationalizing citizen preferences corresponding to national control of partisan agendas, combined with the lack of local news, should discourage website use within state elections. In addition, recent studies have found that state legislative candidates are more likely to engage in digital advertising on Facebook, allowing them to engage in more partisan and directly targeted advertising and avoid concrete policy stances (Fowler et al. Reference Fowler, Franz, Martin, Peskowitz and Ridout2021). The result is that state-level candidates should neglect personal campaign websites to avoid individual campaign content, relying instead on partisan cues or targeted advertising.
However, candidates may feel compelled to adopt websites in spite of this competing interest. Early website adoption by congressional candidates in the late 1990s was frequently correlated with incumbency status, resources, and the presence of competition (Klotz Reference Klotz1997; Ward and Gibson Reference Ward and Gibson2003). Further, the availability of this new resource created additional social pressure forcing candidates into the digital arena (Gibson et al. Reference Gibson, Ward and Lusoli2002). In a single study targeting state legislative campaigns, Herrnson, Stokes-Brown, and Hindman (Reference Herrnson, Stokes-Brown and Hindman2007) used survey evidence from 1759 campaigns in 1998 and 2000 to conclude that website adoption in the states was rooted in competition, professionalization, and district demographics including race, age, and education. Finally, similar factors have contributed to the adoption of Facebook as an alternative digital medium, with early adoption favoring democrats, and more affluent and educated districts (Williams and “Jeff” Gulati Reference Williams and “Jeff” Gulati2013).
These studies have provided a suite of potential explanations for the expansion of website use, but most focus on the role of early adoption and none engage with the growth of polarization and nationalization in the modern political environment. While website use has been accepted as a forgone conclusion for successful campaigns, the nationalization and centralization of partisan agendas creates a credible incentive for candidates to avoid individualization through websites. This is especially problematic in low salience elections, like state legislative races. This can undermine accountability and enhance citizen reliance on partisan cues as opposed to substantial policy claims, contributing to nationalization and polarization. Fully understanding the competing influences of partisan polarization and the expectations of digital campaigning at the state level requires a thorough assessment of these competing factors.
Constituent pressure, competition, and polarization
The polarization and nationalization of voters may leave state legislative candidates with a strong incentive to avoid individualization through campaign websites. This incentive against campaigning may not be felt equally across the states or districts. Significant variation in levels of partisan polarization within state legislatures provides an indicator that the nationalization of agendas, while common, is not ubiquitous (Shor and McCarty Reference Shor and McCarty2011). Further, using survey data and post-stratification techniques, scholars have identified significant variation in constituent ideology both across states and across state legislative districts (Tausanovitch and Warshaw Reference Tausanovitch and Warshaw2013; Warshaw and Rodden Reference Warshaw and Rodden2012). Candidates should react differently to districts that share their ideology as opposed to districts in which they are running opposed to the dominant ideology. However, understanding the impact of district ideology on websites requires separating two distinct components of polarization: the cohesion within each district and the district’s level of ideological extremism.
From a national standpoint, higher partisan cohesion tends to indicate more centralized control of partisan priorities and clearer partisan agendas. This is no different at the state level, where centralized cohesive parties can discourage candidate deviation. However, candidates that confront highly cohesive constituents run few risks in taking strong stances. With little variation, campaign agendas should be clear and candidates should feel free to preach to the proverbial choir, leading to the Ideological Homogeneity Hypothesis:
Ideological Homogeneity Hypothesis: Higher levels of homogeneity in constituent ideology within a district will correspond to higher levels of website use among candidates.
Alternatively, more extreme partisan ideologies can produce competing effects. Generally, higher levels of ideological extremism indicate significant buy-in into nationalized partisan polarization. Under this scenario, higher levels of ideological extremism within a district could encourage candidates to conceal themselves in the anonymity of a partisan label. However, this effect will likely vary. A district with significant ideological support for a candidate would likely encourage a more active position taking due to the low level of risk associated with the constituent opposition. Alternatively, a candidate confronting an oppositional ideological district is forced to balance the competing demands of partisan and general election constituencies. Risk aversion, in this situation, would lead to the avoidance of strong policy stances on either side, resulting in a decline in website use, leading to the Ideological Extremism Hypothesis:
Ideological Extremism Hypothesis: A greater distance between the district’s and candidate’s ideology, will correspond to lower levels of website use among candidates.
Measuring website use
Identifying the influence of constituent demands, competition, and polarization on website use in state legislative elections requires a systematic assessment of the presence of campaign websites across state legislative districts. Websites were identified for all major party candidates for upper and lower state legislative races during the 2018 and 2020 general elections. Websites were identified using the Google search engine. Search terms included the candidates’ full name, chamber, state, and campaign year. All searches were conducted between six and two weeks prior to the general election date. The first twenty Google results were included in each search and all searches were conducted with history-driven search improvements disabled. In addition, official Facebook pages returned in the Google search were subsequently searched for links to external campaign websites. This search method focused on websites most likely to be identified by constituents, assuming that a well-concealed website is functionally no website.
A number of specific types of websites were excluded from the results. First, official legislative office websites, denoted by a .gov address or with a consistent attribution statement to the legislature, were not included as personalized campaign content. Second, official websites produced explicitly by the state party, identified by a common attribution statement and consistent design, were excluded. Third, partisan donation-specific websites, including ActBlue and WinRed, that include donor portals for multiple candidates were excluded. In all of these instances, candidates lacked exclusive control over website content and are seen as relying on partisan signals as opposed to personalized agendas. Finally, Facebook, Twitter, and other social media sites were excluded. While the current trend in campaigns has been to increase the use of social media to both advertise and engage with constituents, the types of engagement are distinct from a major website. While both accomplish the goal of outreach, including announcing campaign calendars, and fundraising, substantial policy engagement requires the unlimited space associated with a campaign website. The fluidity and space limitations of the Facebook and Twitter platforms lend themselves more to platitudes than policy proposals, though they remain a potentially fruitful avenue of future research (Fowler et al. Reference Fowler, Franz, Martin, Peskowitz and Ridout2021).
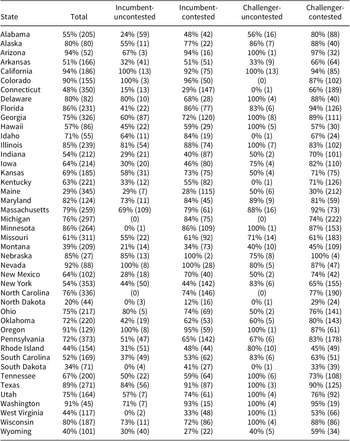
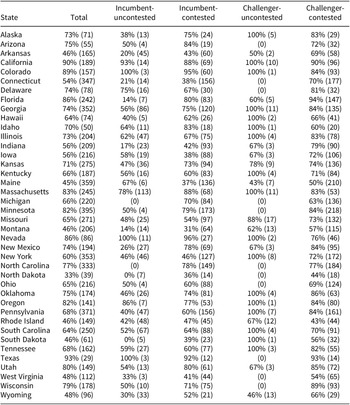
In total, 7,074 candidate websites were identified amongst the 10,483 candidates in 2018 and 6,721 websites were identified amongst the 9,874 candidates in 2020. Across both years, approximately one-third of state legislative candidates opted not to set up an accessible campaign website. These low numbers provide significant evidence on the desire of state legislative candidates to avoid engaging in personalized campaigning that could put them at risk with polarized constituencies. The following analysis will restrict the sample to single-member legislative districts to avoid more complicated interactions with partisanship, web presence, and even shared web space between multiple candidates.Footnote 1 Among single-member districts, websites were not evenly distributed across the nation. Tables 1 and 2 provide the percentage of candidates with websites for 2018 and 2020, respectively, for single-member districts by the state for uncontested incumbents, contested incumbents, uncontested challengers, and contested challengers, and totals. As the table indicates, as competition levels increase both in terms of contested elections and for challengers facing incumbent opposition, the likelihood of website use increases. However, this increase is not consistent across all states, with some states exhibiting significantly higher rates of website use than others.
Percentage of candidates with websites by incumbency and competition, 2018 election

Note. Percentages are calculated based on all single-member districts across both chambers in the state. Category totals are shown in parenthesis. Categories without candidates are denoted by a (0).
Percentage of candidates with websites by incumbency and competition, 2020 election

Note. Percentages are calculated based on all single-member districts across both chambers in the state. Category totals are shown in parenthesis. Categories without candidates are denoted by a (0).
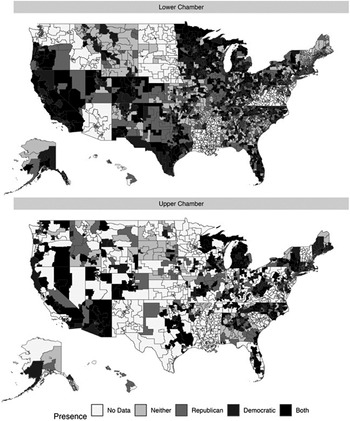
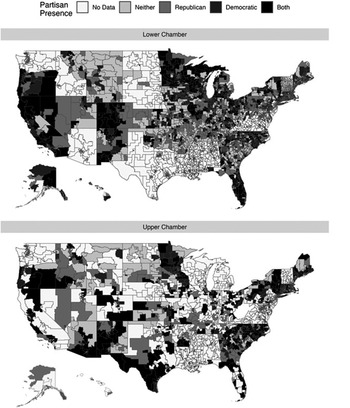
Figures 1 and 2 map the presence of websites across lower and upper chamber state legislative districts by the party for the 2018 and 2020 campaign years. You can find higher-resolution regional breakdowns of these figures in the Supplementary Material. The maps illustrate a few potential trends. First and foremost, more rural populations, especially in the South and Midwest, appear less likely to have a strong website presence from either party, as indicated by the blocks of gray. This could be a combination of uncontested elections, a decline in constituent expectations regarding web presence, or simply reduced availability of Internet access among constituents. Secondly, there is a complex interaction between competition and professionalization, with states like Florida, California, Wisconsin, Minnesota, and even Colorado showing a strong web presence over the last few years. While the maps provide an interesting cursory glance, they underscore the complexity of determining which factors motivate campaign websites use.
Distribution of Website Use by Party for 2018.
Figure 1 plots the map of state legislative, single-member districts, for 2018 races. Shading indicate the presence of websites by, partisanship. Missing data, including districts with no race that year are shown in white. Alaska and Hawaii are shown not to scale to visualize the districts. Regional maps with clearer district lines can be found in the Supplementary Material.

Distribution of Website Use across Party for 2020.
Figure 2 plots the map of state legislative, single-member districts, for 2020 races. Shading indicates the presence of websites by, partisanship. Missing data, including districts with no race that year are shown in white. Alaska and Hawaii are shown not to scale to visualize the districts. Regional maps with clearer district lines can be found in the Supplementary Material.

To fully assess competing explanations, I model website presence as a logistic regression where the dependent variable is coded as 1 for the use of a website and 0 for not. Independent variables are designed to test whether polarization has an impact on website use, while controlling for constituent demographics and competitive position. Polarization within the district is measured using Tausanovitch and Warshaw’s Reference Tausanovitch and Warshaw2013 state legislative district ideology estimates, as the most recent estimates using the 2018 and 2020 districts (Tausanovitch and Warshaw Reference Tausanovitch and Warshaw2013). District extremism is measured using their MRP mean estimated ideology within the district. However, to account for the ideological position of candidates, it is calibrated against the candidate’s party. The new measure positions Democratic candidates at the most liberal point and Republican candidates at the most conservative point and then measures the district’s ideological distance from that point. Therefore, a Democratic candidate facing an extremely liberal district will have a score of 0 and a Republican facing an extremely conservative district will have that same score. As the ideology score increases, the Ideological Extremism Hypothesis would dictate that we would be less likely to see a website due to the risks of alienating partisan constituents. District homogeneity in ideology is measured using the standard deviation for their MRP ideology estimates. According to the Ideological Homogeneity Hypothesis, increases in the standard deviation of the district ideology would result in a lower likelihood to have a website due to the risks associated with alienating more diverse constituents.
In addition to district ideology, two binary variables are included to assess the impact of the competitive environment on a candidate’s decision, including an indicator if the candidate is a challenger and an indicator if the candidate faced a contested general election through major party opposition.Footnote 2 In addition, an interaction effect between these two variables is included under the assumption that challengers might approach competitive and non-competitive elections differently.
Finally, controls for district demographic composition include district education level, median income level, median age, and percentage of the population who identify as “white” are all calculated using the Census Bureau’s American Community Survey 2016 five-year estimates (United States Census Bureau 2016). In addition, controls are included for candidate party and small district size, measured as districts with a population smaller than 33,300. While district population has been shown to impact early website use (Herrnson et al. Reference Herrnson, Stokes-Brown and Hindman2007), it actually holds a non-linear relationship with website use in 2018 and 2020. Instead, the data reveals a stepwise shift at around the first quartile of population sizes, capping at 33,300. This is unsurprising given that the marginal impact of websites given larger populations significantly diminishes at a certain point. The model controls for professionalization, operationalized as the state’s most recent Squire Professionalization Index, a measure of the resources available to state legislators relative to the resources available to Congress, and a binary variable for upper chamber races (Squire Reference Squire2017). Missing from these controls is a measure of Internet availability among constituents. The US Census Bureau’s American Community Survey measures Internet access by the household at the county level but does not provide a similar measure at the state legislative district level. Approximately 80% of households nationally have some form of within-home Internet (United States Census Bureau 2016). However, the disparity in mapping between county lines and state legislative districts across states renders inferences from this measure problematic. However, there is a positive and significant correlation between county population and county Internet access rates (r[3218] = 0.43, p < 0.01) rendering population size a significant proxy for Internet access.
Models are run including and excluding relevant interaction terms and include robust standard errors clustered at the state level and separate models are run for the 2018 and 2020 campaigns to allow for variation between presidential and midterm elections across all variables. The model formulation is robust to alternative controls for the effect of states. Alternative models, including a model using state fixed effects and state random effects, are included in the Supplementary Material.
The competing effects of polarization
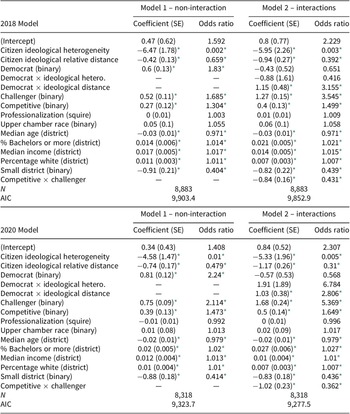
Results for the 2018 and 2020 models are presented in Table 3. The first column for each model shows the coefficient and robust, clustered standard error and the second column lists the odds ratio for each coefficient. Model years are separated and separate models are run within each year, excluding and including key interaction terms.
Logistic regression results for website use

Note. The first set of models for each year excludes interaction terms, while the second column incorporates a series of theoretically important interaction terms. The first column for each model lists logistic regression coefficients with robust standard errors clustered by state in parenthesis. The second column lists converted odds-ratios.
* p < 0.05 two tailed.
The non-interaction baseline models support many of the existing theories of website use with most of the control variables being statistically significant and substantial. In addition, Democratic candidates, challengers, and candidates with major party competition are all more likely to use websites. Finally, the statistically significant coefficients for the measures of district heterogeneity and candidate relative distance lend support for both the Ideological Homogeneity Hypothesis and Ideological Extremism Hypothesis. More ideologically diverse districts and candidates confronting more adversarial districts both corresponded to a reduced likelihood of website use by candidates in those races. However, the statistically significant interaction effects reveal a more complex story across parties and across incumbent-challenger dynamics.
Both interaction models show support for the argument that constituent demographics can have a substantial impact on the likelihood of website use. District median age, education level, median income, and racial composition are significant for both models. A single standard-deviation increase in the percentage of the district population with a bachelor’s degree (14% increase) corresponds to an increase of approximately 6% in the likelihood of having a campaign website in 2018 and 2020, controlling for other variables. With regard to income, a one standard-deviation shift or an increase of $20,000 in median income also corresponded to an increase in the likelihood by approximately 6% in 2018 and 3% in 2020. A one standard-deviation increase in the percentage of the population who identify as “white” (a 20% increase) corresponds to a 3% increase in the likelihood of website use for both models, holding other variables constant. Finally, a 10-year increase in median age corresponded to a decline in the likelihood of having a website by 6% and 5% in 2018 and 2020, respectively.
Lurking behind all of these shifts is the important role of small population sizes as a control variable. Districts under 30,000 citizens are significantly less likely to have campaign websites, with a drop-in the likelihood of having a website by 16% in the midterm election and 14% in presidential election years, even controlling for demographic variables. This is unsurprising as smaller districts may facilitate more personal campaign styles while larger sizes do not provide a significant marginal advantage and are correlated with other more predictive variables. However, there is no strong evidence that significant expectations are produced by the professionalization of the state legislature or the office. Both upper chamber races and measures of state legislative professionalization failed to achieve statistical significance. These results indicate that citizen expectations are a localized phenomenon, rooted in district demographics, and not broader professional standards across the state.
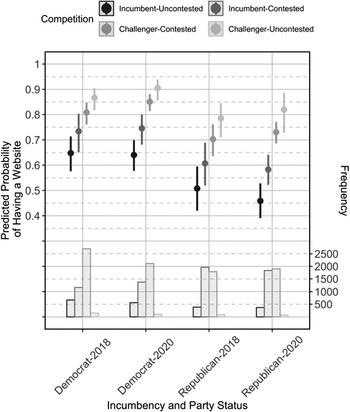
While constituent demographics clearly have a significant impact on the presence or absence of websites, the competitive environment in which a candidate is running has an equally robust impact. The coefficients for competition and incumbency status are both statistically significant and in the expected direction. Figure 3 plots the predicted probabilities of having a website based on both models for different levels of competition, incumbency, and party.
Predicted Percentage Chance of Website Use by Party, Incumbency, and Competition.
Figure 3 plots the predicted percentage chance of having a website against the candidate’s partisanship, incumbency status, and presence of major party competition. All other variables are held at their mean or mode. The left axis corresponds to the predicted percent probability dot plot. The right axis corresponds to the histogram. Predictions are obtained using Model 2-Interactions in Table 3 and state-clustered standard errors are shown using bars around the dot plot.

The likelihood that an incumbent facing a contested election employs a campaign website is 8% higher in 2018 and 11% higher in 2020, relative to unchallenged incumbents. Further, within contested elections, challengers see an 8% increase in the likelihood of website use in 2018 and a 10% increase in 2020 compared to incumbents. This results in an increase in the likelihood of having a website by 16% in 2018 and 21% in 2020 for challengers in contested elections compared to incumbents in non-contested elections. The statistically significant interaction term between contestation and incumbency serves as an indicator that the bulk of this shift occurs within the realm of incumbency. The difference between competitive and non-competitive challengers is much smaller compared to these other shifts. Finally, as Figure 3 illustrates, in both 2018 and 2020 Democrats were more likely to employ websites compared to Republicans, with an 11% increase in the likelihood of having a website in 2018 and a 12% increase in 2020.
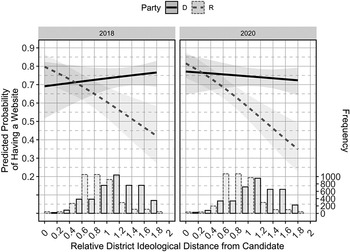
While constituent demographics and competitive environment both play a strong role in forcing candidates to take visible campaign positions through a personalized campaign website, the impact of polarization is more nuanced and dynamic. As Figure 4 illustrates, there is a strong correlation between relative ideological opposition within the district and the likelihood of website use. However, this distinction is asymmetric, in a manner typical of conversations concerning polarization. For safe districts, with relative distance scores less than 0.6, both parties seem more than willing to engage in digital campaigning. These candidates confront friendly districts and are comfortable preaching to the partisan choir. However, in adversarial districts where the relative ideological position of the district moves further from the candidate’s party, there is a divergent response between the two parties. Democrats are just as likely, if not more likely to employ a campaign website in these adversarial districts. This is an indication that Democrats are willing to reach out and proselytize amongst this strong opposition. On the contrary, among Republicans, the likelihood of a campaign website drops precipitously as the ideological composition of the district moves from safe to adversarial. A 1 standard-deviation increase in adversarial ideology (+0.36 shift) corresponds to a 9% drop in website use in 2018 and 2020. Republican candidates confront the risks of engagement with oppositional districts differently and appear unwilling to engage in personalized digital campaigning in this environment (Figure 4).
Predicted Percentage Chance of Website Use by District Ideological Adversity.
Figure 4 plots the predicted probability of having a website against relative district ideological distance from a candidate, by party. Ideological distance scores of 0 indicate a strongly supportive district while higher scores indicate an ideologically opposed district. Candidate variables are set as an incumbent in the chamber majority party in a competitive election. All other variables are held at their mean or mode. The left axis corresponds to the predicted percent probability line plot. The right axis corresponds to the histogram. Predictions are obtained using Table 3 Model 2-Interactions for 2018 (Panel 1) and 2020 (Panel 2). State-clustered standard errors are shown using shading around the linear plot.

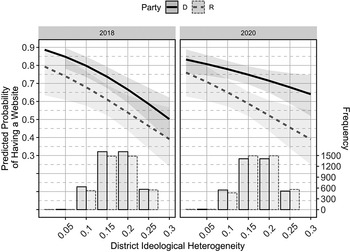
In addition to the relative ideological separation between a candidate and their district, the model also illustrates the importance of district homogeneity for both parties. Figure 5 plots the model-predicted probability of having a website against the range of district ideological heterogeneity measured as the standard deviation for the MRP estimated district ideology. Again, the bar plot along the bottom shows a histogram with the frequency of ideology scores.
Predicted Percentage Chance of Website Use by District Ideological Heterogeneity.
Figure 5 plots the predicted probability of having a website against district ideological heterogeneity by party. Ideological distance scores of 0 indicate a homogenous district while higher scores indicate an ideologically diverse district. Candidate variables are set as an incumbent in the chamber majority party in a competitive election. All other variables are held at their mean or mode. The left axis corresponds to the predicted percent probability line plot. The right axis corresponds to the histogram. Predictions are obtained using Table 3 Model 2-Interactions for 2018 (Panel 1) and 2020 (Panel 2). State-clustered standard errors are shown using shading around the linear plot.

Unlike the effects of ideological distance, the effects of ideological heterogeneity are similar across both parties. A 1 standard-deviation increase in heterogeneity (a 0.05 shift) corresponds to approximately a 7% decline in the probability of having a website for both parties and in both years.
The results from both Models 1 and 2 and across both years show that a number of demographic variables and increased competition can increase the likelihood of campaign website use in these subnational elections. However, even controlling for district demographics and competition, district ideological polarization has a strong potential effect on website use. When considering both district extremism and district ideological homogeneity, the safer a candidate feels in a district, the more likely they are to take up a personalized campaign web presence. More homogenous districts and districts with the mean ideology that is closer to the candidate’s party both correspond to an increased likelihood of website use. Candidates in these districts feel safe preaching to the choir, with little risk of angering large groups of constituents by playing to a clear party line. However, in more heterogenous districts, candidates confront increased risks due to the diversity of opinion. This is especially pronounced for Republican candidates in adversarial districts, where proselytizing among the competition risks angering both the primary and general election constituencies. The same effect does not apply to their Democratic counterparts who seem more willing to engage in this activity. This one-sided aversion to engagement undermines critical opportunities for state-level policy development and understanding among citizens and instead implicitly reinforces national partisan platforms.
Conclusion
The expansion of the Internet at the turn of the twentieth century provided renewed hope among scholars and journalists for a more active and engaged citizenry with abundant access to information. Scholars have continued to examine the role of the Internet in shaping political activity and engagement, and have found that the promise of the Internet largely fell short (Bimber and Copeland Reference Bimber and Copeland2013). Even in terms of information flows, recent scholarship has focused on the ability of the Internet to foster the propagation of misinformation (Anderson and Rainie Reference Anderson and Rainie2017; Mitchell et al. Reference Mitchell, Jurkowitz, Oliphant and Shearer2021). However, the general consensus at the turn of the twentieth century was that this new medium would, at a minimum, provided campaigns with an easy, cost-effective mechanism to convey information to citizens. As a result, websites should have become the new standard for campaigning in a digital world, and for national campaigns, this has largely been true (Druckman et al. Reference Druckman, Kifer and Parkin2018).
However, far from becoming a standard of professionalization, state legislative candidates frequently forgo campaign websites entirely with one-third of state legislative campaigns in 2018 and 2020 failing to establish an easily identifiable website. Within low-information settings, like state legislative campaigns, candidates can avoid websites to enjoy some degree of anonymity, relying instead on either partisan heuristics or microtargeting messages at particular communities. This strategy has been fostered by the nationalization and polarization of the electorate and the low rates of competition in state legislative campaigns, relative to their national counterparts (Abramowitz and Webster Reference Abramowitz and Webster2016; Hopkins Reference Hopkins2018). By avoiding public, personalized, campaign websites, candidates can avoid concrete policy statements, which may alienate more diverse electorates.
With only two-thirds of state legislative campaigns opting for personal campaign websites, there is strong evidence that the trend toward anonymity in down-ballot elections is strongly at work. However, there is substantial evidence for local factors impacting the use of campaign websites, most notably, constituent expectations rooted in demographic variation and the competitive environment a candidate faces. The models show strong evidence that higher education, younger, wealthier, and more Caucasian districts were more likely to encourage campaigns to use websites. This is largely driven by the expectations of citizens, with white, young, affluent, and educated populations being more likely to obtain news and campaign information on the Internet (Smith Reference Smith2009). However, the impact of more professionalized state legislatures is not statistically significant, indicating that norms of professionalization largely vary across district, and not necessarily state.
Finally, two additional variables loomed large in understanding district-level variation in website use. First, district population sizes within the first quartile of the population distribution (less than 33,000 residents) are less likely to correspond to website use. These districts may favor more personalized campaigns due to the lower populations. Low populations are also associated with low rates of in-home Internet access. According to data from the 2018 American Community Survey, approximately 85% of counties that fall into the first quartile of the population distribution have in-home Internet access rates less than 60%, a stark contrast compared to the 80% national average (United States Census Bureau 2016). Low Internet access within a district may correspond to reduced incentives to communicate with constituents through digital means. In addition, the competitive environment a candidate confronts may compel them to engage in more visible campaign strategies, including the use of a personal campaign website. In 2018 and 2020, a challenger was 16%–21% more likely to use a website than an uncontested incumbent. In addition, incumbents in contested races were approximately 9% more likely to use a campaign website than an uncontested incumbent.
While constituent expectations and competition can push candidates out of their preferred state of anonymity, the ideological environment within a candidate’s district can also have a significant impact on state legislative campaign website use. Ideologically diverse districts have a negative correlation with website use across both parties. The risks associated with alienating diverse populations through concrete policy statements deter this type of engagement from candidates. Instead, candidates can rely on simple partisan heuristics, name recognition, and in more professionalized campaigns, microtargeting of messages to constituent groups. Further, Republicans are especially unwilling to engage in website use in adversarial districts, where they risk alienating either primary or general election constituencies and imperiling their electability. In both instances, candidates are willing to preach to the partisan choir, but averse to engaging in proselytizing among diverse and occasionally adversarial constituencies.
The failure of the digital revolution of the twentieth century to drag state legislative campaigns into public scrutiny is deeply problematic for a number of reasons. Most importantly, a lack of distinguishing information about candidates and a reliance on nationalized partisan heuristics reinforces citizen polarization. State candidates confront a difficult task of navigating local concerns with the tangible influence of nationalized partisan agendas within the constituency. When state candidates are not compelled to endorse local concerns over national interests in a public capacity, citizens are not confronted with variation in partisan agendas. Instead, they are encouraged to view things through the nationalized red-and-blue dichotomy associated with polarization. The result enhances the potential one-sided affective citizen polarization and discourages citizen engagement with state and local politics, permitting state governments to operate their tremendous policy influence with reduced accountability.
In addition, while the Internet has facilitated the potential for additional avenues of news and information, it has also undermined specifically local coverage of state politics (Abernathy Reference Abernathy2020; Graber Reference Graber1989; Hopkins Reference Hopkins2018). With the decline in local newspapers, citizens must increasingly rely on campaign information from candidates themselves, which they are loath to provide barring the scrutiny of competition, constituent demand, or the impact of a state polarization. This combination is especially problematic when low access to information via news media combines with low website use.
While this study highlights a potential failure of the Internet to expand information access to campaigns, the changing digital media environment further complicates this position. Missing from this study is the expanded use of digital campaign content beyond a candidate’s personalized website, including social media platforms and official websites. While individual candidates are averse to consistently employing and updating campaign websites, state governments experience significant pressure to establish official legislator pages. These pages provide a key opportunity for incumbents to credit claim on significant legislation for campaign purposes while avoiding making assertive statements on undecided and contested agenda items. In addition, the growth of social media has also provided an opportunity for candidates to reach out to citizens without providing a substantial campaign agenda. Through Facebook and Twitter, candidates can respond to constituent expectations regarding web presence. However, the truncated nature of both mediums lends itself more to platitudes of support and campaign announcements than substantial policy claims. Recent research has highlighted this important distinction, especially within state legislative campaigns, showing that campaign advertisements on Facebook are more targeted to particular constituents, more identifiably partisan, and also less likely to engage in concrete policy discussions (Fowler et al. Reference Fowler, Franz, Martin, Peskowitz and Ridout2021). These alternative mediums have provided candidates the opportunity to gain some of the clear benefits of web presence without incurring the risks of a full, individual, campaign website. This is especially beneficial to candidates who wish to avoid controversial statements in diverse or ideologically opposing districts.
While this study effectively dispels the myth that campaign websites are standard practice for down-ballot elections, it raises important questions in terms of campaign content at this level. Political science has focused extensively on the role of polarization in shaping national campaigns and partisan agendas. Campaign websites at the state level reveal a potentially alterative avenue to better explore the impact of polarization for candidates in low-information settings. First and foremost, subsequent studies should target the use of campaign websites in primary elections as well. Primary elections often include fewer professional candidates, but may spur increased use of websites when they present significant competition in spite of potentially nonexistent competition in the general election. In addition, access to a consistent collection of campaign websites across the years creates opportunities to examine campaign content. While this study highlights the significant variation in website use, it does not engage in evaluating the content of campaign websites, which could provide clues as to the degree that websites individualize state candidates in the face of strong national parties. Measures of ideology and space dedicated to particular issues should be examined across not only geographic boundaries but district demographics including urban-rural distinctions. Finally, what influence do candidate qualities have on not only web presence but content as well? While the Internet has facilitated a renewed hope in the potential for information to enhance citizen engagement and democratic accountability, this study underscores the prevailing interests of politicians to avoid facilitating improved access. Future studies should continue to explore this tendency as it relates to campaigns, with an eye to better understanding the potential for state variation to undermine national partisan polarization and the polarization and nationalization of the electorate.
Supplementary Materials
To view supplementary material for this article, please visit http://doi.org/10.1017/spq.2023.1.
Data Availability Statement
Replication materials are available on SPPQ Dataverse at https://dataverse.unc.edu/dataset.xhtml?persistentId=doi:10.15139/S3/DNNRIZ (Meyer-Gutbrod Reference Meyer-Gutbrod2022).
Funding Statement
This material is based upon work supported by the National Science Foundation SBE Postdoctoral Research Fellowship under Grant No. 1808962. Any opinions, findings, and conclusions or recommendations expressed in this material are those of the author(s) and do not necessarily reflect the views of the National Science Foundation. Additional funding was provided by the University of South Carolina, College of Arts and Sciences Faculty Research Initiative.
Conflict of Interest
The author declared no potential conflicts of interest with respect to the research, authorship, and/or publication of this article.
Author Biography
Joshua Meyer-Gutbrod is teaching faculty in the Department of Political Science at the University of South Carolina, Columbia campus. His research focuses on the impact of national polarization in shaping state-level politics and he maintains the Digital Campaigns Project, tracking and archiving state legislative campaign websites.