Implications
Negative energy balance (NEB) is considered a physiological phenomenon in high-yielding dairy cows in early lactation and is often followed by negative effects on reproductive efficiency and lactation performance. Understanding the genetic basis involved in the occurrence of NEB is necessary to develop strategies for improving these negative effects. Here, we constructed an integrated gene regulatory network and identified 13 transcription factor (TF)-module and 19 micro RNA (miRNA)-module interactions with potential functions associated with biological processes in NEB development. Overall, the results of this study can be used to develop new strategies for improving NEB-associated problems in bovine.
Introduction
Negative energy balance is an altered metabolic state that occurs in high yielding cows with an imbalance between lactation and maintenance requirements (McCarthy et al., Reference McCarthy, Waters, Kenny, Diskin, Fitzpatrick, Patton, Wathes and Morris2010). This metabolic state leads to change in the ovarian cycle, reduced fertility rates and poor reproductive performance including lower conception rates and high embryonic mortality. As well as, this physiological state, increases the risk of metabolic disorders such as ketosis, fatty liver, and mastitis (because of reduced immunity) (McCabe et al., Reference McCabe, Waters, Morris, Kenny, Lynn and Creevey2012). Although there are nutritional and management strategies for the primary prevention of NEB, but the negative economic impact of NEB in dairy cattle is undeniable (Loor, Reference Loor2010). However, it is merit to mentioning that the negative economic and welfare impact of NEB on a bovine depends on its intensity and duration (Vargas Junior et al., Reference Vargas Junior, Wechsler, Oliveira, Seno, Fernandes and Camilo2013). Hence, it is possible to have cows with certain degree of NEB and different health and reproductive performance. Some of the important environmental and nutritional factors relevant to NEB is reviewed in (Herdt, Reference Herdt2000).
It is widely reported that complex diseases or disorders, similar to NEB, are more likely linked to gene regulatory networks than to any single gene (Barabási et al., Reference Barabási, Gulbahce and Loscalzo2011). Gene regulatory networks are computational models, which represent how some regulatory genes/proteins regulate the expression of other genes (Cho et al., Reference Cho, Kim and Przytycka2012). Transcription factors and miRNAs are the main regulators of these networks and dysregulation of these regulatory elements is associated with a broad range of diseases (Le et al., Reference Le, Liu, Zhang, Liu and Li2015). Transcription factors are a class of DNA-binding proteins and controls the activity of a gene. A TF bind to the TF binding site in the gene’s promoter region and lead to increase or decrease in the expression levels of its target genes. Hence, it has been widely accepted that TFs are the primary regulators of gene expression (Bakhtiarizadeh et al., Reference Bakhtiarizadeh, Moradi-Shahrbabak and Ebrahimie2014). On the other hand, miRNAs are short endogenous noncoding RNAs (18 to 24 nt), which play an important role in post-transcriptional regulation. They recognize target genes via imperfect base pairing to the 3'-untranslated region (3'UTR) of target genes and resulting in its degradation or causing translational repression (Muniategui et al., Reference Muniategui, Pey, Planes and Rubio2012). Recently, patterns of differential expression of these regulatory elements have been identified in cows with the NEB. These studies have been done by different methods such as RNA-Seq (McCabe et al., Reference McCabe, Waters, Morris, Kenny, Lynn and Creevey2012), and miRNA-Seq (Fatima et al., Reference Fatima, Lynn, O’Boyle, Seoighe and Morris2014a). These studies lead to identification of some genes and miRNAs in liver tissue (e.g. CYP11A1, FADS2, miR-122, miR-192, miR-143) involved in lipid metabolism during severe NEB (SNEB) (McCarthy et al., Reference McCarthy, Waters, Kenny, Diskin, Fitzpatrick, Patton, Wathes and Morris2010; McCabe et al., Reference McCabe, Waters, Morris, Kenny, Lynn and Creevey2012; Fatima et al., Reference Fatima, Lynn, O’Boyle, Seoighe and Morris2014a).
Despite the fact that the studies about NEB were mainly on the gene expression patterns and regulation of miRNAs or TFs/genes separately, both transcriptional and post-transcriptional regulatory interactions are not isolated from each other (Le et al., Reference Le, Liu, Zhang, Liu and Li2015). Thus, to our knowledge, the putative function of each of these regulators has often been taken into account separately for evaluating of NEB, and no study has evaluated both simultaneously. Each TF or miRNA control a large number of target genes. Also, different TFs and miRNAs can regulate one gene in a combinatorial manner (Chen and Rajewsky, Reference Chen and Rajewsky2007). It is well known that constructing the integrated regulatory networks in the presence of both TFs and miRNAs could provide more biological insights than performing separate analyses for the study of complex disorders. Therefore, it has become critical to construct an integrated regulatory network that considers both transcriptional and post-transcriptional regulatory interactions (Garraway et al., Reference Garraway, Widlund, Rubin, Getz, Berger, Ramaswamy, Beroukhim, Milner, Granter and Du2005). In this regard, the aforementioned studies on NEB do not clearly explain the behavior of regulatory genes, especially their gene regulatory network in NEB.
Experiments that can discover integrated regulatory networks remain both costly and time-consuming. Hence, development of computational approaches may facilitate the understanding of such networks (Chang et al., Reference Chang, Viader, Varghese, Payton, Milbrandt and Nagarajan2013). Currently, extensive efforts have been focused on revealing molecular mechanisms underlying complex diseases based on the integrated regulatory network by using different computational approaches (Lin et al., Reference Lin, Zhang, Zhang, Liu, Liu, Li and Guo2015). These computational approaches can discover the integrated regulatory networks by using different information such as expression profiling of genes and regulators, as well as sequence-based approaches (Chang et al., Reference Chang, Viader, Varghese, Payton, Milbrandt and Nagarajan2013). Because TFs and miRNAs regulate gene targets by binding to the promoter and 3'UTR regions of genes, respectively, many computational approaches had been developed to identify conserved sequence regions between these regulatory elements and mRNAs (Le et al., Reference Le, Liu, Zhang, Liu and Li2015). However, results of sequence-based approaches may contain a high rate of false positives and cannot identify functional changes of genes. Hence, the expression patterns of genes and regulatory factors were also integrated to overcome this problem (Le et al., Reference Le, Liu, Zhang, Liu and Li2015). The underlying hypothesis is that regulatory activity by regulators could be reflected by the expression changes of their target genes. There are different methods to integrate gene expression data into gene regulatory network (De Smet and Marchal, Reference De Smet and Marchal2010). One of the most successful approaches to understand relationships between mRNAs and regulatory elements is regulatory module network that analyzes multiple genes and regulatory element(s) simultaneously by constructing modules of them rather than analyzing each gene-regulator pair separately (Bonnet et al., Reference Bonnet, Calzone and Michoel2015; Behdani and Bakhtiarizadeh, Reference Behdani and Bakhtiarizadeh2017). In this regulatory network, highly co-expressed genes were grouped into modules. Each module may share a common regulatory mechanism and a regulator can be associated with one or more than one module, based on expression pattern (De Smet and Marchal, Reference De Smet and Marchal2010). Thus, this method assumes that regulatory elements are co-expressed with the genes they regulate. Regulatory module network-based approaches have been widely applied in analyzing gene expression data, especially for identifying functional modules (Bonnet et al., Reference Bonnet, Calzone and Michoel2015). Therefore, by integrating the gene expression data (module inference) with sequence-based approaches, we can identify more accurate candidate regulator(s) for each module (Schulz et al., Reference Schulz, Pandit, Cardenas, Ambalavanan, Kaminski and Bar-Joseph2013).
Taken together, it is not completely understood what and how different factors play important roles in the process of NEB development, understanding the integrated regulatory network of NEB will shed light on the fundamentals related basal biological processes in this metabolic state. In this study, we proposed an integrated regulatory network involved in NEB combining different sources of information, namely measurements of gene and regulators (TFs and miRNAs) expression levels from the same biological samples and computational TF and miRNA target prediction. Our approach combines a regulatory module network with TF-mRNA and miRNA-mRNA binding information. To our knowledge, this is the first study using an integrated regulatory network to study functional genomics of NEB in dairy cattle.
Material and methods
MiRNA-Seq and RNA-Seq data
Data sets with both mRNA and miRNA expression profiles with SNEB and moderate NEB (MNEB) samples from the same cows were downloaded. The animal model employed in these data sets has been described previously (Patton et al., Reference Patton, Kenny, Mee, O’mara, Wathes, Cook and Murphy2006). In these data sets, differential feeding and milking regimes were used to produce two groups of Holstein–Friesian cows; MNEB and SNEB. The nutritional and lactational management regime employed had been designed to create significant divergence in the energy balance profiles of cows in early lactation. Measurements of body condition score and energy balance had been used to select cows that showed extremes in energy balance from each group. In brief, MNEB cows were fed ad libitum grass silage with 8 kg/day of a 21% CP dairy concentrate and milked once daily. SNEB cows were fed 25 kg/day silage with 4 kg/day concentrate and milked thrice daily. For sample collection, cows were selected from each group based on extremes of energy balance. Cows were slaughtered ~14 days postpartum (mean number of days postpartum: MNEB; 13.6±0.75, range 11 to 15; SNEB 14.3±0.56, range 13 to 16) (McCarthy et al., Reference McCarthy, Waters, Kenny, Diskin, Fitzpatrick, Patton, Wathes and Morris2010). Raw miRNA-Seq data used in this study were downloaded from Gene Expression Omnibus (GEO, http://www.ncbi.nlm.nih.gov/geo/) database under accession no. GSE55882, which was based on the platform of Illumina HiSeq2000 (Fatima et al., Reference Fatima, Lynn, O’Boyle, Seoighe and Morris2014a). This data contains three and four liver tissue samples from SNEB and MNEB Holstein–Friesian cows in the early postpartum period, respectively. Moreover, raw RNA-Seq data (sequenced by Illumina Genome Analyzer II platform) from liver tissue of SNEB (three samples) and MNEB (four samples) Holstein–Friesian cows were collected from the GEO database under accession number GSE37544 (McCabe et al., Reference McCabe, Waters, Morris, Kenny, Lynn and Creevey2012). FASTQC v0.10.0 (Andrews, Reference Andrews2010) was used to carry out primary quality control of the RNA-Seq and miRNA-Seq data. Then raw data were trimmed for quality and adapter sequences using Trimmomatic software v0.32 (Bolger et al., Reference Bolger, Lohse and Usadel2014).
RNA-Seq data analysis
Spliced read aligner TopHat2 v2.0.13 (Trapnell et al., Reference Trapnell, Pachter and Salzberg2009) was used to align RNA-Seq cleaned reads from each sample to the bovine genome (assembly UMD3.1 from Ensemble database). The aligned reads from each sample were assembled into transcripts by Cufflinks v2.2.1 (Trapnell et al., Reference Trapnell, Pachter and Salzberg2009), which calculates a transcript’s relative abundance based on the number of reads supporting the transcripts, using Ensembl bovine gene annotation (release 77). In this study, abundances of transcripts were upper quartile normalized. The genome reference sequence was also supplied for sequence bias correction in order to improve expression estimates. Cuffmerge was applied to merge all the assembled transcripts generated by cufflinks to generate a unique set of transcriptomes. Cuffquant and conform were then used to provide abundance estimation across normalized samples. Here, gene expression levels were represented by the reads per kilobase of exon per million mapped reads (RPKM). The obtained expression measurements for all genes in all samples were then organized into an expression matrix. In order to remove genes with extremely low expression levels, genes with expression levels greater than one RPKM in at least one sample were selected for further analysis. Genes that vary little across samples provide less information in a regulatory network. In this regard, genes with standard deviation <0.25 across all the samples were excluded from the data for further analysis. Afterward, the final gene expression matrix was normalized to have a mean of 0 and SD of 1. Moreover, we extracted a list of 135 TFs of bovine that were presented in the gene expression matrix based on MatBase database (v 9.3) (genomatix).
Mirna-Seq data analysis
Trimmed and quality controlled miRNA-Seq data were aligned against known bovine miRNAs in miRBase (release 21) by allowing for one mismatch using bowtie1 aligner in the sRNAbench tool (Barturen et al., Reference Barturen, Rueda, Hamberg, Alganza, Lebron, Kotsyfakis, Shi, Koppers-Lalic and Hackenberg2014). Only uniquely aligned reads were retained for further analysis. After mapping, bovine miRNA read counts were merged and normalized to generate count per million (cpm). Micro RNAs with <1 cpm in at least one of the samples were excluded. Also, miRNAs with a SD <0.25 across all the samples were excluded from the data and the final gene expression matrix was normalized to have mean of 0 and SD of 1 for further analysis.
Integrated regulatory network construction
Regulatory module network
We first hypothesized that if a proportion of genes (called module) has similar expression patterns in a subset of samples, then these genes might be related to similar biological process or pathways in the development of NEB. We also hypothesized that module genes can be regulated by the regulatory elements (TF or miRNA), that have the similar gene expression pattern with them. To incorporate these hypotheses, we used Lemon-Tree software (Bonnet et al., Reference Bonnet, Calzone and Michoel2015), which is an unsupervised and module-based approach, to construct a regulatory module network. The basic theory behind regulatory module network states that the targets of a given regulatory element (TF/miRNA) are co-expressed with each other, at least in certain tissues or conditions (like NEB), and they belong to the same gene regulatory network.
Lemon-Tree allows a global interpretation of gene expression data by constructing co-expressed gene groups (modules) using probabilistic graphical models. To avoid local optima traps in the module construction step, Lemon-Tree generate multiple clustering solutions (using Gibbs sampling) and subsequently integrate into a final set of so-called tight clusters (using a novel spectral edge clustering algorithm). Tight clusters are included co-expressed genes that consistently cluster together in all solutions. Then, it assigns candidate regulator(s) to each module based on similarities in expression profiles among samples by implementing ensemble method (Bonnet et al., Reference Bonnet, Calzone and Michoel2015). In the present study, to construct modules, we generated 30 different cluster solutions from the gene expression matrix and afterward, the clusters were integrated in tight clusters. In the next step, candidate regulators (TFs and miRNAs) were assigned to modules in the hierarchical tree by logistic regression and consensus regulator-to-module score (probabilistic scores) were calculated to those regulators. The probabilistic scores reflects the overall statistical confidence and represent how well the expression pattern of the regulator match the gene expression patterns of the module genes. We then used an empirical distribution of scores of randomly assigned regulators that was calculated by the software, to evaluate the statistical significance of the assigned regulators (using an unpaired t test comparing their means). By this systems biology approach, we can identify modules of biologically related genes and their candidate regulator(s).
As the modules, may correspond to a specific biological process, detailed analysis of the modules can be useful to understand the molecular mechanisms that may be associated with the NEB. To do this, for each module, we calculated functional enrichment of gene ontology (GO) terms (category biological process) using the BiNGO tool. The Bovine whole genome was used as background and P values for each term were estimated through a hypergeometric test and corrected for false discovery rate (FDR<0.05). The same method was applied for the further GO analysis in this study.
Sequence-based information
From the regulatory module network, we can derive a high-confidence regulatory network. However, similar gene expression patterns among target genes and regulators does not necessarily imply regulation. A TF or miRNA may have similar gene expression pattern with their targets, but has no binding site on that gene’s promoter or 3'UTR regions, respectively. Hence, one possible solution to predict more reliable mRNA-miRNA/TF relations in the specific biological condition is to integrate regulatory module networks with target binding information. From this procedure, we can refine the regulatory module network into a high-confidence integrated regulatory network. In this regard, identified candidate regulators related to each module by the regulatory module network analysis were retained for further analysis. To establish binding site evidence in the identified regulatory relationships, target prediction analysis performed for the candidate regulators.
Transcription factor target prediction
We evaluated the potential of each TF to bind each of its target genes by using Genomatix software suite (http://www.genomatix.de). First, promoter sequences flanking the transcriptional start sites (–1000 to +200 bp) were extracted using Gene2Promoter software of the Genomatix. MatInspector was then used to scan for position weight matrices matches of candidate TFs in the promoter sequences of module genes from MatBase database of the Genomatix. To minimize false positive as well as false negative relationships, only pairs of TFs and targets with core similarity=1 and matrix similarity=optimized were considered. Finally, the significant and verified targets of each TF based on promoter analysis were considered as putative targets (P<0.05).
Micro-RNA target prediction
In contrast to plant miRNAs, which usually bind nearly perfectly to their targets, animal miRNA rarely has perfect complementarity to their mRNA target sites. Thus, computational approaches to find the target genes in the animal may lead to a false positive prediction (Lhakhang and Chaudhry, Reference Lhakhang and Chaudhry2012). In addition, predictions of different computational approaches have different strengths and weaknesses in terms of specificity and sensitivity (Le et al., Reference Le, Liu, Zhang, Liu and Li2015). Here, to increase the accuracy of target prediction, we employed three widely used and highly reliable target prediction software including PITA (Kertesz et al., Reference Kertesz, Iovino, Unnerstall, Gaul and Segal2007), Miranda (John et al., Reference John, Enright, Aravin, Tuschl, Sander and Marks2004) and TargetSpy (Sturm et al., Reference Sturm, Hackenberg, Langenberger and Frishman2010). Each of these software uses a different methodology for predicting miRNA targets. All the software was used by applying their default parameters. Bovine 3'UTR sequences were retrieved using BioMart (http://www.ensembl.org/Multi/martview) and subsequently fed into the software for prediction. To avoid study bias arising from false positive results, the identified targets for each miRNA were considered as putative targets, if detected by at least two out of the three applied target prediction software.
We then superimposed target prediction information onto the module network and constructed an integrated regulatory network. To explore the underlying biological processes associated with the regulatory networks and the potential TF/miRNA regulatory roles, gene targets of putative regulators were subjected to enrichment analysis using BiNGO as above described. Finally, high-confidence regulatory networks related to NEB were identified based on a comprehensive literature review and enrichment analysis results. All networks were visualized using Cytoscape software (version 3.2.1).
Results and discussion
Overview of the applied method
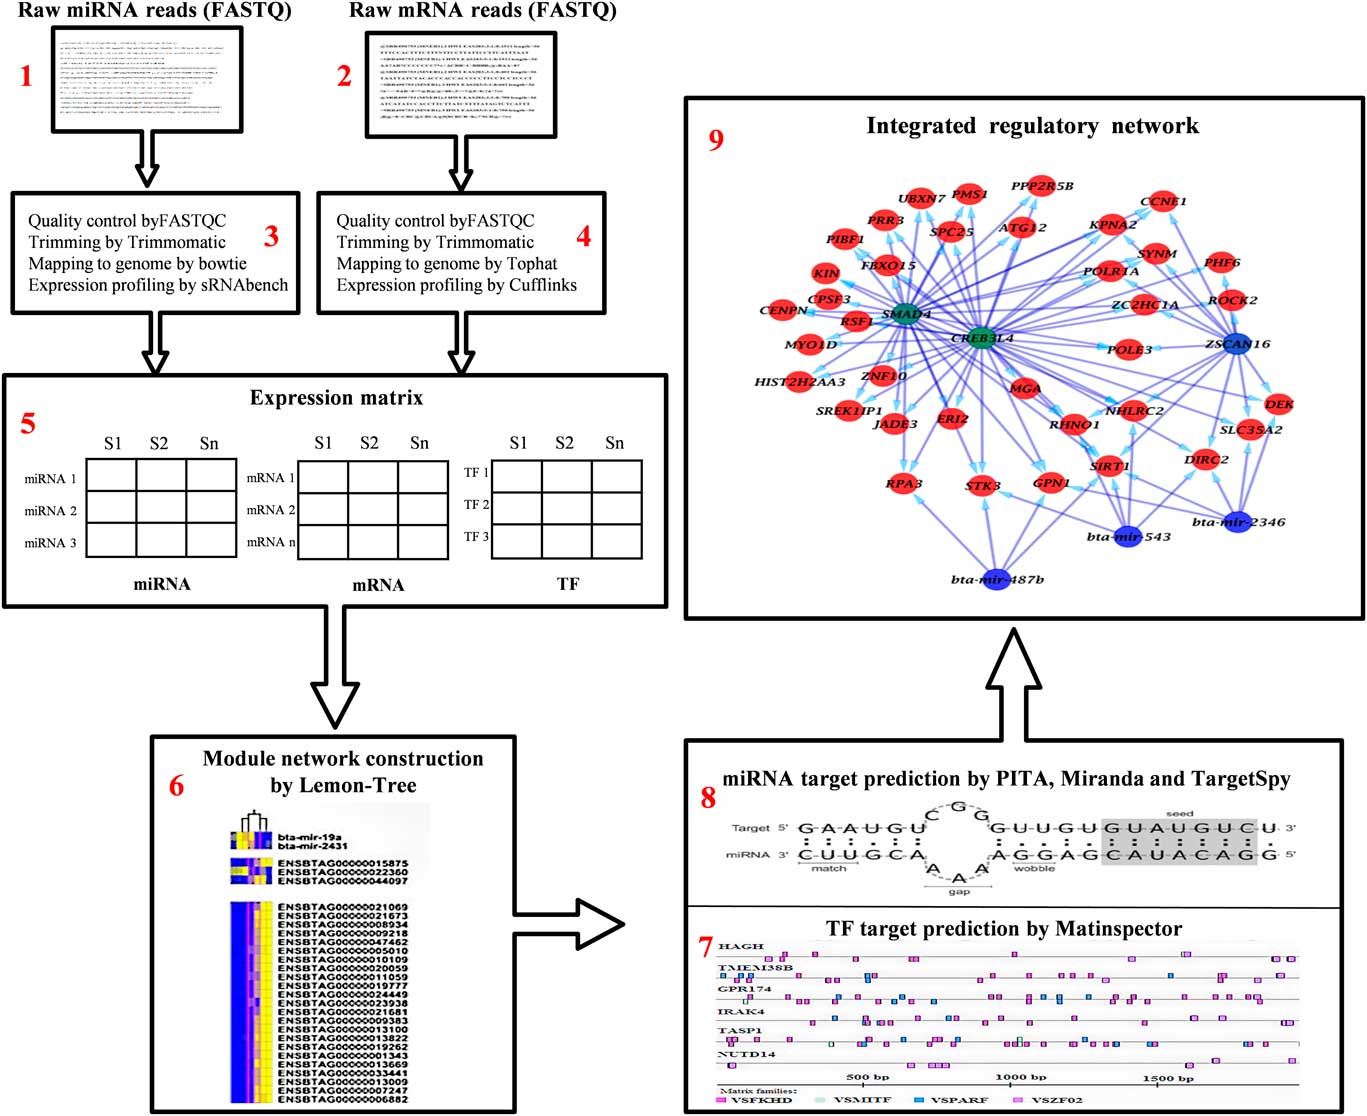
The pipeline used to construct the integrated regulatory network involved in NEB is depicted in Figure 1. The underlying assumption of our study is that genes with similar expression patterns are possibly co-expressed, share common functionality, and/or might be regulated by joint regulatory factors such as TFs and miRNAs (Cartharius et al., Reference Cartharius, Frech, Grote, Klocke, Haltmeier, Klingenhoff, Frisch, Bayerlein and Werner2005; Bakhtiarizadeh et al., Reference Bakhtiarizadeh, Moradi-Shahrbabak and Ebrahimie2014). Each regulatory program in this network consists of a TF or miRNA (or both of them), and its target genes that were co-expressed in NEB.
(colour online) An overview of our method for constructing integrated regulatory network involved in NEB in cattle. (1 and 2) Raw sample data for RNA-Seq and micro RNA (miRNA)-Seq data, respectively. (3 and 4) The processes of RNA-Seq and miRNA-Seq data analysis. At the first, RNA-Seq and miRNA-Seq data were checked by FASTQC software and trimmed by Trimmomatic tool. Then, clean reads were aligned to genome by Tophat (for RNA-Seq) and bowtie (for miRNA-Seq). The mapped reads were inputted to Cufflinks (for RNA-Seq) and sRNAbench (for miRNA-Seq) tool to construct gene expression matrix for mRNAs, transcription factors (TFs) and miRNAs. (5) Constructed gene expression matrices for miRNAs, mRNA and transcription factors. (6) Next, all of these matrices were used to construct the module network by Lemon-Tree software. (7 and 8) In the next step, miRNA target prediction along with transcription factor prediction were applied to integrate the network. (9) Finally, the integrated regulatory network was created by combining this information.

RNA-Seq and micro RNA-Seq data analysis
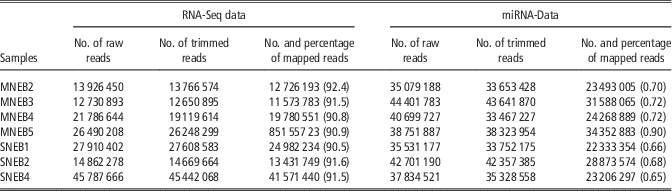
The liver, as the central metabolic organ and one of the sources of energy supply and also as a key organ in the physiological adaptation to NEB is directly affected by the NEB (Herdt, Reference Herdt2000; Fatima et al., Reference Fatima, Waters, O’Boyle, Seoighe and Morris2014b). Hence, the analyzed data set included seven liver tissue samples from three SNEB and four MNEB cows. A total of 74 934 195 and 88 560 346 reads were investigated from MNEB and SNEB RNA-Seq samples, respectively (Table 1). After removing low quality reads and adapter sequences, 71 785 382 reads were obtained from MNEB and 87 720 315 reads from SNEB samples (Table 1). Approximately 91% of clean reads were mapped successfully to the reference genome by allowing no more than two mismatches. After RNA-Seq data analysis, an expression matrix including 5793 mRNA, was obtained that was used as input to the clustering procedure. Of these genes, 135 were identified as TF (Supplementary Material S1).
Summary of reads statistic for RNA-Seq and micro RNA (miRNA)-Seq data in the development of negative energy balance in cattle

MNEB=moderate negative energy balance; SNEB=severe negative energy balance.
Also, a total of 158 932 585 and 116 066 888 miRNA-Seq reads were investigated for MNEB and SNEB, respectively. After trimming, only a few amounts of sequence reads (~0.05%) did not pass the quality filtering. Alignment with miRBase (Release 21) revealed that miRNAs were highly enriched in all samples. Most of the cleaned reads were identified as known bovine miRNA (Table 1). In total, we identified 224 known bovine miRNAs with more than 1 cpm in at least one sample (Supplementary Material S1).
Integrated regulatory network construction
Regulatory module network
As input to Lemon-Tree algorithm, we used a data set composed of expression data measured on seven SNEB and MNEB samples both for 5793 mRNAs (including 135 TFs) and 244 miRNAs. After performing 30 Gibbs sampling runs, we identified 176 clusters of co-expressed genes (with each containing at least 10 genes) that covering 4232 of the 5793 mRNAs. Our results showed that 1531 mRNAs did not share similar expression patterns with the other genes in the network and were, therefore, not included in any of the modules. The modules had a variable number of genes, with a mean of 24 genes. In all, 45 % of the modules had less than 20 genes and most of them (~94%) had <50 genes.
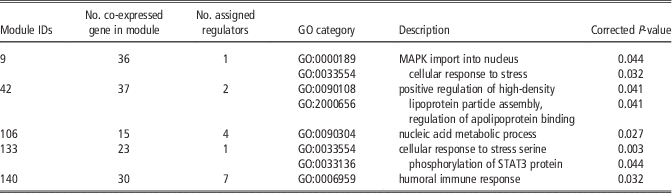
To identify the functional roles and the underlying biological processes associated with the modules, we investigated the functional enrichment of GO for all the modules. We found a total of 44 modules having at least one enriched GO term, for a total of 905 enriched GO terms (FDR <0.05). Interestingly, GO enrichment analysis revealed that biological processes such as stress, transport, storage of cholesterol, Wnt signal pathway, positive regulation activity of the TF NF-κB, response to starvation and other NEB-related biological processes were significantly enriched (Supplementary Material S2). The central role of NF-κB as an effective factor in liver tissue and NEB has been shown in previous studies (McCarthy et al., Reference McCarthy, Waters, Kenny, Diskin, Fitzpatrick, Patton, Wathes and Morris2010). In addition, NF-κB inhibits PPARγ, which is critical for fat cell differentiation (Arner, Reference Arner2003). The canonical Wnt signaling pathway can led to increased lipid accumulation in HepG2 cells. In this regard, it is reported that Wnt signaling pathway to be altered in the diabetic liver (Kaur et al., Reference Kaur, Pandey, Srivastava, Srivastava and Datta2011). These findings indicated that the power of module inference network in grouping genes that participate in the same processes or pathways (Table 2).
List of the selected gene ontology (GO) terms for some of the modules in the development of negative energy balance in cattle

The set of 176 identified modules was then applied as an input to the second stage of the Lemon-Tree algorithm, the assignment of regulators. Here, we used two different types of regulator, including TF and miRNA. The results of the regulator assigning showed that 42 of the 135 candidates TFs and 64 of 224 miRNAs were identified as candidate regulators and were assigned to 37 and 44 of 176 modules, respectively. Taken together, some regulators were assigned to more than one module, 71 and 91 different TF-module and miRNA-module interactions were identified, respectively. It can be inferred from this result that a regulator can regulate many genes involved in different biological processes. In general, 65 modules contained at least one assigned regulator, were identified. Of these modules, 28 and 21 modules contained only TF and miRNA as the regulator, respectively. Also, 32 of 65 modules had only one assigned regulator.
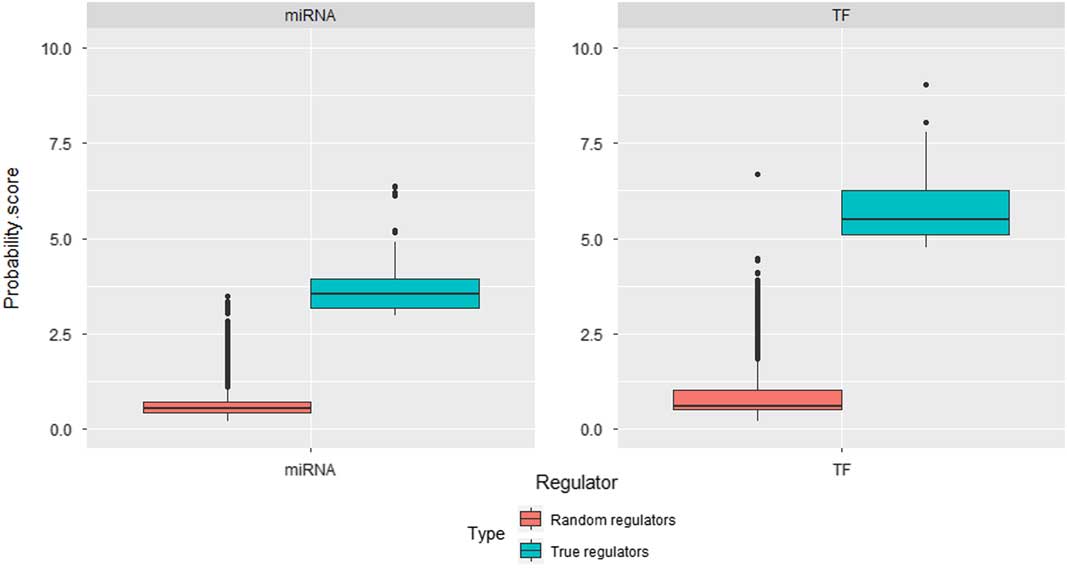
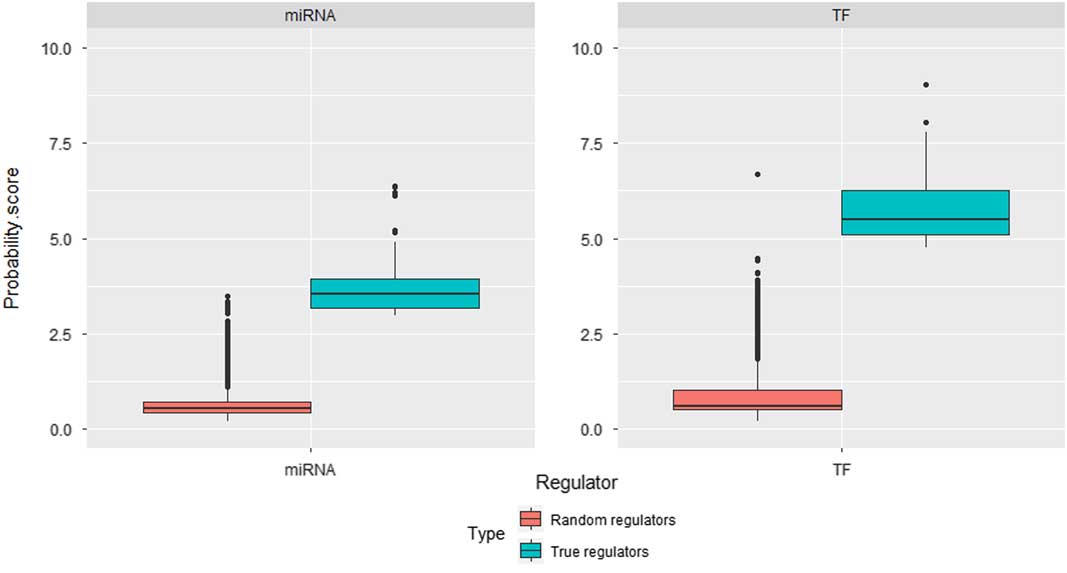
The Lemon-Tree algorithm calculates a probabilistic score to the assigned regulators. Also, for each assigned regulator to a module, the algorithm generates a second set of randomly assigned regulators. The probabilistic scores reflects how well regulator expression pattern predicts the condition-dependent expression level of the genes in a module (Bonnet et al., Reference Bonnet, Calzone and Michoel2015). Results showed that the assigned regulators were significantly different from randomly assigned regulators (unpaired t test, P-value=0) (Figure 2).
(colour online) Comparison of real and random regulator probability scores. miRNA=micro RNA; TF=transcription factor.
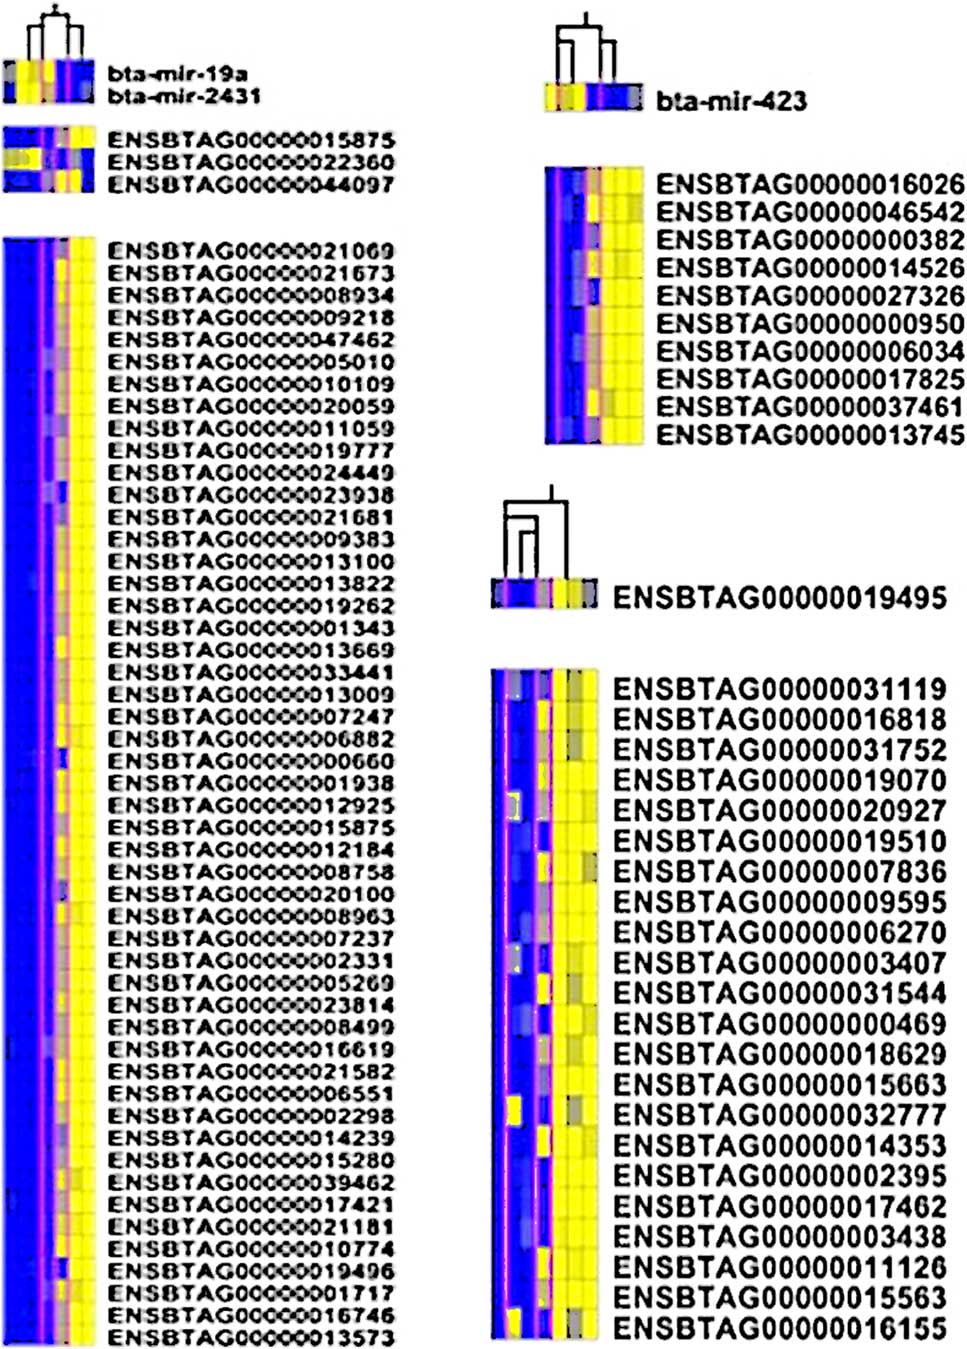
Gene regulatory factors likely to be positively (like TFs) or inversely correlated (like miRNAs) with the expression of their target genes (Wang and Huang, Reference Wang and Huang2014). Lemon-Tree assigns to each module those TFs/miRNAs, that the expression pattern best fits all or part of the condition partitions in the module (Bonnet et al., Reference Bonnet, Calzone and Michoel2015). For example, identified regulatory programs for three modules is represented in Figure 3. This figure shows that there is a relationship between module genes and regulators expression profiles.
(colour online) The regulatory program assigned to three modules, resulting from the Lemon-Tree algorithm. Figures on the right top and bottom are related to modules 155 and 170, respectively. The left figure is related to the zero module. The upper panel represents the high-scoring regulators and lower panel displays gene expression pattern of the module genes in each sample. In each figure, columns represent a different sample. The expressions of the regulators and genes are color coded ranging from dark blue (lowest expression levels) to bright yellow (highest expression levels). The regulators are assigned based on the hierarchical tree on top of the figures, which represent how samples were clustered together with the vertical pink colored line.

Sequence-based information
It is known that changes in expression patterns can be induced by an indirect regulatory effect by regulators, which is not easily distinguishable from direct effects without the aid of sequence-based information (Le et al., Reference Le, Liu, Zhang, Liu and Li2015). Here, to improve this limitation, we take into account both the module inference network and sequence-based information.
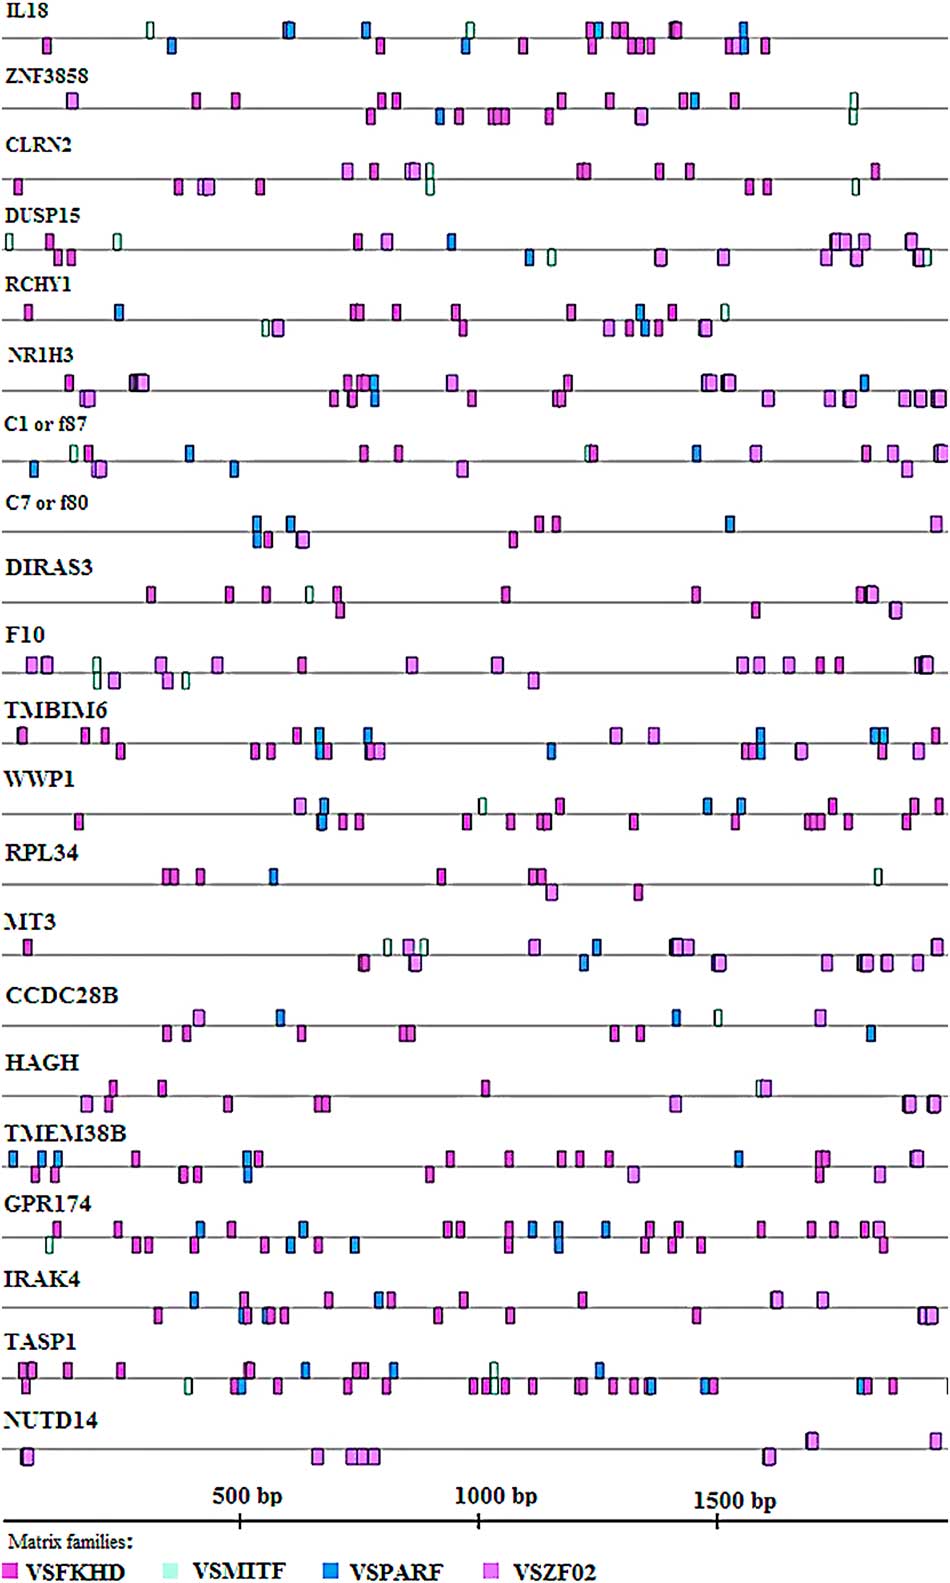
Promoter analysis results showed that 42 of 71 TF-module interactions had appropriate and significant binding sites on their target genes. The obtained regulatory network had 995 connections from 32 TFs. Noticeably, we found that on average ~70% of the targets in our module networks were also predicted as targets of the corresponding TFs by promoter analysis (for significant TFs). In this regard, all of the target genes of seven TFs (including FOXN3, SOX18, ELF3, POU2F3, NR2C1, RARG and SOX9 in modules 124, 124, 92, 171, 167, 164 and 115) that had been identified by regulatory module network, were confirmed by promoter analysis. This finding indicated an appropriate consistency between the module regulatory network and sequence-based information. An example of promoter analysis result is depicted in Figure 4.
(colour online) Transcription factor (TF) binding sites common to promoter sequences of module 145. Four TFs including ZNF219, TFEB, FOXN2 and VBP1 were identified by regulatory module network, which regulate this module. Binding sites for these TFs on promoter sequences of module genes are represented by different colors.

The results of the target prediction for miRNAs showed that ~11% (364 of 3353 interactions) of the identified miRNA-mRNA pairs by regulatory module network overlapped with predicted miRNA-mRNA pairs. The obtained regulatory network had 364 connections from 60 miRNAs (82 miRNA-module interactions) to 253 mRNAs. On average, one miRNA was connected to four mRNAs. The fraction of the confirmed miRNA targets by sequence information is relatively low. It can be induced by our stringent threshold for miRNA target prediction. We used this stringent criterion to reduce probably false positive results. It is demonstrated that coding sequences and 5'UTR of genes can be targeted by miRNAs (Tabas-Madrid et al., Reference Tabas-Madrid, Muniategui, Sánchez-Caballero, Martínez-Herrera, Sorzano, Rubio and Pascual-Montano2014). However, in the present study, the 3'UTR of target genes were only applied for target prediction.
Finally, to integrate the inferred regulatory module networks and the target prediction results, we kept those regulators that their target genes were confirmed by sequence-based information. The resulting networks were defined as integrated regulatory networks. In general, 55 modules were identified in this study that had an average of 2.3 regulators (124 regulator-module) and 11 genes per module. In other words, 42 TF-module and 82 miRNA-module interactions were defined as candidate regulatory modules in the converged integrated regulatory networks (Supplementary Material S3). In these networks, 15 modules had more than one regulator, indicating that those regulators coordinately regulated the same targets. In this regard, 13 regulators appeared in multiple regulatory modules, suggesting individual modules were interconnected.
To assess the biological relevance of the identified TFs/miRNAs as potential regulators, we investigated whether the target genes of a given regulator participate in the same biological process. To do this, for each potential regulator we tested its target genes for functional enrichment. As our input data included the regulators and gene expression profiles of NEB samples, we expected the some of the regulators to be related to this situation. Interestingly, target genes of different regulators displayed overlap and similar significant categories, supporting the relevance of regulators function in NEB (Supplementary Material S4 and S5). In all, 12 of 42 TF-module interactions had at least one overrepresented biological process term with an FDR <0.05. In this line, the TFs were enriched in 278 different GO terms that some of them were associated with the immune system and liver metabolic processes such as negative regulation of the immune system process and humoral immune response (Supplementary Material S4). Also, a total of 40 miRNA-module interactions had at least one overrepresented GO term at the 0.05 significance level (FDR). For miRNAs, 1138 different GO terms were enriched that most of them were related to stress, immune system and liver metabolic processes. The complete list of enriched categories for TF and miRNA were presented in supplementary Material S4 and S5, respectively. These results showed that our method indeed identified regulatory networks with a related function to NEB.
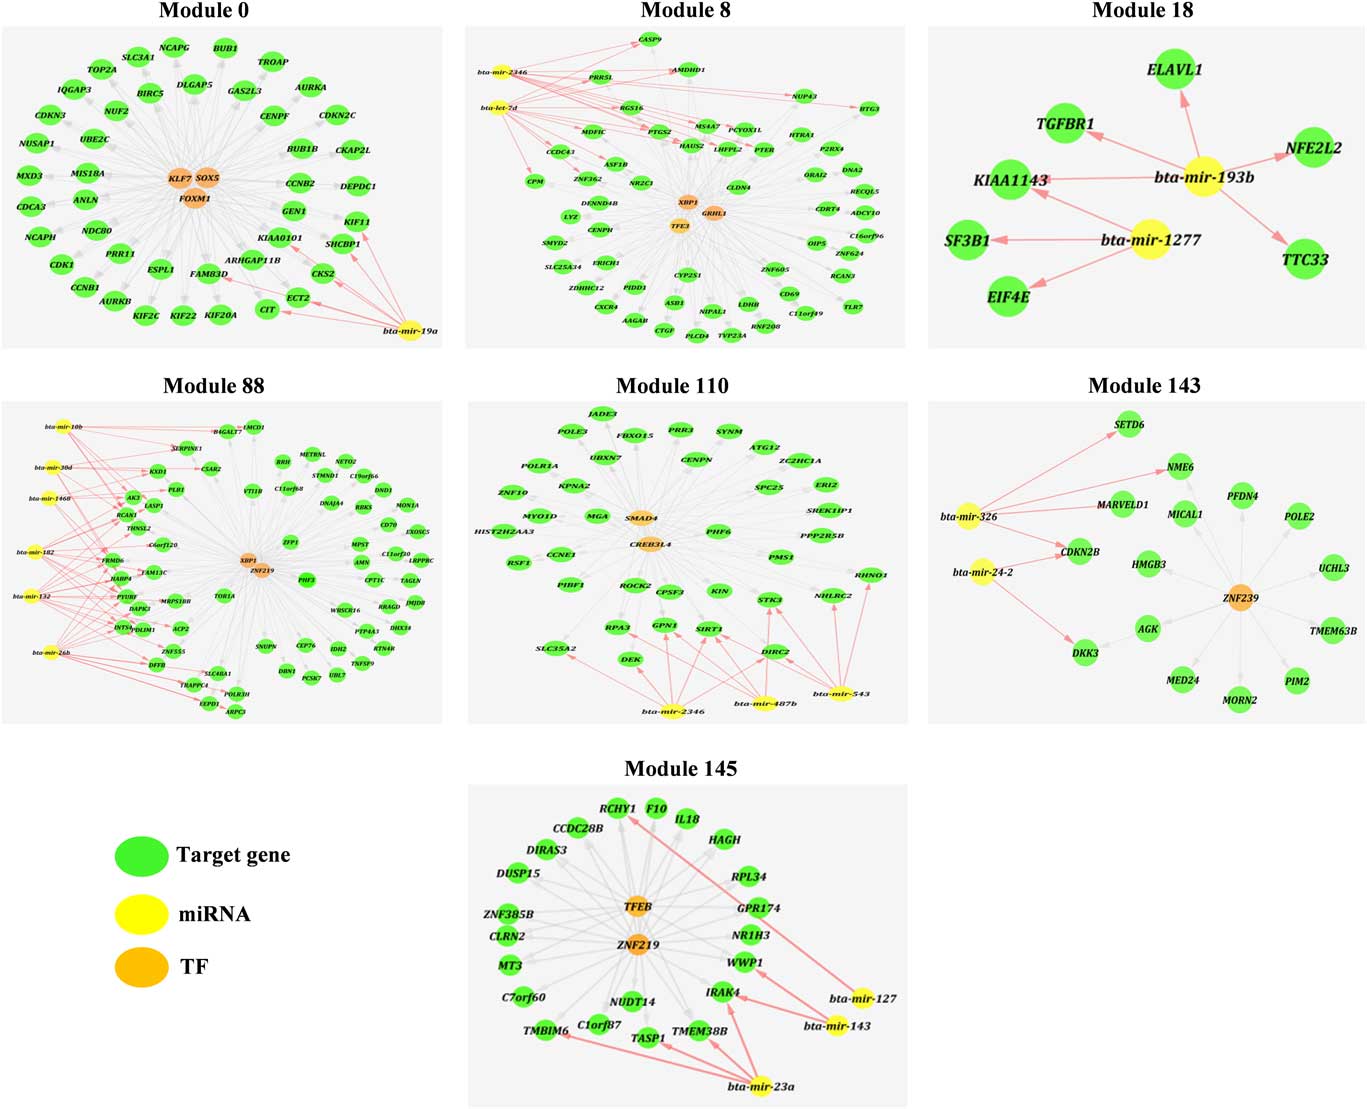
We then explored high-confidence regulatory networks involved in NEB through a comprehensive literature review, functional coherence and GO terms associated with NEB. The final integrated regulatory network included 28 regulators (contained 11 TFs and 18 miRNAs) that were assigned to seven modules. Of these, two TFs (XBP1 and ZNF219) and one miRNAs (bta-mir-2346) were assigned to two modules. On average, each TF and miRNA regulates about 49 and six genes in these networks, respectively. These networks are shown in Figure 5. Also, a detailed discussion of these networks and their regulators are provided in Supplementary Material S6. Moreover, a summary and some selected GO terms of these networks are listed in Supplementary Material S7.
(colour online) Representation of the module networks inferred from the integrated regulatory network method. miRNA=micro RNA; TF=transcription factor.

It is commonly known that understanding the gene regulatory mechanisms of the NEB is crucial for development of NEB therapeutics. In order to understand the complex mechanisms of gene regulation, it is necessary to study the gene regulatory mechanisms at both transcriptional and post-transcriptional levels (Chen et al., Reference Chen, Wang, Lu, Guo, Hong, Kang and Wang2012). Hence, combining different sources of high-throughput data is a promising way of extracting biologically meaningful information embedded in NEB. Here, the availability of miRNA and mRNA expression profiles from the same NEB cows, provides an unprecedented opportunity to identify integrated regulatory network involved in NEB.
Some studies focus on differentially expressed genes as the nodes for the gene regulatory network construction. However, it has been reported that disease/disorder genes do not always show differential expression in gene expression studies (Zhao et al., Reference Zhao, Yang, Huang and Holme2011). Here, to address this challenge, we used genes/miRNAs with standard deviation >0.25 across all the samples. Therefore, this resulted in differentially or non-differentially expressed genes/miRNAs with expression variations across all the samples.
The validity of the identified modules might be strongly dependent on the quality of the data sets. Here, we used RNA-seq and miRNA-seq data sets. It is demonstrated that RNA-seq data (and miRNA-seq) is a powerful transcriptome profiling technology that allows us to study the complete transcriptome with more precise measurements and in more detail in comparison with microarray (Iancu et al., Reference Iancu, Kawane, Bottomly, Searles, Hitzemann and McWeeney2012). Our results indicated that the identified modules and their assigned regulators are relevant to the biological condition of the data set. In this line, all of the modules contained gene targets and regulators, which are known to be involved in NEB or liver metabolic processes. For example, TFE3, miR-132, XBP1, miR-543 and miR-23a were identified as regulators based our analysis, and several studies reported that they were closely related to liver metabolic processes as well as immune and stress responses (Shimano, Reference Shimano2007, Lee et al., Reference Lee, Scapa, Cohen and Glimcher2008; Wang et al., Reference Wang, Zheng, Wang and Li2013; Hu et al., Reference Hu, Chi, Zhang, Bai, Zhao, Feng and Tian2015). This finding point towards a connection between the integrated gene regulatory networks and NEB-related process. This result is also consistent with the previous study, which showed that disruptions of regulatory genes functions tend to have similar effects as disruptions of their target gene functions (Guo et al., Reference Guo, Alexander, Clark, Grimson and Yu2016).
One of the applications of gene regulatory network is discovering the functions of regulators based on GO terms that are significantly overrepresented in the annotations of their predicted targets. Here we showed that the genes of some of these modules were significantly enriched in different NEB-related biological process terms such as regulation of brown fat cell differentiation, negative regulation of lipid metabolic process, behavioral response to starvation, response to oxidative stress, cellular response to glucose starvation and response to immune system. This result further proved the importance of our identified regulatory networks in another way. Therefore, these findings suggested that target genes and the regulators in the integrated regulatory networks may be closely related to NEB in general. One of the advantages of a module-based approach is the fact that if a certain module contains several known targets of the assigned regulators, the rest of the unknown targets in this module can be considered high-confidence predictions for that regulator (Chang et al., Reference Chang, Viader, Varghese, Payton, Milbrandt and Nagarajan2013, Bonnet et al., Reference Bonnet, Calzone and Michoel2015). Here, we found known gene targets for some of the regulators, including FOXM1 (Li et al., Reference Li, Zhang, Zhou, Wang, Wang and Han2011) and bta-mir-19a (Pedernera et al., Reference Pedernera, Celi, Garcia, Salvin, Barchia and Fulkerson2010) in module zero, bta-mir-26b and bta-mir-30d (Pedernera et al., Reference Pedernera, Celi, Garcia, Salvin, Barchia and Fulkerson2010) in module 88 and miRNA-543 (Hu et al., Reference Hu, Chi, Zhang, Bai, Zhao, Feng and Tian2015) in module 110 which demonstrates again the reliability and validity of our method.
The construction of the integrated regulatory networks related to particular states (like NEB) is still in the early stages of development. However, advances in the construction of such networks are essential and will eventually contribute to the identification of better molecular mechanisms for controlling the progression of them. To our knowledge, this is the first attempt to construct the integrated gene regulatory network in NEB. The regulatory networks we identified could help to provide biological insights in NEB and could be validated by experimental evidence. This study also had some limits, such as a small number of samples. Therefore, just as with other similar approaches, care has to be taken in the interpretation of the inferred regulatory mechanisms.
Conclusions
We introduce here a pipeline to reconstruct the integrated regulatory network involved in NEB. The most relevant finding of this study was the identification of seven integrated regulatory networks that encompasses target genes and regulators associated with NEB-related processes.
Acknowledgments
This work was supported by University of Tehran.
Supplementary material
To view supplementary material for this article, please visit https://doi.org/10.1017/S1751731117003524