
Introduction
Detection of hydrogen peroxide (H2O2) plays a key role in various applications ranging from food and environmental analysis to biochemistry.[Reference Chen, Wu, Cai, Oyama and Chen1–Reference Wang, Han, Liu, Chen, Ren, Yang and Wen3] Furthermore, since H2O2 is generated from the respiratory chain cascade and cellular metabolism, its level in blood can be used to diagnose asthma, inflammatory arthritis, diabetic vasculopathy, and a number of neurodegenerative diseases.[Reference Bae, Kang, Seo, Baines., Tekle, Chock and Rhee4–Reference Rojkind, Dominguez-Rosales, Nieto and Greenwel6] For this reason, researchers have focused on the development of novel methods to determine the level of this important analyte in fast, cost-effective, and accurate manners. While there are various analytical methods such as colorimetry,[Reference Uzer, Durmazel, Ercag and Apak7] titrimetry,[Reference Gimeno, Bousquet, Lassu, Maggio, Civade, Brenier and Lempereur8] chromatography,[Reference Song, Wang, Chen and Wang9] photometry,[Reference Pinkernell, Luke and Karst10] and electrochemical analysis[Reference Uzunoglu, Scherbarth and Stanciu11] exploited to determine the level of H2O2 in different media; simpler, cost-effective, and faster methods with higher sensitivity and selectivity must be developed to meet high-technology requirements.[Reference Liu, Hiekel, Hubner, Sun, Ferancova and Sillanpaa2] Among the mentioned techniques, electrochemical methods offer many advantages including fast response, low cost, simplicity, high sensitivity and selectivity, rendering electrochemical detection of H2O2 one of the most promising ones for commercialization.[Reference Uzunoglu, Scherbarth and Stanciu11]
Among all carbon species, carbon nanotube (CNT) and graphene are the most studied allotropes due to their unique structural, electronic, physical, mechanical, and chemical properties.[Reference Biswas and Lee12] The use of CNTs in nanoscience has made it possible to design novel catalyst and support materials for catalytic and electrochemical applications.[Reference Serp, Corrias and Kalck13] Similar to CNTs, the discovery of graphene which consists of single-layered carbon atoms bonded with sp2 hybridization allowed researchers to develop electrochemical sensors with enhanced performance.[Reference Bas14, Reference Tian, Wang, Liu, Pang and Zhang15] Graphene displays unique electronic, optical, and catalytic properties, easy surface modification, and large specific surface area.[Reference Shao, Wang, Wu, Liu, Aksay and Lin16] Since two-dimensional (2D) graphene and 1D CNT exhibit exceptional physicochemical properties in low dimensions, the combination of these two materials is of great interest to extend the mentioned properties into three dimensions.[Reference Liu, Wang, Wang, Wang, Flahaut, Liu, Li, Wang, Xu, Shi and Zhang17] It was reported that the integration of CNTs and graphene into a 3D hierarchical structure enhances mechanical, electronic, catalytic, and electrochemical properties of nanostructures.[Reference Liu, Wang, Wang, Wang, Flahaut, Liu, Li, Wang, Xu, Shi and Zhang17, Reference Fan, Yan, Zhi, Zhang, Wei, Feng, Zhang, Qian and Wei18] For Instance, Fan et al.[Reference Fan, Yan, Zhi, Zhang, Wei, Feng, Zhang, Qian and Wei18] reported that CNT/graphene hybrids displayed a potential to achieve improved electrochemical performance for electrochemical sensor and super capacitor applications.
Up to date, a great number of research papers on the development of electrochemical sensors using metal nanoparticles (MNPs) have been published. Transition metals such as Pt, Au, Ag, Pd, and Cu are some of the widely used nanoparticles for this purpose. It was shown that the use of MNPs in electrochemical sensors as electroactive materials yielded large electrochemical surface area, high-diffusion rate as well as high-catalytic activity.[Reference Cui, Wu, Li and Wan19, Reference Sophia and Muralidharan20] To control the size and homogeneity, and prevent the agglomeration; MNPs are generally immobilized and stabilized on conductive and porous support materials.[Reference Campelo, Luna, Luque, Marinas and Romero21] Due to having large physical surface area and excellent electronic conductivity, carbon and carbon-based nanomaterials have been extensively used in sensing applications.[Reference Campelo, Luna, Luque, Marinas and Romero21] Recent studies indicated that the graphene-supported MNPs-based sensors showed not only improved performance but also wider linear range.[Reference Shao, Wang, Wu, Liu, Aksay and Lin16, Reference Uzunoglu, Song and Stanciu22]
In the previous works, our group showed that electrochemical H2O2 sensors with a high sensitivity and wide linear range could be prepared by taking advantage of the large physical surface area, high-catalytic activity, and fast electron transfer properties of PdAg-decorated reduced graphene oxide (rGO) (PdAg/rGO) nanocomposites.[Reference Uzunoglu, Song and Stanciu22] The 3D structure and the concomitant large surface area of rGO made it possible to detect H2O2 in a wide concentration range (0.05–28 mM). The obtained results suggested that electrochemical detection of H2O2 is highly dependent not only on the catalytic activity of MNPs but also on the nature of the support material. For this reason, in the present study, we focused on the development of electrochemical H2O2 sensors with a high performance and wide linear range by tailoring physicochemical properties of the support material. With this purpose, PdAg-decorated rGO–multi-walled carbon nanotube (MWCNT) (PdAg/rGO–MWCNT) hierarchical nanostructures were prepared and used as catalysts for electrochemical detection of H2O2. To the best our knowledge, this is the first report showing the use of PdAg/rGO–MWCNT hierarchical nanostructures for the construction of electrochemical sensors. The nanocomposites with different rGO/MWCNT ratios were prepared using a simple one-pot chemical reduction method. x-ray diffraction (XRD), transmission electron microscopy (TEM), scanning electron microscopy (SEM), energy-dispersive spectroscopy (EDS), thermogravimetric analysis (TGA), and Fourier transform spectroscopy (FTIR) methods were implemented to characterize the nanostructures. Electroanalytical studies were conducted using cyclic voltammetry (CV) and chronoamperometry methods.
Materials and methods
Materials
Metal precursors (PdCI2, AgNO3), reducing agent (L-ascorbic acid), dispersant (dimethylformamide (DMF)), and graphene oxide (GO) were purchased from Sigma-Aldrich. Multi-walled CNT (MWCNT) and H2O2 were obtained from Aldrich and EMSURE®, respectively. The interferants (ascorbic acid, uric acid, and glucose) used for selectivity experiments were purchased from Sigma. The chemicals used as received.
Synthesis and characterization of the nanostructures
PdAg/rGO–MWCNT-based nanohybrids were synthesized according to a study reported by Kim et al.[Reference Kim, Jeong, Choi, Yoon, Jeon, Lee and Kim23] In brief, required amount of GO and MWCNT were dispersed in de-ionized (DI) water until achieving a homogeneous suspension. Then, the suspension was boiled at 100°C for 1 h. After 1 h, metal precursor solutions [PdCI2, AgNO3; (5 mM, 1 mL)] were introduced slowly into the boiling suspension. Subsequently, 100 mM of ascorbic acid solution (1 mL) was added dropwise and left for stirring for an additional 5 min. The resultant mixture was centrifuged and washed with DI. The obtained slurry was then freeze-dried to obtain 3D hierarchical structures. To evaluate the effect of support material on sensor performance, while the total carbon content was fixed to 20 mg in the starting solution, the GO:MWCNT ratio was adjusted to 2:1, 1:1, and 1:2.
A Brucker D8 Focus diffractometer equipped with Cu Kα radiation source was implemented to collect XRD data. The amount of metal (PdAg) anchored on rGO–MWCNT was determined using a Q50 TGA thermogravimetric analyzer purchased from TA instruments. FEI Technai operating at 200 kV and Hitachi SU 1510 equipped with an EDS unit were utilized to take the TEM and SEM images, respectively. The surface functional groups were studied using a Thermo Scientific Class 1 Laser Product FTIR (USA).
CV and chronoamperometry methods were conducted in 0.01 M PBS using a 3 electrode cell and a potentiostat (CH instruments 660C). The mirror-like surface of glassy carbon electrodes (ø = 3 mm) was modified with nano hybrid-containing solution (1 mg/mL DMF) by drop-casting to prepare the sensors.
Results and discussions
Characterization of the nanohybrids
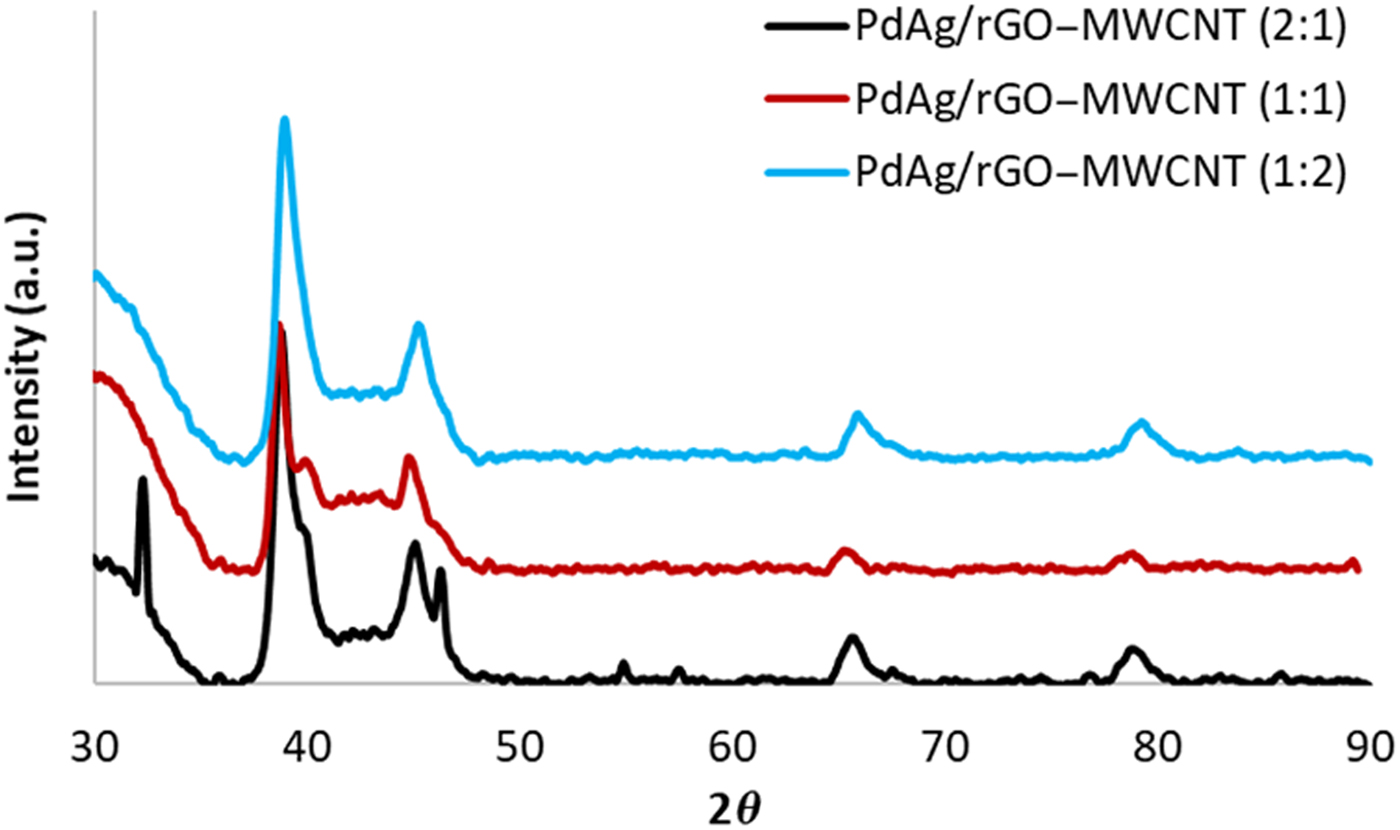
XRD patterns of PdAg/rGO–MWCNT nanostructures with different rGO:MWCNT ratios are shown in Fig. 1. The obtained XRD reflections were between typical Ag and Pd peaks located at the 2θ values of 38.20°, 44.34°, 64.52°, 77.49° (JCPDS 46–1043) and 40.19°, 46.83°, 68.46°, 82.40° (JCPDS 4–0783), respectively. To show the shifts in peak locations clearly, XRD reflections of the samples along with the typical Pd and Ag peaks are given in Fig. S1. This indicated the formation of PdAg nanoalloys on the support material. On the other hand, with the increasing portion of MWCNT, PdAg alloying degree descended as suggested by the appearance of shoulders on the signals. Furthermore, the sample with the highest amount of MWCNT showed the formation of an additional XRD peak at the 2θ value of 46.36°. Therefore, it can be stated that although PdAg alloy nanoparticles were formed simultaneously during the synthesis process for all samples, the alloying degree was limited for high-MWCNT contents (1:1, 1:2). XRD reflections appeared at lower Bragg angles correspond to the presence of carbon species (rGO and MWCNT). The average crystalline size of the samples was calculated according to Scherrer's equation using (111) plane and was found to be around 14, 15, and 10 nm for PdAg/rGO–MWCNT (2:1), PdAg/rGO–MWCNT (1:1), and PdAg/rGO–MWCNT (1:2), respectively. It must be noted that the variation in the particle size may be attributed to the formation of the shoulders in the (111) peaks as seen in Fig. 1.
XRD results of the prepared samples.

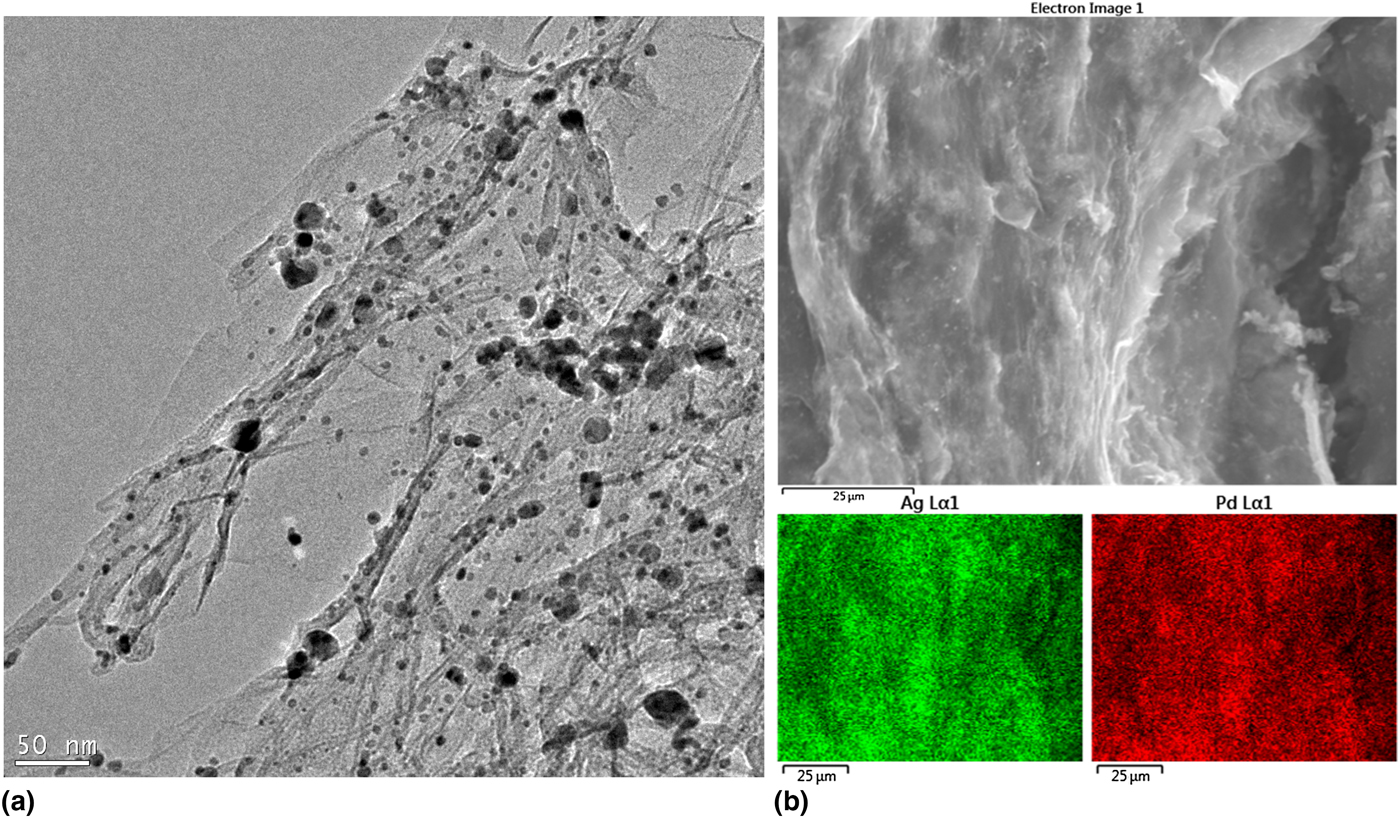
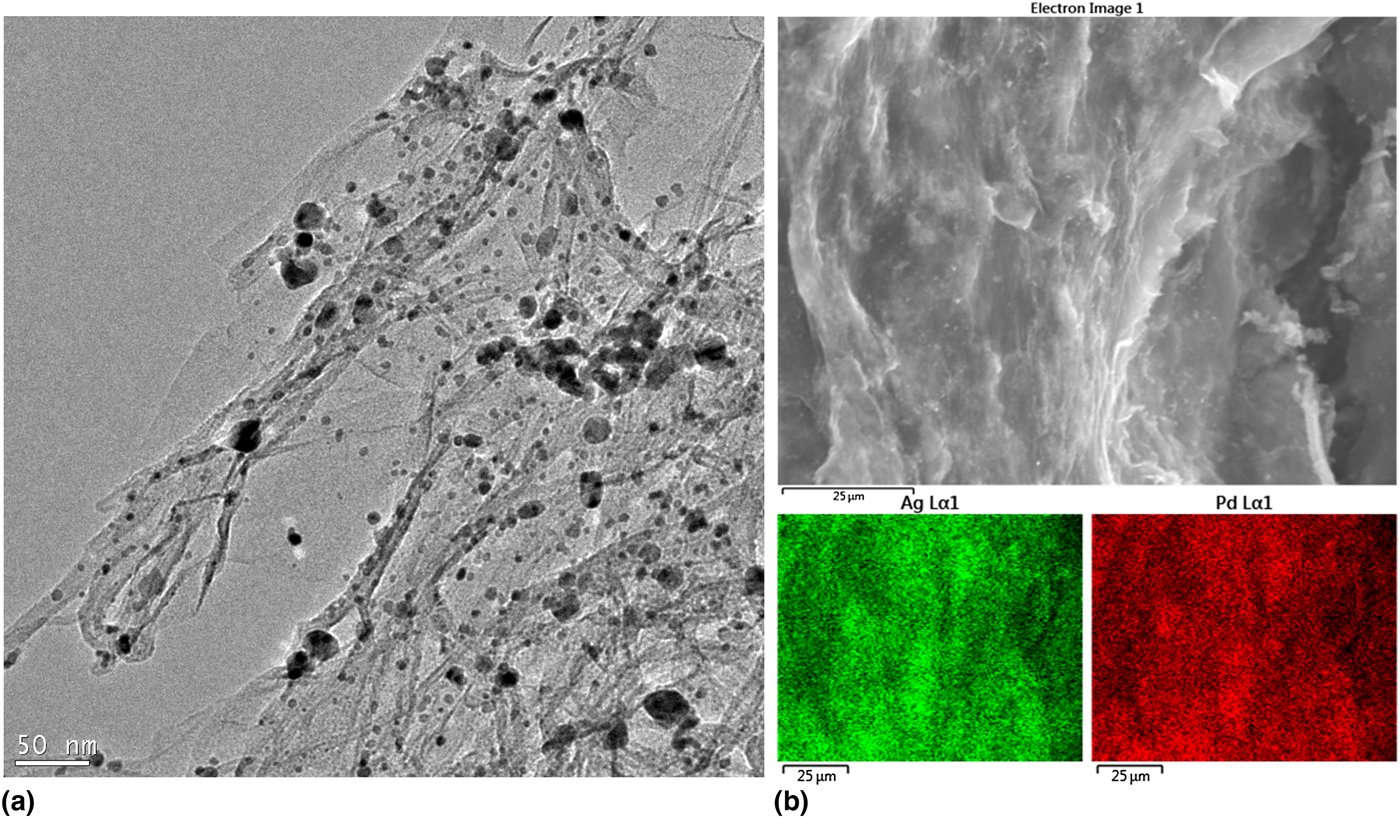
TEM image shown in Fig. 2(a) confirmed the successful immobilization of MNPs on the surface of rGO–MWCNT hybrids. The particle size, however, displayed a broad range because of the uncontrolled synthesis conditions. In other words, the synthesis of the nanohybrids was conducted at high temperature without the use of any surfactant, which influenced the particle size distribution profoundly. The 3D structure of the nanocomposites was unveiled using SEM image shown in Fig. 2(b). It was observed that the nanocomposites had a rough surface with 3D structure. The composition of the deposited MNPs was determined using EDS method and the Pd/Ag atomic ratio was calculated as around 46/54 which is close to the starting atomic ratio. EDS mapping results taken from region shown in Fig. 2(b) indicated a homogeneous metal dispersion on the support. The metal content present in the hybrid materials was found to be around 40 wt%.
(a) TEM, (b) SEM and EDS mapping images obtained from PdAg/rGO-MWCNT nanostructures.
The surface functional groups were determined using FTIR and the results are given in Fig. S2. The broad FTIR peaks appeared at high wavenumbers (~3500/cm) are associated with O-H groups.[Reference Uzunoglu, Song and Stanciu22] The bands located at 2920 and 2850/cm correspond to the stretching vibrations of C-H groups.[Reference Wang, Yu., Huang, Zhou, Song, Song, Long, Cifuentes, Humphrey, Zhang, Shao and Zhang24] The presence of FTIR peaks located between 2350 and 2100/cm are attributed to CO2, resulted from the experiment conditions. The weak FTIR bands observed at the wavenumbers of 1680 and 1540/cm correspond to ketone and C = C groups.[Reference Zhao, Liu and Li25] To show the effect of the reduction process on the surface chemical groups of the nanohybrids, the FTIR spectrum of GO was included in Fig. S2. The figure indicated that the FTIR signals corresponding to C-O, C-O-C, and O-H groups were much weaker than that of GO, indicating that GO was converted to rGO.[Reference Uzunoglu, Song and Stanciu22]
Analytical performance of the constructed sensors
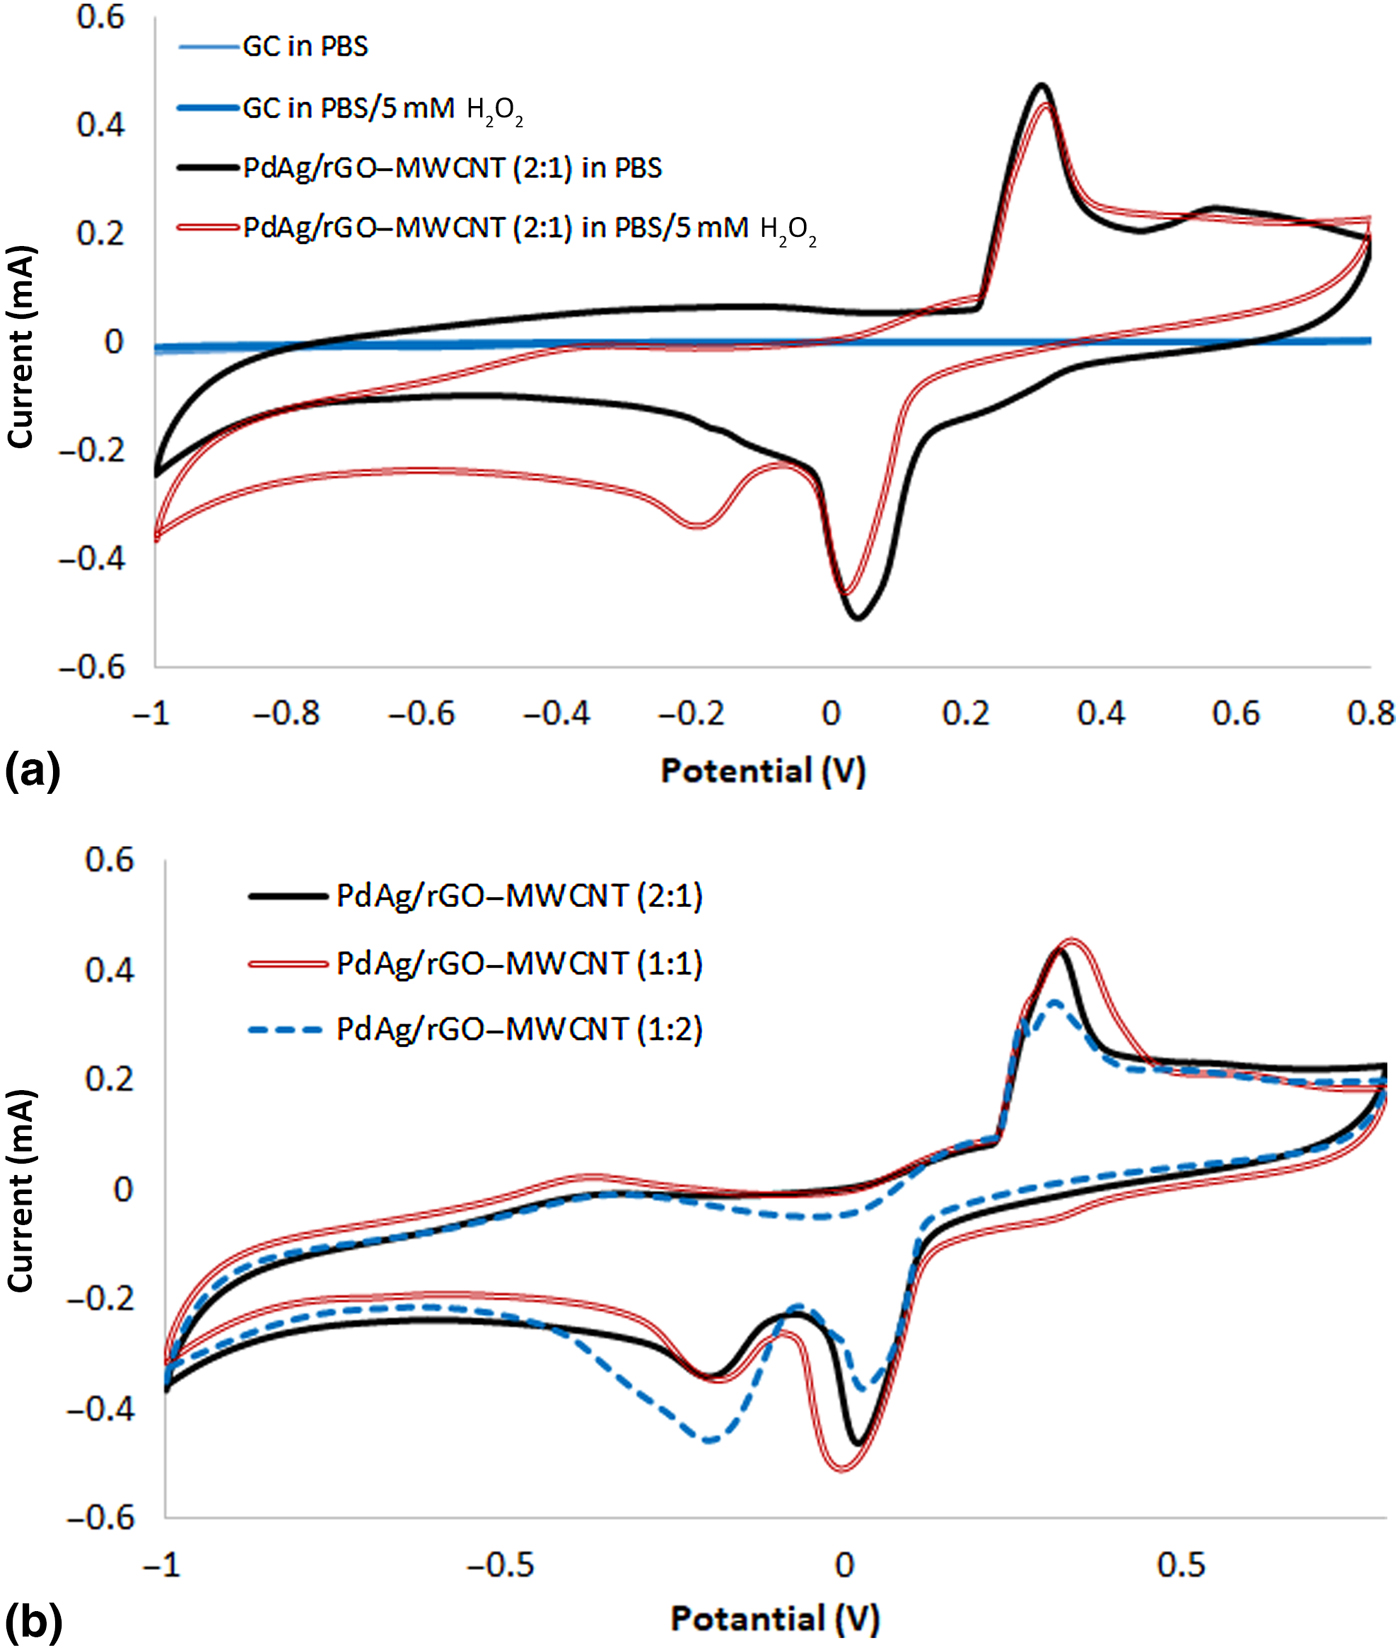
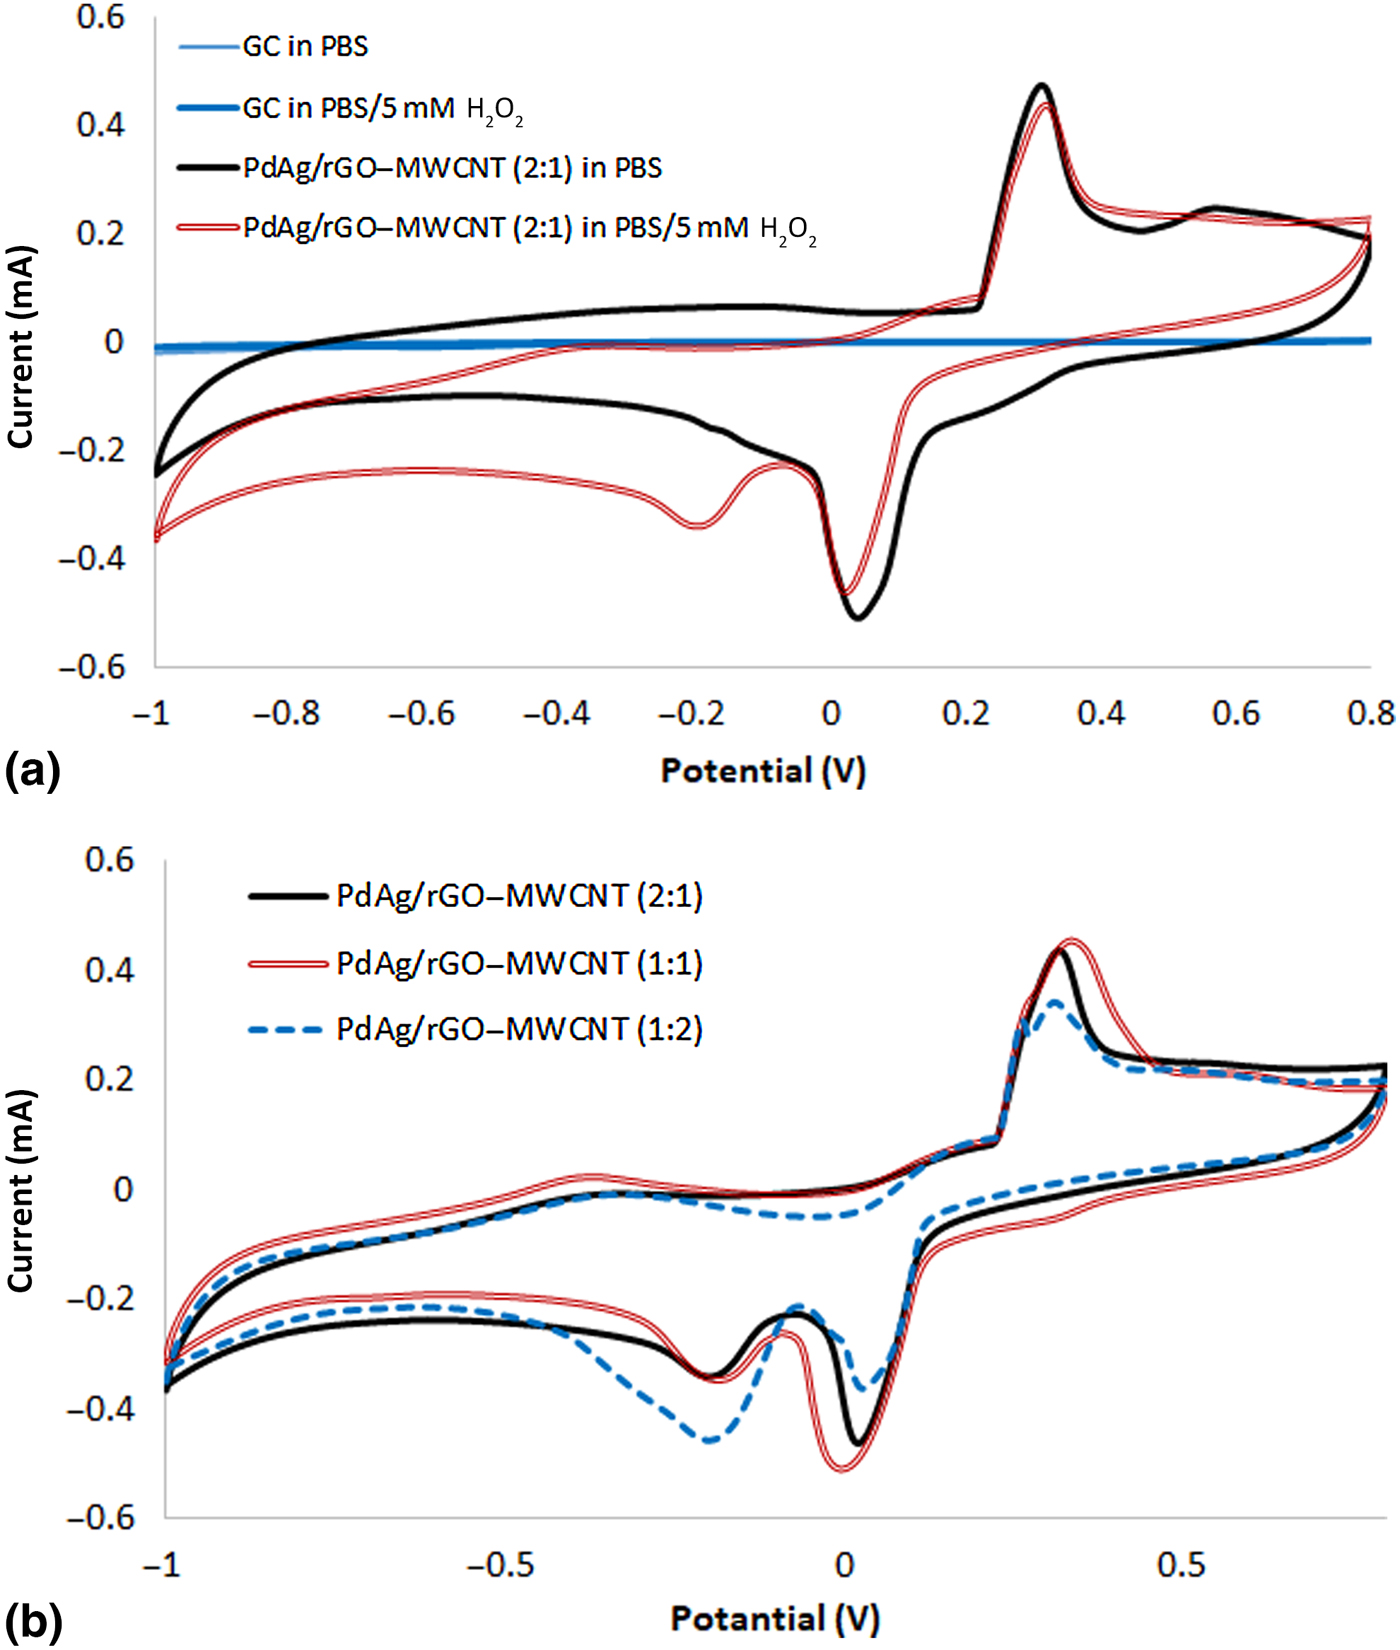
The electrochemical behavior of the constructed sensors was evaluated using CV and the results are shown in Figs. 3(a)–3(b). It was observed that bare GC electrode did not show any redox activity in both H2O2-free and H2O2-containing PBS [Fig. 3(a)]. The modification of the electrode surface, however, affected the electrochemical behavior of the electrode significantly. After the decoration of the electrode surface with PdAg/rGO–MWCNT (2:1) nanohybrid, two redox peaks appeared at ca. 0.3 and 0.04 V in H2O2-free electrolyte. These redox peaks are ascribed to the oxidation and reduction of MNPs anchored on the support.[Reference Uzunoglu, Song and Stanciu22] When the CV experiments were repeated in the presence of 5 mM H2O2,additional redox peaks corresponding to the oxidation and the reduction of the analyte were observed. While the oxidation of H2O2 was observed by the emergence of a shoulder on the oxidation peak of the MNPs, the reduction of H2O2 yielded a well-defined peak at around −0.2 V. To compare the electrochemical activity of different hybrids, CV results of PdAg/rGO–MWCNT-based sensors with varying rGO:MWCNT ratios are shown in Fig. 3(b). The results suggested that the support configuration had a significant effect on the electroanalytical performance of the sensors. Although all sensors showed a capability for the oxidation and reduction of H2O2, the redox performances were different especially for the reduction reactions. Since the oxidation peak of H2O2 overlaps with the oxidation peak of MNPs, the reduction of H2O2 was taken into account to compare the electroanalytical performances. The reduction performance of the electrodes followed the order of PdAg/rGO–MWCNT (2:1) <PdAg/rGO–MWCNT (1:1) <PdAg/rGO–MWCNT (1:2). Since the best reduction performance was obtained from the sensor with the highest MWCNT content, PdAg/rGO–MWCNT (1:2)-based configuration was used for further experiments in the optimization process. Effects of scan rate on the peak current and the location were also studied. As shown in Fig. S3, the reduction peak current displayed a linear increase with the square root of the scan rate. These results suggested that the reduction reaction of the analyte is diffusion controlled. Besides having overlapped oxidation peak with MNPs, the reduction of H2O2 yielded higher currents. It must be noted that the operation of electrochemical sensors at positive potentials poses drawbacks related to interference effects of other substances present in real samples. When all of these factors are taken into account, the working potential was chosen in the cathodic region. The current-time graphs of the PdAg/rGO–MWCNT (1:2)-based sensors obtained by the addition of 5 mM H2O2 into the PBS at different applied potentials are shown in Fig. S4. It was observed that while a decrease in the applied potential enhanced the sensor response significantly until −0.5 V, further decrease did not yield an important change in the current. As a result, −0.5 V was chosen as the optimum working potential.
Electrochemical characterization of the constructed sensors; (a) CV plots of bare and PdAg/rGO–MWCNT (2:1)-decorated GCs in the absence and presence of H2O2 recorded at the scan rate of 0.1 mA s-1, (b) CV voltammographs of PdAg/rGO–MWCNT nanohybrids with varying rGO:MWCNT ratios in PBS containing 5 mM H2O2
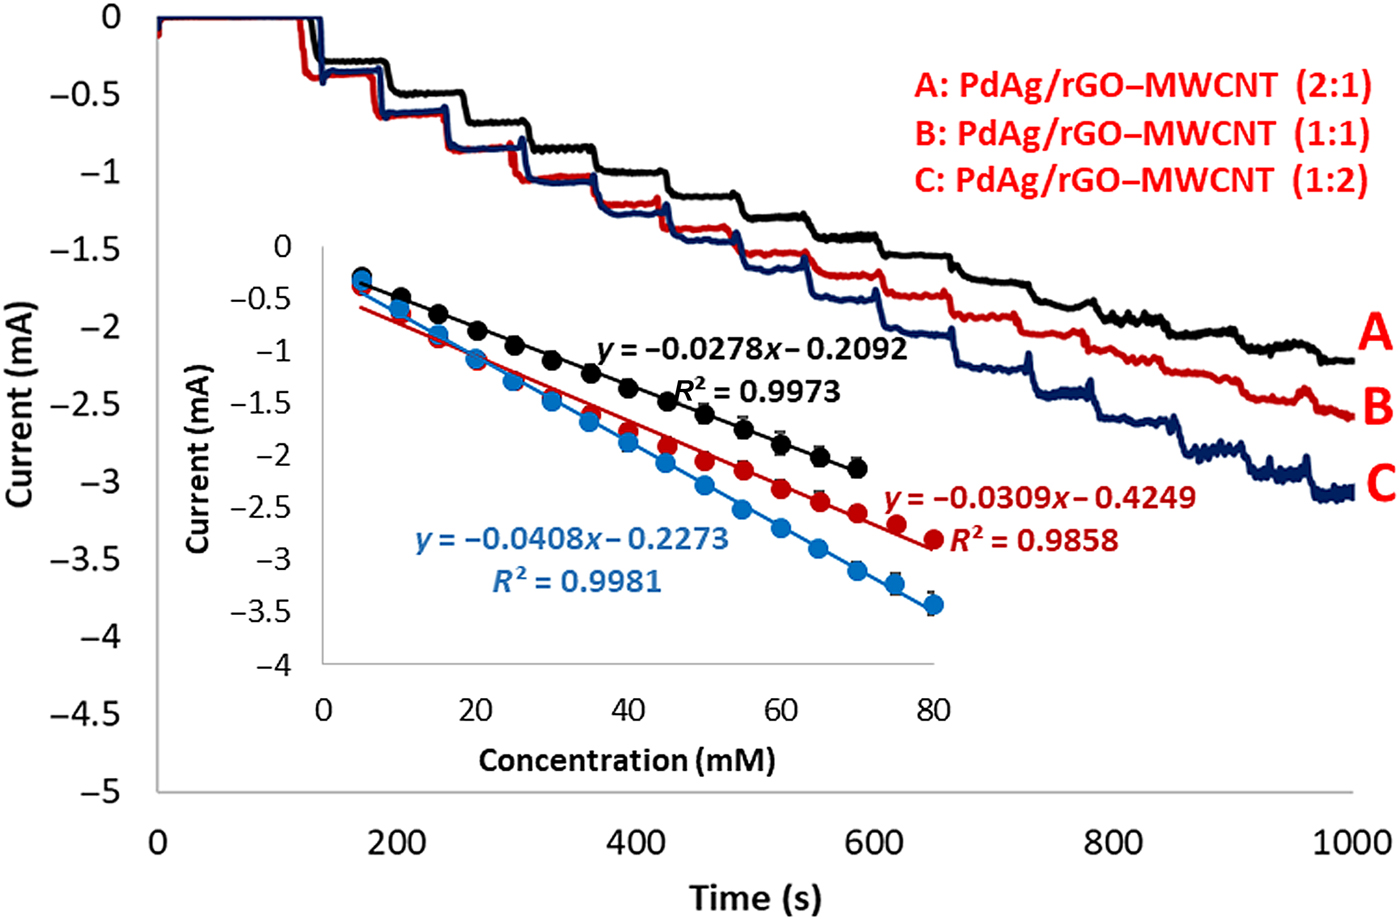
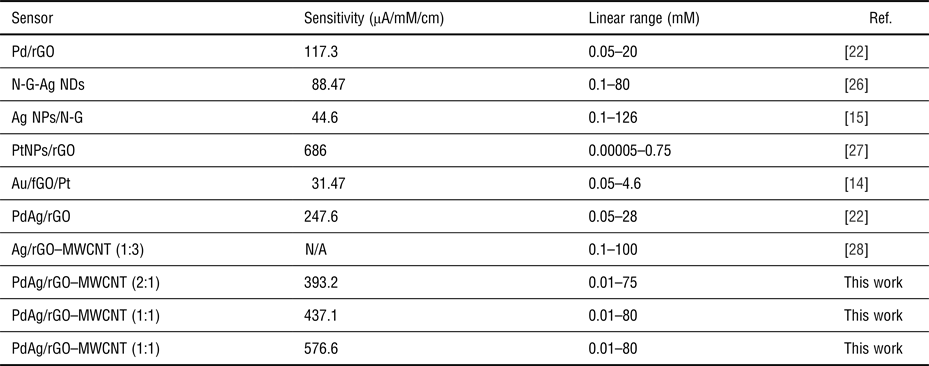
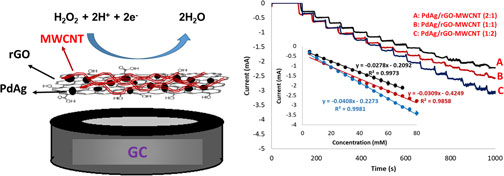
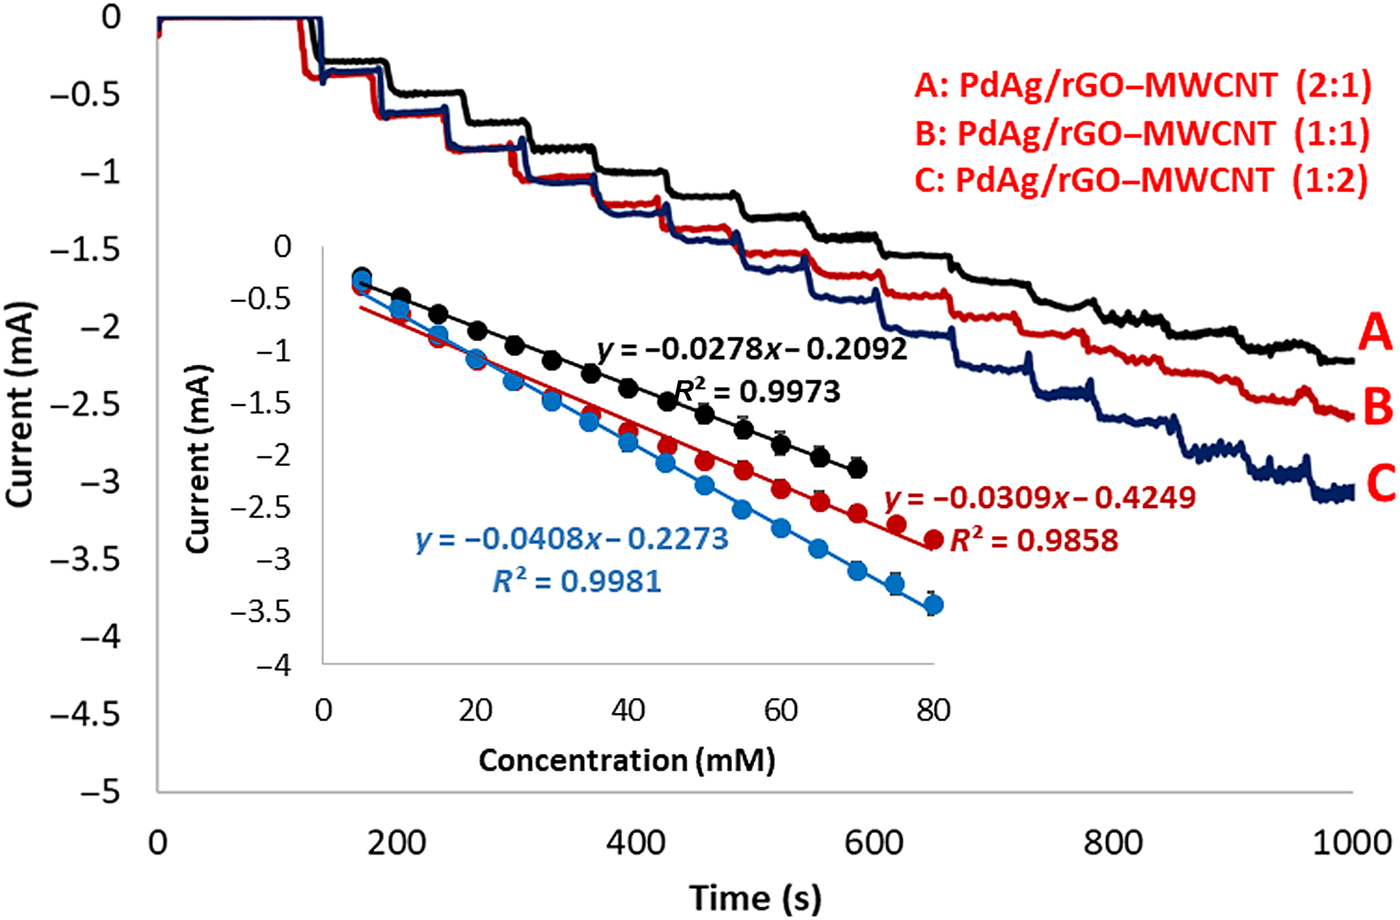
The performance of the sensors was measured by the consecutive injection of 5 mM H2O2 into the PBS solution and the results are given in Fig. 4. The i–t curves demonstrated that the increased MWCNT content in the support enhanced the analytical performance of the sensors. As seen from the inset in Fig. 4, the sensitivity of the sensors followed the order of PdAg/rGO–MWCNT (2:1) < PdAg/rGO–MWCNT (1:1) <PdAg/rGO–MWCNT (1:2). This result can be ascribed to the unique 3D structure of rGO:MWCNT nanohybrids. In this structure, the presence of MWCNT creates diffusion paths on and between rGO layers making the diffusion of the substances through the catalyst layer easier. Furthermore, the rGO and MWCNT interconnections improve the electronic conductivity. Larger electrochemical surface area of rGO:MWCNT hybrids is also responsible for the enhanced performance. The i–t curves also revealed a fast response towards the reduction of H2O2. It must be highlighted that while PdAg/rGO–MWCNT (2:1)-decorated sensor showed a linear increase in the response current up to 75 mM, the highest concentration value in the linear region was found to be 80 mM for PdAg/rGO–MWCNT (1:1) and PdAg/rGO–MWCNT (1:2). The response of the sensors toward the addition of H2O2 in different amounts is given in Fig. S5. It was proved that the sensors can be used to detect even minute amount of H2O2. As a result, it can be stated that using our novel sensor design, the level of H2O2 can be determined in a very wide concentration window. The linear range of the PdAg/rGO–MWCNT (1:2)-containing sensors was found to be between 10 µM and 80 mM. Limit of detection (LOD; s/S = 3) of the sensors were calculated as 12.4, 11.9, and 19.6 µM as a function of increasing MWCNT content in the catalyst layer. The sensitivities of the sensors were calculated as 393.2 ± 17, 437.1 ± 9, and 576.6 ± 19 µA/mM/cm2 for PdAg/rGO–MWCNT (2:1), PdAg/rGO–MWCNT (1:1), and PdAg/rGO–MWCNT (1:2), respectively. It can be concluded that by simply changing the configuration of the support material, the sensitivity of the sensors can be improved significantly. The results indicated a 50% increase in the performance depending on the MWCNT content. The reproducibility of the analytical response was confirmed by recording the response current against the addition of 5 mM H2O2 and a RSD% of 6.4 (n = 15) was obtained. In addition, the repeatability of the sensor fabrication process was evaluated using the sensitivity values of five different sensors constructed independently. The results revealed a RSD% of 5.99. To evaluate the specificity, sensor response was recorded in the presence of some of the common interferants. Figure S6 shows the i–t curve of PdAg/rGO–MWCNT (1:2)-based sensors recorded by the successive additions of 0.1 mM of H2O2, ascorbic acid (AA), uric acid (UA), and glucose. While the addition of H2O2 increased the current significantly, the introduction of interferants (AA, UA, glucose) did not yield any sensible effect. Therefore, it can be stated that the sensors showed a high selectivity towards H2O2. The analytical performance of our novel non-enzymatic electrochemical H2O2 sensor design was compared with previously published papers in Table I. It was observed that our PdAg/rGO–MWCNT (1:2)-based sensors design showed one of the highest sensitivity values of all. In addition, compared with most of the sensors listed in Table I, the use of PdAg/rGO–MWCNT hybrids enabled to achieve much wider linear range. When both sensitivity and linear range of the sensors are taken into account at the same time, our novel and simple sensor configuration showed the most optimum performance. Compared with our previous report,[Reference Uzunoglu, Song and Stanciu22] the introduction of MWCNT in the catalyst layer enhanced the performance of the sensors significantly. As summarized in Table I, while a sensitivity of 247.6 µA/mM/cm2 was obtained from PdAg/rGO-based sensors with the linear response in the range of 0.05–28 mM, the introduction of 25 wt% of MWCNT in the support resulted in a sensitivity of 393.2 µA/mM/cm2 in the range of 0.01–75 mM H2O2. Therefore, it can be stated that we successfully extended the unique properties of rGO and MWCNT in low dimensions to 3D and obtained a synergetic effect between rGO and MWCNT. Based on the obtained results it can be suggested that our novel PdAg/rGO–MWCNT-based electrochemical sensor design showed a great promise for the development of non-enzymatic electrochemical sensors. The storage stability was determined by measuring the response toward 5 mM H2O2 for 25 days and it was seen that after this period the PdAg/rGO–MWCNT (1:2)-based sensor retained 85% of its initial response.
Chronoamperometry results of the nanostructures towards the addition of 5 mM H2O2.
Comparison of the sensor performance with previously published reports.

NP, nanoparticle; ND, nanodentrite; N-G, N-doped graphene; fGO, functionalized GO.
Conclusions
Here, we reported on the construction of electrochemical H2O2 sensors by exploiting the high-catalytic activity of PdAg nanoparticles and large physical surface area of rGO–MWCNT nanohybrids. The TEM and SEM results showed the successful decoration of rGO–MWCNT nanohybrids with PdAg nanoparticles. PdAg nanoparticles were immobilized on different support materials with varying rGO:MWCNT ratios (2:1, 1:1, 1:2) to investigate the effect of MWCNT content in the catalyst layer. The sensitivities of the sensors were found to be 393.2 ± 17, 437.1 ± 9, and 576.6 ± 19 µA/mM/cm2 for PdAg/rGO–MWCNT (2:1), PdAg/rGO–MWCNT (1:1), and PdAg/rGO–MWCNT (1:2), respectively. In addition, the 3D structure and large surface area of nanohybrids allowed us to detect H2O2 in a very wide linear range (0.02–80 mM). Overall, our PdAg/rGO–MWCNT-based sensor design showed a great promise for the construction of electrochemical sensors with high sensitivity, selectivity, and wide linear range.
Supplementary Material
The supplementary material for this article can be found at https://doi.org/10.1557/mrc.2018.82
Acknowledgement
The authors acknowledge Hitit University Research Department for the financial support (FEF190001.17.008). The authors also thank Ahmet Burcin Batibay for his valuable contributions.
Conflict of Interest
The authors declare no conflict of interest.