Implications
The nutritive value of dried distillers grains and solubles (DDGS) for cattle varies considerably depending on grain type, so that the use of mean values may lead to serious imbalances in the ration. Taking account of the DDGS-type and prediction equations based on simple lab measurements enable feed compounders to evaluate more accurately the quality of each batch resulting in more correct feed formulation. This further allows the farmers to feed animals more accurately resulting in a better efficiency and less losses into the environment.
Introduction
The most important byproduct of bio-ethanol production from grains is dried distillers grains and solubles (DDGS). In the United States DDGS is mainly based on maize, whereas in Europe and Canada both wheat and maize and also grain blends are used as substrate. Through the almost complete fermentation of starch to ethanol, the other grain nutrients are enriched by a factor three. Hence, DDGS is rich in digestible fibre, fat and rumen undegradable protein, which makes it particularly appropriate for inclusion in cattle diets (Berger, Reference Berger2007). However, the nutritive value of DDGS may vary considerably depending on the grain type(s) used and also on the production process or plant (Cao et al., Reference Cao, Anderson and Kalscheur2009; Azarfar et al., Reference Azarfar, Jonker, Hettiarachchi-Gamage and Yu2012; Li et al., Reference Li, Li, Yang and Beauchemin2012). Although the efficiency of the bioethanol processes is significantly improved during the last 10 years, up-to-date information about the in vivo digestibility and energy value of DDGS is scarce. During the last years more information became available about the protein value and amino acid (AA) availability of DDGS, mainly through rumen incubation and in vitro experiments (Cao et al., Reference Cao, Anderson and Kalscheur2009; Mjoun et al., Reference Mjoun, Kalscheur, Hippen and Schingoethe2010; Nuez-Ortín and Yu, Reference Nuez-Ortín and Yu2010; Azarfar et al., Reference Azarfar, Jonker, Hettiarachchi-Gamage and Yu2012; Li et al., Reference Li, Li, Yang and Beauchemin2012; Westreicher-Kristen et al., Reference Westreicher-Kristen, Steingass and Rodehutscord2012). All these studies showed great variability in the quality of DDGS, which makes it very difficult for feed compounders to make accurate feed formulations. Inaccurate knowledge of the nutritive value of compound feeds containing DDGS or of directly purchased DDGS may lead to imbalances in cattle rations resulting in suboptimal performances and more losses into the environment. Therefore, it is important to dispose of convenient parameters enabling a fast, cheap and accurate estimation of the nutritive value of each batch of DDGS. Potential predictors of protein and AA quality are the colour scores (Cromwell et al., Reference Cromwell, Herkelman and Stahly1993; Cozannet et al., Reference Cozannet, Primot, Gady, Métayer, Lessire, Skiba and Noblet2010), acid detergent insoluble N (Cromwell et al., Reference Cromwell, Herkelman and Stahly1993) and reactive lysine (Kim et al., Reference Kim, Kil, Zhang and Stein2012).
The aim of this study was to determine the nutritive value for cattle of 13 European DDGS batches originating from different grain types and from different production plants. The energy value was derived from digestion trials with sheep, considering only small differences between sheep and cattle fed at the same feeding level, except for protein, for which a correction was made (Van Es, Reference Van Es1975).
The protein value and AA availability was obtained from nylon bag incubations in the rumen and intestines of lactating cows. Further, the prediction power of chemical, in vitro (solubility, enzymatic, rumen fluid) and colour parameters to estimate the in vivo energy and protein value was examined. Finally, the bio-availability of AAs was determined and means to predict were evaluated.
Material and methods
DDGS batches
During 2010 to 2011 13 batches of DDGS were purchased from seven production plants: Alco Bio Fuel (Belgium, n=4), Crop Energies (Germany, n=2), Tereos (France, n=2), Abengoa (The Netherlands, n=2), Abengoa (Spain, n=1), Pannonia Ethanol (Hungary, n=1) and Agrana (Austria, n=1). Three of them were based purely on wheat (WDDGS), three purely on maize (MDDGS) and seven were blends (BDDGS). The latter consisted of at least 50% wheat and further mostly maize, but also barley, triticale, sorghum and sugar syrup. All production plants fermented the whole grains after dry milling and pelleted the by-product after drying. DDGS originating from newer technology using wet fractionation were not involved in our study.
Animal experiments
The digestion trials with sheep and the incubation studies with cows were done in three series during a time-span of about 2 years with respectively four, six and three batches of DDGS. These experiments were in accordance with the Belgian law for care of experimental animals (Royal Decision 14.05.2010) and approved by the Animal Ethics Committee of ILVO.
Digestion trials with sheep and energy value
To derive the energy value, digestion trials with sheep were carried out according to CVB (1996). In each trial five mature castrated male sheep of the Texel breed were used. The animals were daily fed 1 kg dry matter (DM) equivalent of a mixture of 50% chopped grass hay and 50% DDGS in two meals. After an adaptation period of at least 10 days in metabolic crates, the faeces were individually collected and frozen during 10 days. At the end of the experimental period, faeces and eventual orts were weighed and sampled. Faeces were dried in a ventilated oven at 65°C. On a pooled sample of the feeds and the individual faeces the contents of DM, CP, crude fat (CFA), crude fibre (CF), crude ash and NDF were determined; the content of other carbohydrates (OC) was calculated by difference as 1000 – CP – CFA – CF – ash (all parameters in g/kg DM). The individual apparent digestion coefficients of organic matter (OM
d
), CP (CP
d
), CFA (CFA
d
), CF (CF
d
), OC (OC
d
) and NDF (NDF
d
) of DDGS were calculated by difference taking account of the mean digestion coefficients of the grass hay assuming no digestive interactions and were then averaged per DDGS batch. In all trials the same batch of grass hay was used and its digestibility was determined in two separate digestion trials, where hay was provided at 1 kg DM-equivalent per animal per day. After the second series of trials (data from 4+6 batches available), we found that in vivo NDF
d
of the two batches of MDDGS was considerably lower than in situ NDF-degradability after 48 h of rumen incubation in contrast with the other DDGS batches. This depression in fibre digestibility was probably due to the relatively high fat level in the diet (86 g/kg DM) of the sheep. Therefore the in vivo digestibility of the third batch of MDDGS in the third series of trials was determined in a lower (40/60) ratio to grass hay (CFA=73 g/kg DM in the diet). When data of all digestion trials were available, the in vivo NDF digestibility of the two MDDGS batches, respectively 58.1% and 53.6% was replaced by a predicted value, respectively 70.2% and 67.4%. For prediction of the in vivo digestion coefficient the best correlated chemical or in situ parameter as derived from the data of all 13 DDGS batches but two was used. Replacement of the in vivo digestion coefficient was also necessary for CF and OC, but not for CP and CFA. Both CF
d
and NDF
d
were predicted by NDF-content with a determination coefficient (R
2) of 64% and 71%, respectively and OC
d
was predicted by the degradation rate of NDF (
 $$k_{{d_{{{\rm NDF}}} }} $$
) (R
2=68%). Net energy lactation (NEL) was estimated from determined gross energy and metabolizable energy based on apparently digestible nutrients (Van Es, Reference Van Es1978).
In situ rumen incubations with cows and degradation characteristics
The rumen degradability characteristics of OM, CP and NDF of DDGS were determined with the nylon bag technique (CVB, 2004). Three lactating cows, fitted with a rumen cannula (Bar Diamond Inc., Parma, ID, USA) with an internal diameter of 10 cm, were used. The cows produced at least 15 kg of milk and were fed a basal ration consisting of grass silage and maize silage (50/50 on DM-basis) in two meals supplemented with concentrates to meet their requirements for energy and protein. Nylon bags (Sefar, Heiden, Switzerland) measuring 8×10 cm and with a pore size of 37 µm were filled with 2.5 g DM-equivalent of sample ground through a 3 mm screen and were then heat-sealed. The bags were incubated in the rumen during 3, 8, 24, 48 and 336 h. For each time, two bags per cow (six bags per feed) were incubated; for 336 h, three bags with a double sample weight were incubated per cow. Within a series, all DDGS samples were incubated simultaneously, with a maximum of 30 bags per cow at once. Besides, three bags filled with sample were not incubated in the rumen but underwent all other treatments to determine the washout fraction (W). Bags were incubated just before the morning meal. After incubation, bags with residues were immediately immersed in ice water, further rinsed under running tap water and put in the freezer (−18°C). After collection of all bags, they were machine-washed (Zanussi, Frankfurt/Main, Germany) with cold water without spin cycle and then freeze-dried. Residues from the three cows were pooled per incubation time and ground to pass a 1-mm screen (Retsch ZM-1, Haan, Germany) for analysis of moisture, ash, CP and NDF. The potentially degradable fraction (D) was calculated as 100-W-U, with U being the undegradable fraction after 336 h of incubation. The degradation rate (k
d
) of D was derived by iteration using the exponential model
 $$d(t)=W{\plus}D{\times}({\rm 1}{\minus}e^{{{\minus}k_{{d_{{{\rm xt}}} }} }} )$$
) with d(t) the disappearance at time t (Ørskov and McDonald, Reference Ørskov and McDonald1979). For CP, also the soluble fraction in water (WSCP) was determined to calculate the fraction of small but insoluble particles (W-WSCP). The percentage of rumen bypass protein (RBP) was calculated according to Van Duinkerken et al. (Reference Van Duinkerken, Blok, Bannink, Cone, Dijkstra, Van Vuuren and Tamminga2011):
RBP (%)=U+D×[6/(6+k d )]+(W-WSCP)×[8/(8+k d )]+WSCP×[11/(11+200)] with 6, 8 and 11 the rumen passage rate (%/h) of D, (W-WSCP) and WSCP, respectively.
In situ intestinal digestibility with cows
The intestinal digestibility of RBP (dRBP) was determined with the mobile nylon bag technique using two cows provided with a T-cannula (R&K Techniek, Venlo, The Netherlands) in the upper part of the duodenum. First, rumen bypass material was collected by incubation of DDGS samples during 12 h (similar procedure as described above). Of the freeze dried rumen residue 0.5 to 0.8 g was weighed in small nylon bags measuring 3×7 cm and four bags were incubated per cow (eight per feed). Immediately before insertion in the duodenum, bags were soaked in a pepsin-0.1 N HCl-solution to simulate digestion in the abomasum. Every 20 min four bags were incubated in the duodenum. After passage through the intestines, bags were recuperated from the faeces, rinsed and frozen. Then, they were intensively machine-washed using water of 40°C and spinning at 700 r.p.m. After freeze-drying, pooling per animal and grinding through 1 mm, rumen as well as intestinal residues were analysed for CP. For nine of the 13 DDGS batches the content AAs was determined on both rumen and intestinal residues.
Calculation of the protein value
The protein value was calculated according to the updated Dutch DVE/OEB system (Van Duinkerken et al., Reference Van Duinkerken, Blok, Bannink, Cone, Dijkstra, Van Vuuren and Tamminga2011). The true protein digested in the small intestine (DVE) was calculated as ARBP+AMP−ENDP with ARBP=truly absorbable bypass protein, AMP=truly absorbable microbial protein synthesized in the rumen and ENDP=endogenous protein excreted in the faeces. The degraded protein balance (OEB) gives the balance of the potential microbial synthesis based on rumen available nitrogen (MPN) and that based on rumen available energy (MPE) and was calculated as MPN−MPE.
Chemical analyses and other lab measurements
The samples of the feeds and oven-dried faeces were ground through a 1-mm screen (Wiley, Rheotec, Maarkedal, Belgium). Residual moisture was determined by drying at 103°C (EC, 1971b). Crude ash was obtained by incineration at 550°C (ISO, 2002). CP (N×6.25) was determined according to Kjeldahl (ISO, 2005). CF was extracted with petroleum-ether after hydrolysis with HCl (ISO, 1999). Crude fibre was obtained with the Ankom Fiber Analyser (Ankom Technology, Macedon, NY, USA) after boiling subsequently with sulphuric acid and sodium hydroxide (EC, 1992). NDF was determined with the Ankom Fiber Analyser using α-amylase and sodium sulphite and expressed on ash-free basis (Van Soest et al., Reference Van Soest, Robertson and Lewis1991). The DDGS samples were more extensively analysed. ADF was determined with the Ankom Fiber Analyser and expressed exclusive ash; the residue was then treated with sulphuric acid to obtain ADL (Van Soest et al., Reference Van Soest, Robertson and Lewis1991). Hemicellulose and cellulose were calculated by difference from NDF−ADF and from ADF−ADL, respectively. By N-analysis of the AD-residue, acid detergent insoluble CP (ADICP) was obtained. Starch (STA) was determined after autoclaving and hydrolysis with amyloglucosidase (NEN, 1974). Sugars (SUG) were extracted with 40% ethanol and analysed according to the Luff Schoorl method (EC, 1971a). Gross energy was determined with a bomb calorimeter (ISO, 1998). In vitro OM digestibility was determined either with an enzymatic method (
 $${\rm OM}_{{d_{{{\rm enz}}} }} $$
; De Boever et al., Reference De Boever, Cottyn, Buysse, Wainman and Vanacker1986) or with buffered rumen fluid (
 $${\rm OM}_{{d_{{{\rm rf}}} }} $$
; Tilley and Terry, Reference Tilley and Terry1963). The solubility of CP in 0.1 M borate-phosphate buffer (BSCP) was measured by incubating samples equivalent to 200 mg CP during 1 h at pH 6.7 and 40°C (Cone et al., Reference Cone, Van Gelder and Van Vuuren1995). Using the same buffer to which a bacterial protease from Streptomyces griseus (type XIV; Sigma P-5147, St. Louis, MO, USA) was added, CP degradability was determined after 1, 6 and 24 h of incubation (SG1DCP, SG6DCP, SG24DCP) according to Cone et al. (Reference Cone, Van Gelder and Van Vuuren1995). The solubility of CP was also determined in a pepsin-HCl solution (PHSCP) (EC, 1999). The degree of lightness (L*), redness (a*) and yellowness (b*) was scored with a Hunterlab Miniscan EZ (Elscolab, Kruibeke, Belgium). The AAs (exclusive thyrosine) were obtained with HPLC after acid hydrolysis (EC, 1998) and tryptophan after alkaline hydrolysis (EC, 2000). Reactive lysine was determined according to Moughan and Rutherfurd (Reference Moughan and Rutherfurd1996).
Analysis of measured and calculated data
Data were analysed by one-way ANOVA using Statistica 11.0 (Stat Soft Inc., Tulsa, OK, USA) to account for grain substrate as a fixed effect; the model used was Y ij =µ+GS i +e ij ; Y ij was an observation of the dependent variable ij; µ was the population mean for the variable; GS i was the effect of the grain substrate, as a fixed effect and batch as replications and e ij was the random error associated with the observation ij.
The series was not taken into account, because mean apparent digestion coefficients obtained with at least four sheep (CVB, 1996) as well as in situ degradation parameters determined on pooled residues from at least three cows (CVB, 2004) are considered to be sufficiently reproducible. Differences between treatments were declared at P<0.05 and means were compared using the Fisher least square difference test.
Development of predictive models
Equations to predict NEL (MJ/kg DM), RBP (%), dRBP (%), AMP (g/kg DM) and OEB (g/kg DM) were derived by multiple regression analysis according to the model: Y=a+b
1
x
1+b
2
x
2+···+b
n
x
n
. Only regressions with variables significantly (P<0.05) contributing to explain the variance in Y and which were not intercorrelated (P>0.05) were considered. Regressions were evaluated by the adjusted determination coefficient (R
2) and the standard error of estimate (s.e.e.). For NEL, the compositional data,
 $${\rm OM}_{{d_{{{\rm enz}}} }} $$
,
 $${\rm OM}_{{d_{{{\rm rf}}} }} $$
and the colour parameters were used as independent variables. For RBP, dRBP, AMP and OEB additional parameters were evaluated: ADICP and the in vitro protein methods WSCP, BSCP, SG1DCP, SG6DCP, SG24DCP and PHSCP.
Finally, the linear relationship between the percentage RBP after 12 h of rumen incubation and that of the individual AAs as well as between the intestinal digestibility of the bypass CP and that of individual AAs was calculated for nine out of the 13 DDGS.
Results
Chemical composition and lab measurements
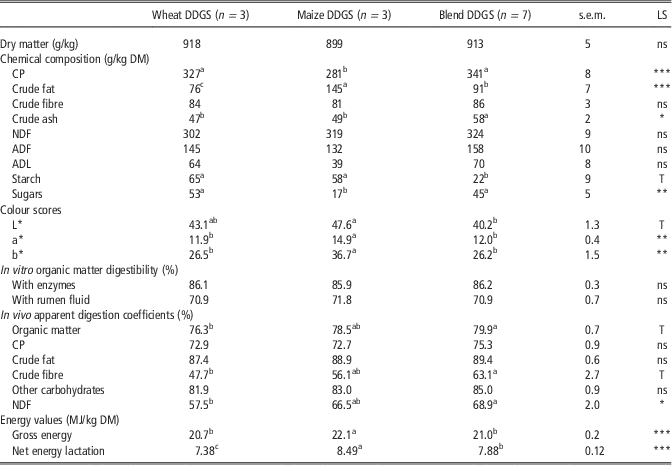
The DM content of DDGS was relatively high with an overall mean value of 910 g/kg (Table 1). DDGS is composed of about one-third CP, one-third cell walls and the rest consists mainly of CF, starch, sugars and ash. The chemical composition of the three DDGS types differed significantly (P<0.05) for some parameters. MDDGS contained clearly more CFA and GE, but less CP and SUG than wheat and blend DDGS. BDDGS in its turn contained more CFA than WDDGS and compared with both pure grain DDGS, had a higher ash and a lower STA content. None of the fibre parameters was affected by grain type. Also, in vitro digestibility with either enzymes or rumen fluid was similar among DDGS types. As to the colour scores, MDDGS showed higher a* and b* values than both BDDGS and WDDGS, the latter having similar values. MDDGS and WDDGS had a higher L* value than BDDGS. The most variable parameters among DDGS batches were STA, ADL and SUG.
Chemical composition, colour parameters, digestibility and energy value of dried distillers grains and solubles (DDGS)
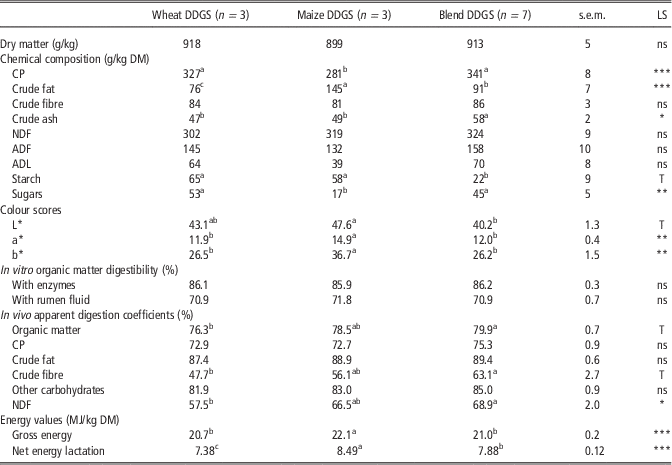
LS=level of significance of the effect of substrate type: ns=non-significant (P>0.1); T=tendency (0.1>P>0.05).
a,b,cMeans within a row with a different superscript are significantly different (P<0.05).
*P<0.05, **P<0.01, ***P<0.001.
Apparent in vivo digestion coefficients and net energy value
The in vivo digestibility of OM was best correlated with OC d (r=0.84), followed by CF d (0.68). BDDGS tended to be better digestible for OM (P=0.095), CF (P=0.059) and NDF (P<0.05) than WDDGS, with values for MDDGS in between (Table 1). The apparent digestion coefficients of CP, CFA and OC were similar among DDGS types with an overall mean value of 74.1%, 88.8% and 83.8%, respectively. The variability between DDGS batches was particularly high for CF d and NDF d . The NEL of MDDGS was higher than that of BDDGS, which was in its turn higher than that of WDDGS.
Rumen degradation of OM, CP and NDF
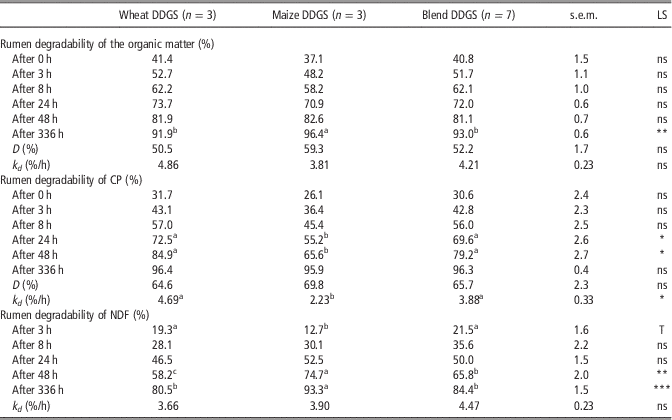
The degradation of the OM during the first 2 days of rumen incubation did not differ among DDGS types with an overall mean value of 40.1%, 51.1%, 61.2%, 72.1% and 81.6% after 0, 3, 8, 24 and 48 h, respectively (Table 2). After the prolonged incubation of 12 days more OM was degraded from MDDGS than from BDDGS and WDDGS (P<0.01). The potentially degradable fraction nor the degradation rate of OM were affected by DDGS type (P>0.05). The CP of MDDGS was less degraded in the rumen than that of BDDGS and WDDGS up to 48 h of incubation, which was also reflected in the lower degradation rate. However after 12 days of rumen incubation, CP degradation of all DDGS types was similar with a mean value of 96.2%. The D-fraction of CP was not affected by DDGS type. The degradation of cell walls after 3 h of incubation tended to be lowest for MDDGS, but with longer incubation degradation of MDDGS fibres increased faster than for the other DDGS types and after both 48 and 336 h of incubation degradation of MDDGS was higher than for the other types. The global degradation rate of NDF did not differ significantly among DDGS types.
Rumen degradability of organic matter, CP and NDF in dried distillers grains and solubles (DDGS)
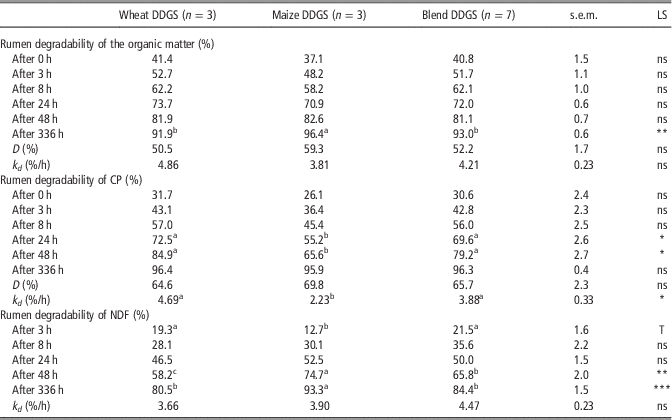
LS=level of significance of the effect of substrate type: ns=non-significant (P>0.1), T=tendency (0.1>P>0.05); D=potentially degradable fraction; k d =degradation rate of D.
a,b,cMeans within a row with a different superscript are significantly different (P<0.05).
*P<0.05, **P<0.01, ***P<0.001.
In situ and in vitro protein values
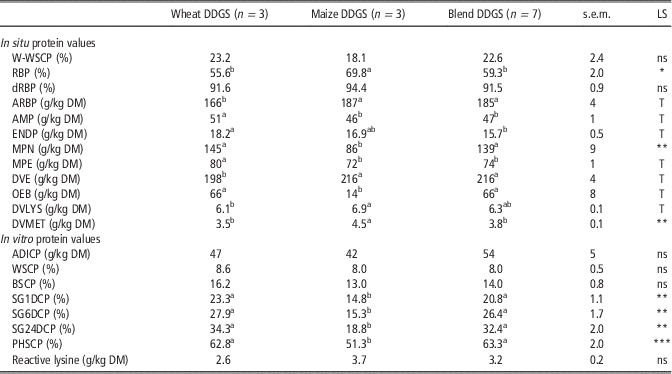
On average somewhat more than 20% of CP in DDGS is present in small but insoluble particles (Table 3). The RBP of MDDGS was significantly higher than that of the other DDGS types (69.8% v. 58.2%). The dRBP was not affected by DDGS type and was fairly high, on average 92%. The content of ARBP tended to be higher for maize and blend DDGS than for WDDGS (about 20 g/kg DM). WDDGS contained 4 to 5 g AMP more per kg DM than the other two types, but also more ENDP. The DVE of MDDGS and BDDGS tended to be higher than that of WDDGS (216 v. 198 g/kg DM). MDDGS provided clearly less MPN than the other types (86% v. 141 g/kg DM), whereas the provision of MPE tended to be lower for both MDDGS and BDDGS than for WDDGS (73 v. 80 g/kg DM). As a result, the OEB of MDDGS tended to be lower than that of BDDGS and WDDGS (14 v. 66 g/kg DM). The variability was very high for OEB as well as for MPN.
In situ and in vitro protein values of dried distillers grains and solubles (DDGS)
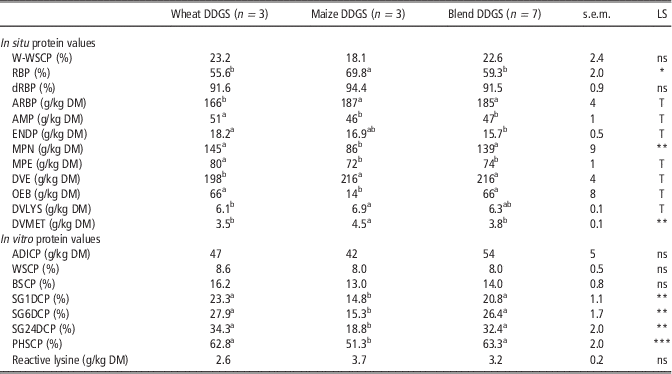
LS=level of significance of the effect of substrate type: ns=non-significant (P>0.1), T=tendency (0.1>P>0.05); W-WSCP=fraction of small particles; RBP=rumen bypass protein; dRBP=intestinal digestibility of RBP; ARBP=absorbable RBP; AMP=absorbable microbial protein; ENDP=endogenous protein losses; MPN=microbial protein based on rumen available nitrogen; MPE=microbial protein based on rumen available energy; DVE=true protein digested in the intestines; OEB=degraded protein balance; DVLYS=lysine digested in the intestines; DVMET=methionine digested in the intestines; ADICP=acid detergent insoluble CP; WSCP=CP-solubility in water; BSCP=CP-solubility in borate-phosphate buffer; SG1DCP, SG6DCP and SG24DCP=CP-degradability in Streptomyces griseus after 1, 6 and 24 h incubation, respectively; PHSCP=CP-solubility in pepsin-HCl.
a,b,cMeans within a row with a different superscript are significantly different (P<0.05).
*P<0.05, **P<0.01, ***P<0.001.
The portion of ADICP in total CP amounted on average to 15% and was highly variable. The solubility of CP differed considerably depending on the method used. Compared to water, solubility in borate-phosphate buffer was double as high, whereas solubility in pepsin-HCl was five to six times higher. Adding protease to the buffer further increased solubility. No differences among DDGS types were observed for ADICP, WSCP and BSCP. For the other in vitro methods MDDGS showed lower values than both BDDGS and WDDGS.
AA composition
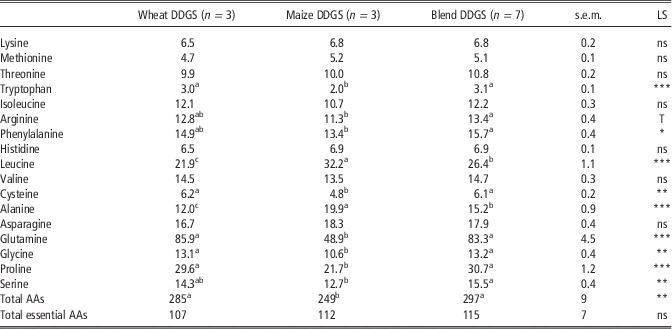
MDDGS contained less AAs than both BDDGS and WDDGS (249 v. 291 g/kg DM), but the content of essential AAs was similar with an average value of 111 g/kg DM (Table 4). The content of some AAs was affected by DDGS type. The AA composition of BDDGS was similar to that of WDDGS with exception of a higher leucine and alanine content. Compared to WDDGS and BDDGS, MDDGS contained less tryptophan, arginine, phenylalanine, cysteine, glutamine, glycine, proline and serine and more leucine and alanine. The most variable AAs were glutamine, alanine, tryptophan and proline. The reactive lysine content was also very variable, clearly more than lysine content. The ratio of reactive lysine to lysine amounted to 39%, 54% and 47% for WDDGS, MDDGS and BDDGS, respectively.
Amino acid (AA) composition (g/kg DM) of dried distillers grains and solubles (DDGS)
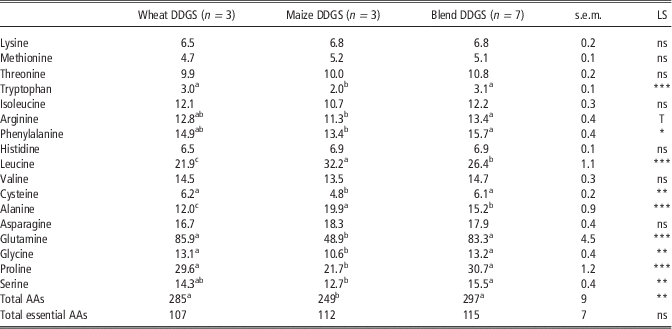
LS=level of significance of the effect of substrate type: ns=non-significant (P>0.1), T=tendency (0.1>P>0.05).
a,b,cMeans within a row with a different superscript are significantly different (P<0.05).
*P<0.05, **P<0.01, ***P<0.001.
Prediction of the energy and protein value
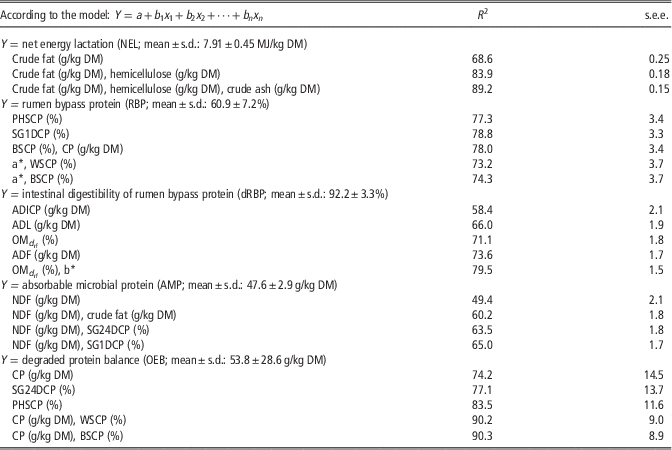
The best correlating parameters were regressed on the energy and protein value and the determination coefficient (R
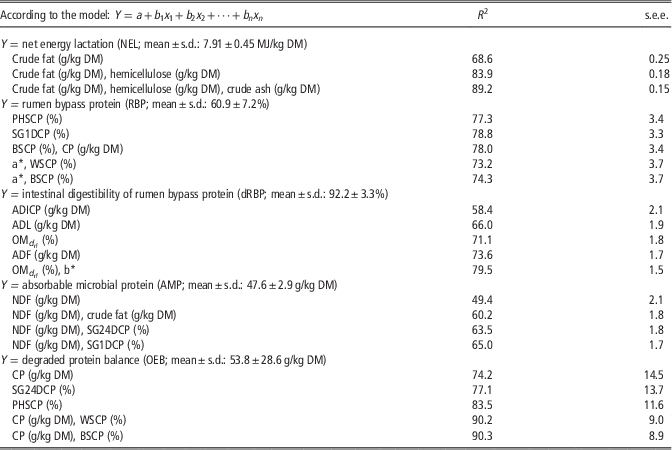
2) and the s.e.e. were calculated (Table 5). Further, multiple regression analysis was carried out to find good combinations of parameters. For NEL, CFA content showed the highest correlation of the studied parameters with a determination coefficient of 68.6%. The prediction power of CFA could be improved when combined with hemicellulose and further with crude ash as third parameter explaining 89.2% of the variation in NEL. For RBP, the prediction power of PHSCP and SG1DCP was similar, explaining respectively 77.3% and 78.8% of the variation. Combining two parameters could not improve the prediction power for RBP. Correlations for dRBP increased from ADICP over ADL and
 $${\rm OM}_{{d_{{{\rm rf}}} }} $$
to ADF, the latter with a R
2 of 73.6%. Most of the variation in dRBP (79.5%) could be explained by combining
 $${\rm OM}_{{d_{{{\rm rf}}} }} $$
and the b* value. Correlations for the content of AMP were rather low and the highest value was found for NDF (R
2=49.4%). Prediction with NDF can be improved by combination with either CFA, SG24DCP or SG1DCP, explaining up to 65% of the variation. For OEB high correlations were obtained, increasing from CP over SG24DCP to PHSCP, the latter explaining 83.5% of the variation. When CP is combined with either WSCP or BSCP, R
2 reaches 90%.
Independent variables (X) to predict the energy and protein value (Y) of dried distillers grains and solubles (DDGS, n=13) and their accuracy
 $${\rm OM}_{{d_{{{\rm rf}}} }} $$
=in vitro organic matter digestibility with rumen fluid; ADICP=acid detergent insoluble CP; WSCP=CP-solubility in water; BSCP=CP-solubility in borate-phosphate buffer; SG1DCP and SG24DCP=CP-degradability in Streptomyces griseus after 1 and 24 h incubation, respectively; PHSCP=CP-solubility in pepsin-HCl.
Rumen bypass and intestinal digestibility of AAs
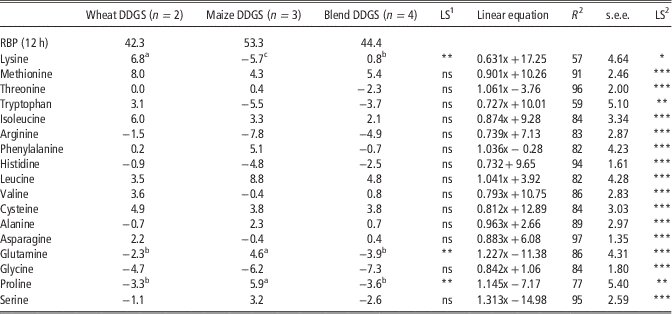
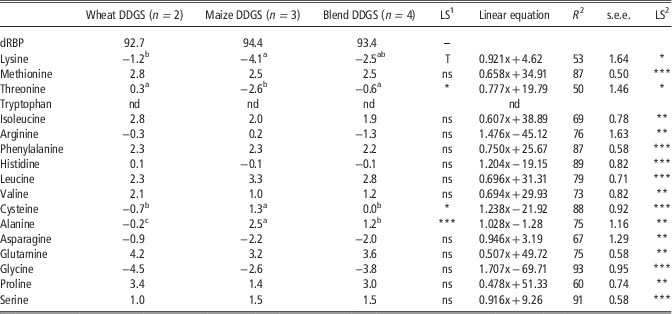
It has to remarked that the bypass-values of CP obtained after 12 h of rumen incubation (Table 6) are more than 10% lower than the calculated RBP-values (Table 3), so the bypass-values of the AAs should be considered as relative values. In accordance with RBP, rumen bypass of most AAs was higher for MDDGS than for BDDGS and WDDGS (Table 6). Compared to RBP, the bypass values were generally higher for methionine, isoleucine, leucine and cysteine and lower for arginine, histidine and glycine. However, rumen bypass of lysine was higher for WDDGS and lower for MDDGS, whereas glutamine and proline showed the reverse trend. Rumen bypass of most AAs was highly significantly (P<0.001) related to RBP after 12 h of incubation. The relationship was weakest (P<0.05) in the case of lysine. In accordance with dRBP, the intestinal digestibility of most AAs was similar among DDGS-types (Table 7). Compared to dRBP, the values were generally higher for methionine, isoleucine, phenylalanine, leucine, valine, glutamine and proline and lower for lysine, asparagine and glycine. However, the value of alanine and cysteine was higher for MDDGS and lower for WDDGS. The relationship between the intestinal digestibility of bypass protein and that of the AAs was high (P<0.01) to very high (P<0.001), with exception of lysine and threonine for which a rather weak but still significant relation was found.
Bypass of CP (RBP) after 12 h of rumen incubation and difference with bypass of individual amino acids (RBAA−RBP in %) and linear relationships between RBAA and RBP (RBAA=a×RBP+b) for dried distillers grains and solubles (DDGS)

LS1=level of significance of the effect of DDGS type: ns=non-significant (P>0.1), T=tendency (0.1>P>0.05).
LS2=Level of significance of linear relationship.
a,b,cMeans within a row with a different superscript are significantly different (P<0.05).
*P<0.05, **P<0.01, ***P<0.001.
Intestinal digestibility of bypass protein (dRBP) and difference with intestinal digestibility of amino acids (dRBAA−dRBP in %) and linear relationships between dRBAA and dRBP (dRBAA=a×dRBP+b) for dried distillers grains and solubles
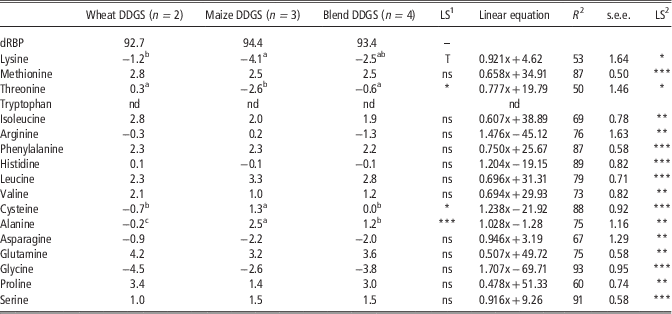
LS1=level of significance of the effect of DDGS type: ns=non-significant (P>0.1), T=tendency (0.1>P>0.05), nd=not determined.
LS2=level of significance of linear relationship.
a,b,cMeans within a row with a different superscript are significantly different (P<0.05).
*P<0.05, **P<0.01, ***P<0.001.
Discussion
Chemical composition, digestibility and energy value
The differences in chemical composition between the DDGS types reflect the composition of the starting material with maize containing more CFA and less CP than wheat (Table 1). The nutrient composition of the three types of DDGS agrees fairly well with that mentioned by Westreicher-Kristen et al. (Reference Westreicher-Kristen, Steingass and Rodehutscord2012) for three maize, five wheat and four blend DDGS, with exception of the almost 10% lower NDF-content in our study. In contrast with their NDF-procedure, we apply defatting and add sodium sulphite in order to avoid overestimation by fat and protein. Cozannet et al. (Reference Cozannet, Primot, Gady, Métayer, Lessire, Skiba and Noblet2010) obtained for 10 batches of wheat DDGS on average a similar ash and CF content, but a higher CP (361 g/kg DM) and a lower CFA content (46 g/kg DM) than in our study. The lower CFA content in the French study may be explained by the fat extraction without pre-hydrolysis. In a preliminary study we found for 11 wheat-based DDGS a mean CFA content of 87 and 54 g/kg DM with and without pre-hydrolysis, respectively. Further, the GE content, calculated from the Weende components (Schiemann et al., Reference Schiemann, Nehring, Hoffmann, Jentsch and Chudy1971), was much closer to the determined value (21.2 MJ/kg DM), when using CFA obtained after pre-hydrolysis than without (20.6 and 19.9 MJ/kg DM, respectively) and it was also somewhat better related (r=0.98 v. 0.96). The main component of DDGS cell walls is hemicellulose, contributing double as much as cellulose. Lignin is also not negligible, but its content is confounded by the presence of variable amounts of fibre-bound protein (ADICP). For 11 out of the 13 batches STA content in DDGS was below 50 g/kg DM, proving that the fermentation process is very efficient; this was obviously not the case for one batch of WDDGS with a STA content of 129 g/kg DM. The differences in colour scores between DDGS types clearly reflect the colour of the original grain.
The higher digestibility of NDF as compared with CF can be explained by the fact that the former comprises hemicellulose and cellulose and the latter mainly represents cellulose. It is unclear why the cell walls from BDDGS and MDDGS were better digested than those from WDDGS, as both the content and the composition were similar. The level of in vivo digested NDF corresponded best with NDF degradability after 48 h of rumen incubation (Table 2). The greatest deviation was observed for MDDGS with NDF
d
some 8% lower than
 $${\rm NDF}_{{d_{{{\rm 48}}} }} $$
.
Compared to in vivo OM
d
, the
 $${\rm OM}_{{d_{{{\rm enz}}} }} $$
had a similar level but showed less variation, whereas the level of
 $${\rm OM}_{{d_{{{\rm rf}}} }} $$
was considerably lower but with a similar variability. MDDGS contained clearly more net energy than WDDGS with values for BDDGS in between. The NEL-value reflects more the differences in CFA content than those in digestibility, because of the higher caloric value of fat. The Dutch Feed Tables (CVB, 2011) mention a NEL-value for wheat and maize grain of 8.17 and 8.73 MJ/kg DM, respectively, which means that the energy value of the by-product amounts to 90% and 97% of the value of the intact grain. In the literature only net energy values for recently produced DDGS based on in vitro or in situ studies are available. Nuez-Ortin and Yu (Reference Nuez-Ortin and Yu2009 and Reference Nuez-Ortín and Yu2011) calculated NEL from truly digestible nutrients with the digestion coefficients obtained by nylon bag incubations in the rumen during 48 h and found mean values of 8.28, 9.62 and 8.74 MJ/kg DM for wheat (n=5), maize (n=3) and blend (n=3) DDGS, respectively. Westreicher-Kristen et al. (Reference Westreicher-Kristen, Steingass and Rodehutscord2012) estimated NEL from in vitro gas production and found mean values of 7.18, 7.63 and 7.50 MJ/kg DM for wheat, maize and blend DDGS, respectively. The mean NEL values for the three DDGS types in our study are in between those two studies. Hence, there seems to be a big difference in NEL depending on the method of estimation.
Rumen degradation of nutrients, protein value and AAs
The main effects of grain type on rumen degradation characteristics were the slower degradation of CP and the lower undegradable fraction of NDF and OM for maize DDGS as compared with the other two types of DDGS (Table 2). Similar effects were observed by Nuez-Ortin and Yu (Reference Nuez-Ortin and Yu2009) and Li et al. (Reference Li, Li, Yang and Beauchemin2012). The slower degradation of maize than of wheat protein can be explained by the different nature of the protein components, particularly zeins in the former and gliadins in the latter (Fahmy et al., Reference Fahmy, Aufrère, Graviou, Demarquilly and El-Shazly1991). This resulted in a more than 10% higher RBP as compared with the other DDGS types (Table 3). The general high rumen bypass value for DDGS as compared with that of the grain is explained by the reduction of the protein amide I to amide II ratio during fermentation and drying (Li et al., Reference Li, Li, Yang and Beauchemin2012). Our RBP-values for maize and wheat DDGS are similar to those of Nuez-Ortín and Yu (Reference Nuez-Ortín and Yu2010), who obtained on average 66.1% and 54.4%, respectively and correspond relatively with those of Westreicher-Kristen et al. (Reference Westreicher-Kristen, Steingass and Rodehutscord2012), who found on average 61.3% and 41.2%. Despite the low undegradable fraction, the degradation of NDF from MDDGS started slower than that of the other types. This may be explained by the high fat content of MDDGS, which may have depressed degradation of cell walls inside the nylon bags during the first hours of incubation.
In our study intestinal digestibility of RBP was determined by incubating small nylon bags with residual material after 12 h of rumen incubation in the duodenum and collection of the bags in the faeces. This is considered as the reference method for determining dRBP in the Dutch protein system (Van Duinkerken et al., Reference Van Duinkerken, Blok, Bannink, Cone, Dijkstra, Van Vuuren and Tamminga2011). No other recent studies with DDGS were found where this in situ technique was used and mostly a three-step in vitro procedure with pepsin and pancreatin was applied (Mjoun et al., Reference Mjoun, Kalscheur, Hippen and Schingoethe2010; Nuez-Ortín and Yu, Reference Nuez-Ortín and Yu2010; Li et al., Reference Li, Li, Yang and Beauchemin2012). Nuez-Ortín and Yu (Reference Nuez-Ortín and Yu2010), who obtained similar RBP-values as in our study, estimated a mean dRBP of 81.3%, 82.5% and 93.9% for wheat, maize and blend DDGS, respectively, thus some 10% lower than our values for WDDGS and MDDGS, but surprisingly a similar value for BDDGS. Despite a lower CP-content, maize and blend DDGS provided more ARBP and also more DVE than WDDGS, because of the higher RBP. Nuez-Ortín and Yu (Reference Nuez-Ortín and Yu2010) also calculated the protein value according to the Dutch protein system, but used the old version (Tamminga et al., Reference Tamminga, Van Straalen, Subnel, Meijer, Steg, Wever and Blok1994). Compared with our values, they obtained appreciably higher mean DVE-values of 249, 251 and 281 g/kg DM for WDDGS, MDDGS and BDDGS, respectively. The difference may partly be explained by the calculation method and partly by an underestimation of endogenous protein losses in their study. On the other hand, Nuez-Ortín and Yu (Reference Nuez-Ortín and Yu2010) obtained, compared with our values, very similar OEB-values of 72, 11 and 55 g/kg DM for WDDGS, MDDGS and BDDGS, respectively.
In correspondence with CP-content, the total AA content was higher in BDDGS and WDDGS than in MDDGS, but the total content of essential AAs was similar among DDGS types (Table 4). The proportion of AAs (without tyrosine) in CP was not affected by DDGS type with an overall mean of 87.6%. This is lower than the ratio of total AAs/CP in intact wheat (93.4%) and maize (90.6%) according to the Dutch Feed tables (CVB, 2011). Our results are in contrast with Li et al. (Reference Li, Li, Yang and Beauchemin2012), who found a higher ratio of EAAs/CP in WDDGS than in MDDGS and a similar ratio of AAs to CP in DDGS as compared with the intact grain. The differences in AAs among DDGS types are mainly related to the substrate, with MDDGS having more leucine and alanine and WDDGS containing more tryptophan, glutamine and proline. The other differences may be ascribed to the fermentation and drying process. Considering the ratio of individual AAs to CP, a reduction in WDDGS of more than 10% in relation to the intact grain was observed for lysine (72.1%), tryptophan (78.6%), arginine (85.1%), histidine (87.5%) and cysteine (87.6%) and in MDDGS for cysteine (77.2%), histidine (81.5%), lysine (83.4%), arginine (85.6%), proline (86.8%) and methionine (88.9%). On the other hand, an increase of more than 5% was found for isoleucine (111.0%) and threonine (105.7%) in WDDGS and for isoleucine (112.6%) in MDDGS. The changes in the relative proportions of AAs can be ascribed partly to the denaturation of heat-labile AAs during fermentation and drying and partly to the contribution of yeast protein. During heating lysine is bound in Maillard products and also cysteine may be partially destroyed (Cromwell et al., Reference Cromwell, Herkelman and Stahly1993). According to Han and Liu (Reference Han and Liu2010) yeast protein could contribute up to 200 g/kg of the protein in DDGS.
Prediction of the energy and protein value and availability of AAs
Considering the great variation in quality of DDGS and the negative repercussions of an incorrect nutritive value, an accurate estimation of the energy and protein value of each DDGS batch is required. Therefore, in our study besides the classic chemical parameters additional chemical, physical and in vitro parameters were determined. It is rather evident that fat content is a convenient predictor of the energy value. The use of hemicellulose as supplemental variable to predict NEL is less obvious, as it is obtained as the difference between two parameters NDF and ADF, with particularly for the former a low reproducibility due to the existence of different procedures. For RBP, CP-solubility in pepsin-HCl seems more convenient and reproducible than CP-degradability in protease during 1 h. For dRBP, ADF appeared a better predictor than ADL and ADICP. To predict the content of AMP, the contents of NDF and CFA are a good combination. For the OEB-value, CP-content already gives a good indication, but solubility in either water, buffer solution or pepsin-HCl explains clearly more of the variation.
Concerning the colour parameters, which are fast and easy measurable, a positive correlation was found between the b*-value (yellowness) and dRBP. This relationship seems very logic as a darker colour presumes more heating and more heat-damage. However, in the relationship over DDGS-types the tendency for a higher dRBP of maize DDGS than of WDDGS is intensified by the intrinsic colour of the grain types. When considering the separate DDGS-types, the positive relation between b* and dRBP was confirmed for blend and wheat DDGS, whereas there was hardly any difference in dRBP among maize-DDGS.
For most AAs the rumen degradation of the three DDGS-types followed the degradation pattern of CP albeit with a shift in level, with exception for lysine, glutamine and proline. These results do not agree with Van Duinkerken and Blok (Reference Van Duinkerken and Blok1998), who did not find differences in rumen degradation between individual AAs and CP for a series of concentrate ingredients. Further, their conclusion that intestinal digestibility of bypass lysine is similar to that of RBP does not agree with our finding of a lower lysine digestibility, whereas the higher digestibility of bypass methionine than of RBP was confirmed in our study. The results in Tables 6 and 7 show that the availability of most AAs can be estimated from RBP and dRBP. The linear relationships were least accurate for lysine, the most critical AA in DDGS. However it appeared that the truly absorbable bypass lysine content (ARBLys) calculated from the RBLys and dRBLys estimated from RBP and dRBP using the linear equations in Tables 6 and 7 was highly related with the value based on the determined RBLys and dRBLys (R 2=96%). This was far better than the variation explained by the reactive lysine content (R 2=38%), whereas no significant relationship was found with lysine or CP-content nor with any of the colour values.
It should be remarked that the models to predict the nutritive value of DDGS derived in our study are only applicable to batches originating from the fermentation of whole grains after dry milling, which fall within the nutrient limits of the database used.
Conclusions
This study shows the large variation in energy and protein value of DDGS depending on grain type. When formulating feeds or diets, it is necessary to use separate values for wheat and maize DDGS and in the case of blend DDGS, knowledge of the grain mixture is required. For a more accurate estimation of the nutritive value, it is recommended to analyse CP, CFA, NDF and ADF in each batch. Colour-scores could be used for control of between batch variations in protein quality within plants.
Acknowledgements
The authors want to thank the Agency for Innovation by Science and Technology (IWT, Flanders, Belgium) for the financial support of this project.