
I. INTRODUCTION
With the aim of promoting sustainable development, substantial effort has been dedicated to environmentally friendly energy sources to reduce both the emission of greenhouse gases and hazardous substances, and mitigate energy dependence on dwindling fossil fuel supplies.Reference Wang, Yang, Stubbs, Li and He1 Renewable electrical energy is a clean, highly efficient, and convenient secondary energy source that has been increasingly used in many electricity sectors worldwide.Reference Zipp2 Electrical energy generated from renewable resources, such as wind energy, solar energy, and hydropower can effectively solve the abovementioned problems.Reference Laslett, Carter, Creagh and Jennings3 Energy storage technology is particularly important in the process of energy utilization,Reference Jiang, Sui, Qi, Chang, He, Meng, Wei, Sun and Jin4 and in this regard, supercapacitors have been widely investigated in recent years.Reference Zhou, Zhang, Xing, Yu, Han, Si and Zhuo5 Supercapacitors, also known as electric double-layer capacitors, utilize the adsorption of electrolyte ions during energy storage. During the release of energy, a similar process involving the desorption of electrolyte ions previously adsorbed onto the surface of the electrode occurs; this is a reversible electrostatic surface charging process.Reference Zhang and Zhao6 Therefore, supercapacitors are characterized by high charge/discharge rates,Reference Zhao, Ran, He, Huang, Liu, Liu, Tang, Zhang, Gao and Gao7 high power densities,Reference Miao, Duan, Liu, Lu, Zhu, Chen, Li and Gan8 and long cycle lifetimes.Reference Cakici, Reddy and Alonso-Marroquin9
The electrode is an important part of a supercapacitor and can greatly impact the performance of these devices.Reference Xing, Huang, Chen, Zhang and Xu10 Carbon electrode materials have drawn significant attention owing to their high specific surface area, good conductivity, and excellent chemical stability.Reference Xie, Sun, Su, Guo, Kong, Li, Huang, Wan, Song, Li, Lv and Chen11,Reference Zheng and Gao12 These materials include activated carbons, carbon aerogels, and carbon nanotubesReference Szczureka, Jurewicz, Amaral-Labat, Fierro, Pizzi and Celzard13 that have been widely utilized as electrode materials in supercapacitors. Among all carbon materials, hierarchical porous carbons with a high specific surface area and abundant porosity are promising electrode materials.Reference Zhang, Jiang, Wang, Zhang and Liu14 However, the energy density of supercapacitors is currently significantly lower than that of batteries, which limits their wide application.Reference Zhu, Wu, Ge, Zhang, Li and Li15 Based on the electrical double-layer charge-storage mechanism of supercapacitors, not all the pores are electrochemically accessible. Since the movement of electrolyte ions is determined by pore size, the supercapacitor performance can be directly attributed to the pore size within the material.Reference Huang, Peng, Liu, Zhao, Chen and Yu16 There is still plenty of room for improving the specific surface area of porous carbon and the optimization of its pore structure. At present, the common strategy is to design an interconnected three-dimensional hierarchical nanostructure porous carbon and load oxygen functional groups onto its surface, as this leads to a high specific surface area, a porous structure that can minimize ion diffusion,Reference Li, Yuan, Tang, Wang, Sun, Li, Tang, Wang, Gong and He17 and oxygen groups that can improve the wettability of carbon materials in aqueous solutions.Reference Bleda-Martínez, Lozano-Castelló, Morallón, Cazorla-Amorós and Linares-Solano18,Reference Wei and Yushin19
Coal and lignocellulosic materials are commonly used as precursors for preparing activated carbons.Reference Hayashi, Kazehaya, Muroyama and Watkinson20 The preparation of porous carbons from natural feedstocks has received extensive attention, with many types of raw materials having been studied including, but not limited to, sugarcane bagasse, tea leaves, and seeds of fruits.Reference Chang, Gao, Wang, Wu, Xu, Wang, Guo and Jiang21 Lignin is the largest natural resource of aromatic compounds,Reference Hu and Hsieh22 and it has a high carbon content of approximately 60 wt%.Reference Chatterjee and Saito23 Kraft and sulfite pulping processes are known for their effective lignin separation from wood, where lignin from sulfite pulping processes is denoted as lignosulfonates. Currently, the total annual production of lignosulfonates worldwide is approximately 1.8 million tons.Reference Aro and Fatehi24 Lignosulfonates are promising precursors for the preparation of porous carbon owing to their abundance, low cost, and high carbon content.
Although there is no established proportional relationship between the specific surface area and the specific capacitance of carbon materials,Reference Huang, Peng, Liu, Zhao, Chen and Yu16 it is generally accepted that a relatively large surface area and a suitable pore structure are required for the efficient storage of energy in supercapacitors.Reference Wang, Tang, Ding, Malgras, Chang, Hao, Wang, Dou, Zhang and Yamauchi25 A recent research study has demonstrated that a pore size smaller than 1 nm is beneficial to improving supercapacitor capacitance.Reference Largeot, Portet, Chmiola, Taberna, Gogotsi and Simon26 Chemical activation with potassium hydroxide (KOH) is an effective method for the preparation of porous carbon with a high specific surface area. Furthermore, the porous carbon product resulting from KOH activation is largely microporousReference Li, Li and Liu27 and KOH can effectively create the surface oxygen functional groups.Reference Xue, Yan, Liu, Tian and Yi28
Fabrication of porous carbon materials from phenol formaldehyde resins has been widely reportedReference Zheng and Gao12,Reference Szczureka, Jurewicz, Amaral-Labat, Fierro, Pizzi and Celzard13,Reference Xue, Yan, Liu, Tian and Yi28 ; phenol formaldehyde resins have abundant hydroxyl groups, which can enhance capacitive characteristics. To apply this material effectively, sustainable development necessitates that lignin with phenolic structures be abundant and renewable, as well as be substitutable for a portion of the phenols in the preparation of phenol formaldehyde resins. In this study, phenolated calcium lignosulfonate-based phenol formaldehyde resin (PLPF) porous carbons were prepared by crosslinking and polycondensation of phenolated calcium lignosulfonate with formaldehyde, followed by carbonization in an inert atmosphere and activation by various amounts of KOH. The prepared porous carbons were characterized by transmission electron microscopy, scanning electron microscopy, Fourier transform infrared spectroscopy, specific surface area, and porosity analysis. The electrochemical properties of the porous carbons were further characterized by galvanostatic charge/discharge (GCD) measurements, cyclic voltammetry, electrical impedance spectroscopy, and cycling performance using an electrochemical workstation.
II. EXPERIMENTAL
A. Materials
Calcium lignosulfonate was obtained from Quanlin Paper (Shandong, China). Phenol was purchased from Kermel (Tianjin, China). Concentrated sulfuric acid (H2SO4) and hydrochloric acid (HCl) were bought from Xilong Chemical (Guangdong, China). Methanol was procured from Funing Chemical (Tianjin, China), sodium carbonate (Na2CO3) was obtained from BASF SE (Tianjin, China), formaldehyde was purchased from Fengchuan Reagents (Tianjin, China), and sodium hydroxide (NaOH) was bought from Dalu Reagents (Tianjin, China). KOH was procured from Guangfu Reagents (Tianjin, China), nickel foam was obtained from Jiayisheng (Kunshan, China), polytetrafluoroethylene (PTFE) was purchased from Pinjia (Jiangsu, China), and acetylene black was bought from Yiborui Chemical (Tianjin, China). All the chemical reagents were of analytical grade and used without further purification.
B. Preparation of PLPF porous carbon
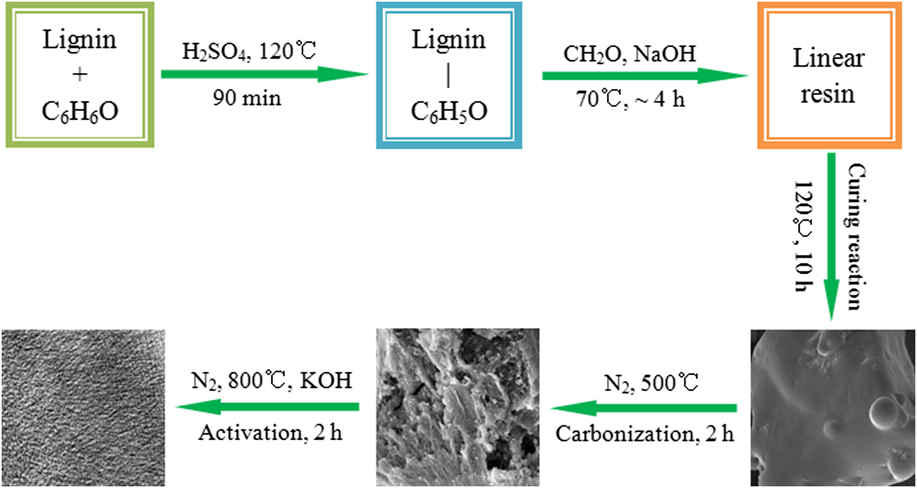
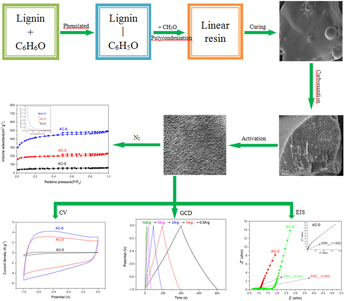
The PLPF resin was prepared as shown in Fig. 1. First, 1 g of calcium lignosulfonate, 2 g of phenol, and 0.4 mL of concentrated H2SO4 were added sequentially to a three-necked flask, and the mixture was stirred and refluxed for 90 min at 120 °C,Reference He29 followed by cooling to 30 °C, then extracted with 30 mL of methanol and the filtrate was neutralized with Na2CO3 before refiltration to remove salt. A 3 mL solution of formaldehyde was then added along with 20 mL of an NaOH solution (containing 0.5 g NaOH), and the reaction stirred at 70 °C for 150 min. The pH was next adjusted with HCl to approximately 6. The solution was further reacted for 90 min, dried at 60 °C to remove the solvent, and finally cured at 120 °C for 10 h to yield PLPF.
Fabrication process of PLPF porous carbon.

The PLPF resin was placed in a tubular resistance furnace under an N2 atmosphere. First, the sample was heated from room temperature to 500 °C at a heating rate of 5 °C/min for 2 h to obtain the carbonized sample. Then, the KOH was weighed as per the mass ratios of alkali to the carbonized sample and mixed with the carbonized samples (the mass ratios of the KOH/carbonized sample were 0, 3, and 6. However, a further increase in the dosage of KOH, the yield of the carbon material was less than 20 wt%). Twenty milliliters of distilled water was added to each sample and dispersed using ultrasonication for 30 min. Upon drying, the samples were heated in a tubular resistance furnace under an N2 atmosphere from room temperature to 800 °C at a heating rate of 8 °C/min for 2 h, followed by washing with dilute HCl, and adjusting the pH to approximately 7 with distilled water. Finally, the PLPF porous carbon was obtained after drying the activated carbon. The PLPF porous carbon prepared from the mass ratios of KOH to the carbonized sample of 0, 3, and 6 were named as AC-0, AC-3, and AC-6, respectively.
C. Structure and performance characterization
The thermal stability of the PLPF samples was determined using a thermogravimetric analyzer (TG; 209 F3, NETZSCH, Selb, Germany) to determine the carbonization temperature. The microstructure of the samples was observed by transmission electron microscopy (TEM; JEM-2100, JEOL, Tokyo, Japan) and scanning electron microscopy (SEM; QUANTA 200, FEI, Hillsboro, Oregon). Fourier transform infrared (FT-IR) spectroscopy was performed in the wave number range 400–4000 cm−1 to analyze the functional groups in the sample (FTIR 650, Gangdong, Tianjin, China). The specific surface area and pore size of the samples were analyzed by a surface area and porosity analyzer (ASAP-2020, Micromeritics, Norcross, Georgia). The specific surface area was calculated by the Brunauer–Emmett–Teller (BET) method, the micropore area by the t-plot method, and the mesopore area by the Barrett–Joyner–Halenda method.
D. Electrochemical characterization
The electrochemical performance was measured by an electrochemical workstation (CHI 660D, Chenhua, Shanghai, China) in a three-electrode system with a 6 M KOH solution serving as the electrolyte. The saturated calomel electrode and a platinum electrode were used as the reference and counter electrodes, respectively. The working electrode was prepared by loading a slurry containing 80 wt% PLPF porous carbon (about 8 mg), 10 wt% PTFE, and 10 wt% acetylene carbon black on a nickel foam substrate, with a 1.0 × 1.0 cm coated area, then dried at 105 °C for 10 h. The prepared electrodes were immersed in the 6 M KOH electrolyte for 24 h before being tested. The potential of the cyclic voltammogram (CV) test ranged from −1.0 to 0 V, and the scan rate was varied from 5 to 50 mV/s. The GCD was measured with the potential ranging from −1.0 to 0 V under different current densities (from 0.5 to 10 A/g). Electrochemical impedance spectroscopy (EIS) was performed in the frequency range 0.01 Hz–100 kHz at an amplitude of 5 mV.Reference Yu, Han, Li and Wang30 The cycle life of the electrodes was evaluated with repeated GCD test. The specific quality capacitance (C m) and specific area capacitance (C s) were calculated from Eqs. (1) and (2), respectively.
 $${C_{\rm{m}}} = {{(I \times \Delta t)} / {(m \times \Delta V)}}\quad ,$$
 $${C_{\rm{m}}} = {{{C_{\rm{m}}}} / {{S_{{\rm{BET}}}}\quad ,}}$$
where I is the constant discharge current (A), Δt is the discharge time (s), m is the mass of electroactive materials (g), ΔV is the discharge voltage change (V), and S BET is the specific surface area.
III. RESULTS AND DISCUSSION
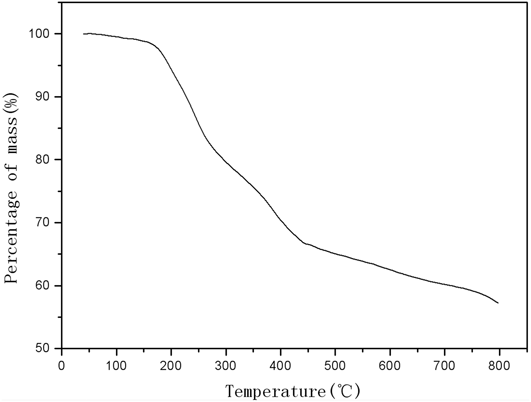
Carbonization is an important step in the preparation of activated carbon. During the carbonization process, a large volume of volatile gas is produced. If the carbonization process is not complete, the volume expansion resulting from thermal decomposition of any remaining organic matter during activation could break the pore structure generated by the activation of KOH, which will lead to poor activation. The TG analysis of PLPF was performed and is shown in Fig. 2. No significant weight loss occurred for PLPF at temperatures below 150 °C, whereas significant weight loss occurred in the range 150–400 °C. The PLPF decomposition slowed down beyond 500 °C, where the volatile components were considered to be completely decomposed; therefore, carbonizing the PLPF at this temperature enabled the formation of relatively stable pyrolytic carbon. Thus, 500 °C was selected as the carbonization temperature.
The themogravimetric curve of PLPF.

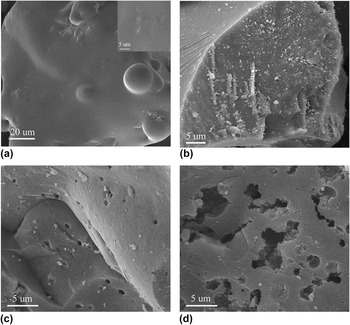
The morphologies of PLPF and PLPF porous carbon were characterized by SEM. As presented in Fig. 3, there was no porous structure and the surface of the PLPF was relatively smooth [in Fig. 3(a), the illustration is a partial enlargement plot]. After carbonization, there was still no obvious pore structure on the surface of AC-0 [Fig. 3(b)]. Through the activation of KOH, the surface developed pore structures in both AC-3 and AC-6 [Figs. 3(c) and 3(d)]; however, the porous structure of AC-6 was more developed.
SEM images of (a) PLPF, (b) AC-0, (c) AC-3, and (d) AC-6.

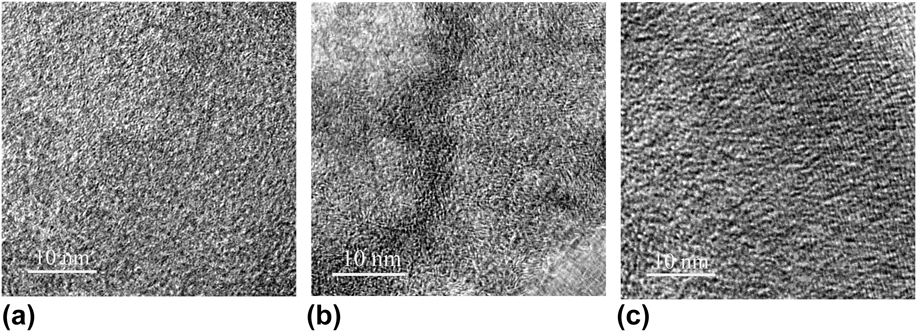
Figure 4 shows the high-resolution transmission electron microscopy (HRTEM) images of AC-0, AC-3, and AC-6. According to the HRTEM images, all the samples exhibited disordered mesopores,Reference Zhao, Li and Liu31 which indicated that they were all amorphous carbon materials. The pore structure formation of AC-0 was largely attributed to the pyrolysis of organic matter [Fig. 4(a)]. After activation with KOH, disordered crystal stripes were observed for AC-3 [Fig. 4(b)]. With a further increase in the dosage of KOH, disordered crystal stripes disappeared for AC-6 [Fig. 4(c)]. The pore structure of AC-6 exhibited more disorder than AC-3. When considered together, this HRTEM data confirmed that the dosage of KOH has significant effects on the formation of the pore structures.
HRTEM images of (a) AC-0, (b) AC-3, and (c) AC-6.

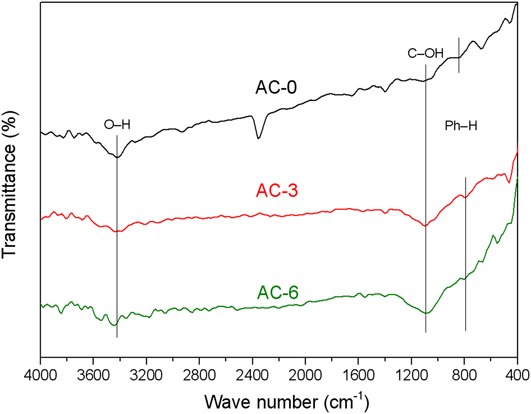
The FT-IR spectra of AC-0, AC-3, and AC-6 are shown in Fig. 5. All the samples had the bands at 3440 cm−1 and 1095 cm−1 corresponding to the O–H stretching vibration and C–OH bending vibrations, respectively, indicated that large numbers of –OH groups were present in these samples; this can greatly improve the wettability of carbon materials in aqueous solutions. The bands at 875–750 cm−1 are attributed to aromatic C–H bending vibrations, suggested that aromatic hydrocarbons still existed in the samples.Reference Li, Li and Liu27
FT-IR spectra of the AC-0, AC-3, and AC-6.

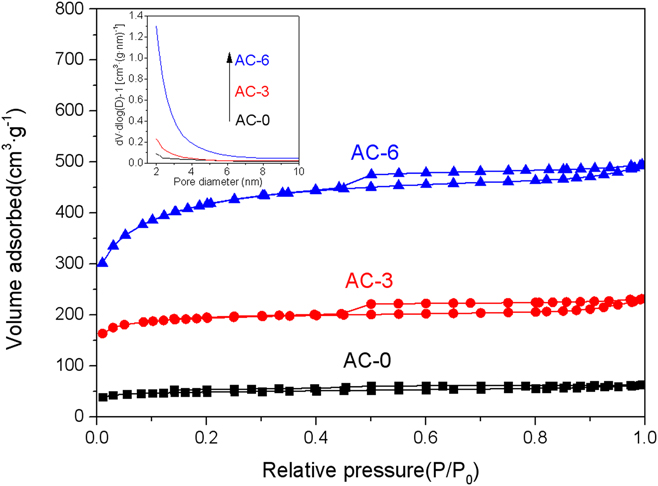
The porosities of the PLPF porous carbons were determined by N2 adsorption/desorption experiments. Figure 6 shows the N2 adsorption/desorption isotherms of AC-0, AC-3, and AC-6; all the samples exhibited type IV isotherms. Under low relative pressure, the curves of AC-3 and AC-6 increased quickly, indicated that AC-3 and AC-6 contained a large number of micropores. The hysteresis loops of AC-3 and AC-6 were observed at a relative pressure range of 0.45–1.0, which indicated the existence of mesopores. By contrast, the curve for AC-0 was smooth and with low adsorption, which indicated that its specific surface area was low.
The nitrogen adsorption–desorption isotherm of PLPF porous carbon [the illustration is a pore-size distribution plot].

Microstructure characterization parameters of porous carbon samples are shown in Table I, where it can be seen that the specific surface area and total pore volume of AC-0 were 151.89 m2/g and 0.095 cm3/g, respectively. The specific surface area and total pore volume of AC-3 were 593.70 m2/g and 0.349 cm3/g, respectively, where the mesoporosity increases to 78.50%. This result demonstrated that this activation condition was conducive to the formation of micropores. The specific surface area and total pore volume of AC-6 were 1320.13 m2/g and 0.753 cm3/g, respectively; here, the specific surface area further increased, the percentage of micropores decreased to 49.73%, the percentage of mesopores increased to 29.63%, and the average pore diameter decreased to 2.28 nm. This was caused by the formation of a large number of small mesopores for AC-6, as shown in the pore-size distribution plot in Fig. 6.
Porosity properties of PLPF porous carbon.

Notes: S BET—surface area, m2/g; S m—micropore area, m2/g; P mi—percentage of micropore area, %; S me—mesopore area, m2/g; P me—percentage of mesopore area, %; V mi—micropore volume, cm3/g; V me—mesopore volume, cm3/g; V to—total pore volume, cm3/g; Aver—average pore diameter, nm.
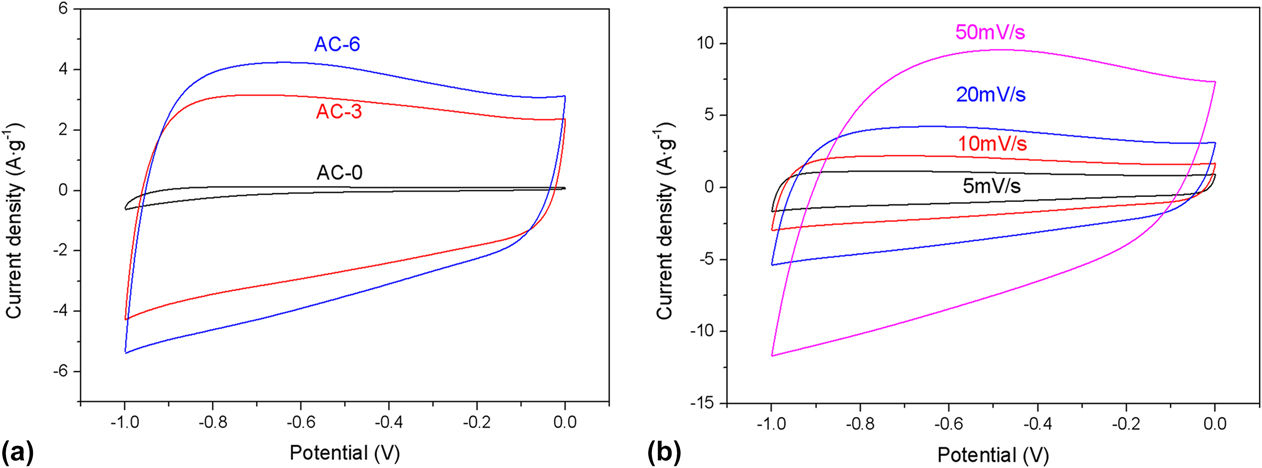
For a clearer understanding of the differences between the electrochemical performance of AC-0, AC-3, and AC-6, an electrochemical workstation was used to measure CV, GCD, and EIS. The CV curves of AC-0, AC-3, and AC-6 were tested at a scan rate of 20 mV/s in a 6 M KOH electrolyte [Fig. 7(a)]. The CV curves of AC-3 and AC-6 exhibited a nearly rectangular shape in the range of −1 to 0 V, indicated good electric double-layer capacitive performance.Reference Yu, Han, Li and Wang30 It was also observed that the CV curve loop area of AC-6 was the largest, which implied that AC-6 had larger C m. Increasing the S BET will improve the C m of the electrodes. The CV behavior of AC-6 at different scan rates is shown in Fig. 7(b). The curves exhibited a quasi-rectangular shape for all scan rates (even at a high scan rate of 50 mV/s), indicated that AC-6 had good electric double-layer capacitive performance.
(a) CV curves of PLPF porous carbon at a scan rate of 20 mV/s. (b) CV curves of the AC-6 at different scan rates.

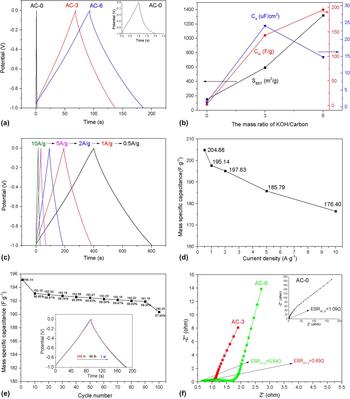
The GCD curves of AC-0, AC-3, and AC-6 at a current density of 2 A/g are shown in Fig. 8(a), where all the discharge curves were almost symmetrical to the corresponding charge curves, confirmed their electric double-layer capacitive behavior,Reference Zhang, You, Zhou, Zhou and Xu32 in accordance with the CV curves. Figure 8(b) displays the trend chart of S BET, C m, and C s at 2 A/g along with the mass ratio of alkali to the carbonized sample. The variation tendency of C m was similar to that of S BET, indicated that the increase in S BET was conducive to the increase in C m. However, the variation tendency of C s was different from that of S BET, as AC-3 with a low S BET of 593.70 m2/g had the largest C s; this was due to the factors that affect the capacitive character, namely the specific surface area, pore-size distribution, surface functional groups, and so on. It is worth mentioning that the value of C s/P mi = 0.3068 of AC-3 was close to the value of C s/P mi = 0.2972 of AC-6, demonstrated that the increase in microporosity was conducive to enhance specific capacitance. The GCD results for AC-6 at different current densities are shown in Fig. 8(c). The charge/discharge curves were nearly symmetric and triangular-shaped with a small voltage drop (even at a high current density of 10 A/g), indicated that the AC-6 exhibited significant electrical double-layer capacitive behavior and a small equivalent series resistance (ESR). The C m of AC-6 derived from the charge/discharge curves is shown in Fig. 8(d). The C m values of AC-6 were 204.88, 195.14, 197.63, 185.79, and 176.40 F/g at a current density of 0.5, 1, 2, 5, and 10 A/g, respectively, resulted in a high-rate capability of 86.10% when the current density changes from 0.5 to 10 A/g.
(a) Charge/discharge curves of PLPF porous carbons at a current density of 2A/g. (b) Change of the S BET, C s, and C m with different mass ratios of KOH to porous carbon. (c) Charge/discharge curves of the AC-6 at various current densities. (d) Calculated C m of the AC-6 from (c). (e) Cycling stability at a current density of 2 A/g. (f) The Nyquist plot of PLPF porous carbon.

The cycling stability of AC-6 was tested at a current density of 2 A/g in 6 M KOH electrolyte. AC-6 demonstrates a high cycling stability of 97.55% of capacitance retention after 100 cycles, as shown in Fig. 8(e). An EIS analysis was used in a 6 M KOH electrolyte in the frequency range of 0.01 Hz–100 kHz to investigate the impedance behaviors of AC-0, AC-3, and AC-6. As shown in Fig. 8(f), in the high-frequency region, the intercept of the real axis with the curve represents the ESR, which consists of the electrolyte and the internal resistance of the electrode.Reference Choi, Hong, Hong, Hammond and Park33 The ESR values of AC-0, AC-3, and AC-6 were 1.09 Ω, 0.69 Ω, and 0.64 Ω, respectively. The same electrolyte was used; thus, AC-3 and AC-6 had smaller internal resistances. The diameter of the semicircle in the mid-frequency region corresponds to the interfacial charge transfer resistanceReference Xie, Sun, Su, Guo, Kong, Li, Huang, Wan, Song, Li, Lv and Chen11; in this section, the resistance of AC-3 was smaller than AC-6, which could be due to its larger average pore diameter. A porous carbon electrode with a suitable proportion of mesopores is beneficial for the interconnected structures and for further reducing the interfacial charge transfer resistance.
IV. CONCLUSIONS
In summary, porous carbon was prepared from PLPF by the KOH activation method. Among the investigated porous carbons from PLPF materials, AC-6 had a higher specific surface area of 1320.13 m2 and exhibited the better capacitive performance due to its highly porous and interconnected structures. The specific quality capacitance attained a value of 204.88 F/g at a current density of 0.5 A/g within a potential range from −1 to 0 V in a 6 M KOH electrolyte. Additionally, AC-6 demonstrated good cycling stability, with a capacitance retention of nearly 98% after 100 cycles at a current density of 2 A/g. The high capacitive performance indicated that AC-6 to be a promising material for energy storage.
ACKNOWLEDGMENTS
This work was supported by Harbin Special Funds to Innovative Talents on Science and Technology Research Project (2016RQQXJ221), National key research and development program (2016YFD0600806), and the Fundamental Research Funds for the Central Universities (2572017CB14).