Introduction
Gregarines (Apicomplexa) are parasites of invertebrates, specifically annelids and arthropods. The life cycle includes oocyst ingestion, sporozoite release, trophozoite and gamont development, and gametocyst formation, which are released into the environment through feces (Clopton & Janovy, Reference Clopton and Janovy1993).
These parasites can infect the fat body, Malpighian tubules, reproductive organs, hemolymph, and digestive system of various insect species (Schreurs & Janovy, Reference Schreurs and Janovy2008) and may cause adverse effects on the host's physiology, reproduction, longevity, and life cycle (Harry, Reference Harry1970; Bouwma et al., Reference Bouwma, Howard and Jeanne2005; Er & Gokce, Reference Er and Gokce2005; Schreurs & Janovy, Reference Schreurs and Janovy2008; Lange & Lord, Reference Lange, Lord, Vega and Kaya2011; Lantova et al., Reference Lantova, Svobodova and Volf2011; Lord & Omoto, Reference Lord and Omoto2012).
Gregarina cuneata Stein 1848 (Eugregarinorida: Gregarinidae) naturally infects populations of Tribolium castaneum (Coleoptera: Tenebrionidae) as described by Ishii (Reference Ishii1914), Hoshide (Reference Hoshide1979) and Gigliolli et al. (Reference Gigliolli, Lapenta, Ruvolo-Takasusuki, Abrahão and Conte2015). This insect infests stored grains and by-products, causing quantitative and qualitative production losses (Smiderle, Reference Smiderle2007).
The most common method used to control this insect is insecticide application; however, indiscriminate use has resulted in environmental bioaccumulation, development of insecticide-resistant insects, and toxic residue retention in stored grains and products. Given the economic impact of this insect in agriculture and commerce, the aim of this study was to analyze the morphofunctional features of G. cuneata development in the midgut of T. castaneum and its effect on the life cycle of parasitized insects, with the possibility of employing the parasite for the biological control of this pest, minimizing the impacts of chemical control agents on the environment and human health.
Material and methods
Insects
Adults of T. castaneum (60 female and 60 male >3 days old) naturally infected with G. cuneata, were obtained from breeding stocks of the Laboratory of Biological Control, Morphology and Cytogenetic of Insects at the Universidade Estadual de Maringa (23°25′30′′S and 51°56′20′′O), Parana, Brazil. The insects were kept at 30 ± 1°C, relative humidity of 70 ± 10%, 12 h photoperiod and fed on wheat flour.
Identification and characterization of gregarines in midgut
The insect hosts were cold anaesthetized, dissected in saline solution (0.1 M NaCl, 0.1 M Na2HPO4, and 0.1 M KH2PO4), and the alimentary canal was exposed. The organ was observed under a stereomicroscope (Zeiss) and the midgut was isolated and removed for anatomical characterization of gregarines located in this region.
For whole mount, the isolated midgut was stained using iodinated zinc chloride, then transferred to a glass slide and examined under a stereomicroscope (Zeiss) and light microscope (Olympus). Gregarines were photographed using a digital camera Sony Cyber Shot DSC 180.
Light microscopy
For histological characterization, the midguts of parasitized insects was fixed in aqueous Bouin's solution for 8 h. After dehydration in a series of increasing alcohol concentrations (70, 80, 90 and 100%), cleared in xylol, embedded in histological paraffin and cut into 6-μm-thick sections on Leica RM 2250 microtome. These sections were collected on glass slides, rehydrated, and stained with hematoxylin and eosin (H/E) and Periodic acid-Schiff (PAS) (Junqueira & Junqueira, Reference Junqueira and Junqueira1983). Analyses were performed using a light microscope (Olympus), followed by photographic documentation.
Scanning electron microscopy (SEM)
For SEM, the midguts of insect parasitized were fixed in 2.5% glutaraldehyde in 0.1 M phosphate buffer (pH 7.3) for 48 h. They were then post-fixed in 1% osmium tetroxide in distilled water for 30 min and dehydrated in a series of increasing alcohol concentrations (Scudeler & Santos, Reference Scudeler and Santos2013). The samples were critical-point dried (Leica CPD 030), coated with gold using a Shimadzu IC-50 coater, and observed using a Shimadzu SS-550 scanning electron microscope. The analyses of SEM were carried out in Microscopy Center of Complex Centers of Research Support (COMCAP) of the State University of Maringa, Parana, Brazil.
Transmission electron microscopy (TEM)
For TEM, portions of the midguts of parasitized insects were fixed in 2.5% glutaraldehyde and 4% paraformaldehyde in a 0.1 M phosphate buffer (pH 7.3) for 24 h. It was then post-fixed for 2 h without 1% osmium tetroxide in the same buffer, washed in distilled water and stained in 0.5% uranyl acetate for 2 h. Next, the sample was dehydrated in a series of increasing acetone concentrations and embedded in Araldite® resin. The ultrafine sections were stained in an alcoholic solution saturated with uranyl acetate and lead citrate (Scudeler & Santos, Reference Scudeler and Santos2013) and observed under a JEOL JEM-1400 TEM. The analyses of TEM were carried out in Microscopy Center of Complex Centers of Research Support (COMCAP) of the State University of Maringa, Parana, Brazil.
Voucher specimens
Voucher specimens and the material analyzed were deposited at the Laboratory of Biological Control, Morphology and Cytogenetic of Insects at the Universidade Estadual de Maringa, Parana, Brazil.
Data analysis
The mortality and the size of the parasitized and unparasitized larvae were recorded at 8, 20, 31, 40, 48, and 59 days after hatching. χ2 was used for independence (α = 0.05), without Yates correction, and bilateral analysis was performed by analyzing differences in survival throughout the life cycle of T. castaneum individuals, for the control (unparasitized) and the parasitized groups. The normality of the lengths of the third-instar control and parasitized larvae were verified using the Shapiro–Wilk test (α = 0.05). In the analysis of differences in length between third-instar control and parasitized larvae, the lengths were ranked for the Wilcoxon–Mann–Whitney test. All tests and graphics were generated using the software R version 3.0.2 with the stats package (R Core 144 Team, 2013).
Results
Morphology and development of G. cuneata in the midgut of T. castaneum
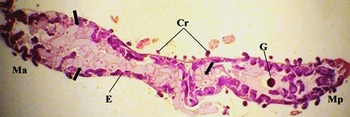
Trophozoites, gamonts (solitary and associated), and gametocysts were present in the midgut of the dissected insects (fig. 1).
Photomicrographs of G. cuneata in T. castaneum stained using H/E. Anterior region of the midgut (Ma); posterior region of the midgut (Mp); trophozoites and gamonts in the midgut (arrows); gametocyst in the posterior region of the midgut (G); regenerative crypts (Cr); epithelium (E). Scale bar = 20 µm.

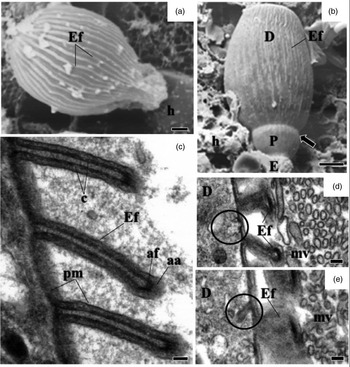
In young trophozoites, the apical region was differentiated into an epimerite that firmly attached the parasite to the epithelial cells of the midgut during the extracellular development phase (fig. 2a, b).
Electron micrographs of development of G. cuneata in the midgut of adult T. castaneum. (a) SEM of non-segmented young trophozoite adhering to the epithelial cell (arrow). Host tissue (h); epicystic folds (Ef). Scale bar = 2 µm. (b) SEM of segmented young trophozoite. Epimerite (E); protomerite (P); deutomerite (D); epicystic folds (Ef); septum (arrow); host tissue (h). Scale bar = 5 µm. (c) TEM of epicystic folds (Ef). Plasma membrane (pm); cytomembranes (c); apical filaments (af); apical arcs (aa). Scale bar = 0.2 µm. (d) Micropore (circle); deutomerite (D); microvilli (mv); epicystic folds (Ef). Scale bar = 0.2 µm (e) Invaginations in internal lamina (circle); deutomerite (D); microvilli (mv); epicystic folds (Ef). Scale bar = 0.2 µm.
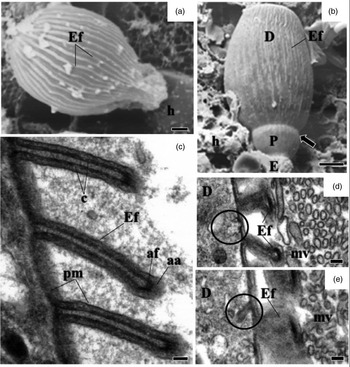
The surface of the parasite's body was covered with straight or slightly undulated longitudinal pellicular folds known as epicytic folds (fig. 2a, b). These were formed by a trimembrane pellicle, which consists of the plasma membrane and the inner membrane complex formed by two adjacent cytomembranes (fig. 2c). There are electron-dense structures within apical parts of the epicytic folds called apical arcs and apical filaments (fig. 2c). Micropores are located between the epicytic folds and lead into invaginations of the plasma membrane inside the cytoplasm (fig. 2d, e). With development, there were changes in the density, size, and organization of the epicytic folds (figs 2a, b and 3a, b).
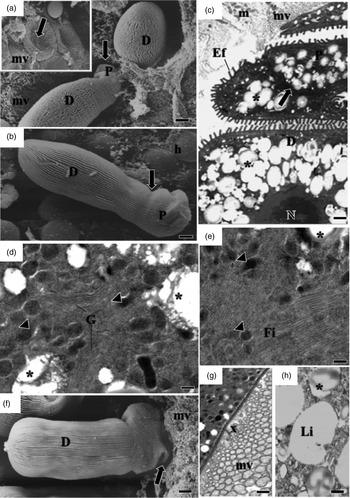
Electron micrographs of mature trophozoites and gamonts of G. cuneata. (a) Trophozoites adhering to epithelial cells and detail of the invaginations formed in the microvilli after the release of trophozoites from the tissue (arrows). Microvilli (mv) deutomerite (D); protomerite (P). Scale bar = 2 µm. (b) SEM of trophozoites indicating protomerite (P) and deutomerite (D); septum (arrow); host cell (h). Scale bar = 2 µm. (c) Ultrastructure of maturing trophozoite. Septum (arrow); protomerite (P); deutomerite (D); microvilli (mv); epicytic folds (Ef); mitochondria (m); amylopectin granules (asterisk); nucleus (n). Scale bar = 5 µm. (d, e) Ultrastructure of the protomerite of maturing trophozoites. Electron-dense structure (arrowhead); Golgi region and vesicles (G); fibrils (Fi); amylopectin granules (asterisk). Scale bar = 0.2 µm. (f) SEM of the gamont. Deutomerite (D); projections in the protomerite (arrow); microvilli (mv). Scale bar = 2 µm. (h) TEM indicating deposition of amorphous material (x) between protomerite and microvilli (mv) of the host cell. Scale bar = 2 µm. (i) Lipid drops (L) and amylopectin granules (asterisk) in deutomerite. Scale bar = 0.2 µm.
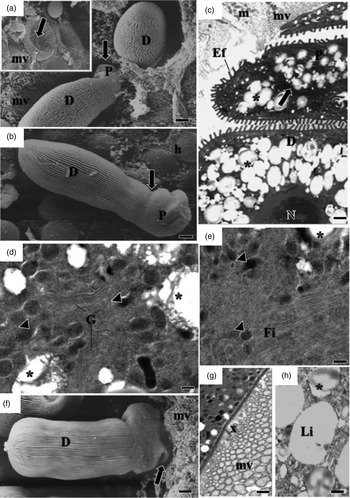
A septum divided the body into two segments: the protomerite and the deutomerite (fig. 2b). The protomerite, located above, remained in contact with the host's microvilli (fig. 3a). It varied from a cylindrical to an ovoidal shape and exhibited a slightly rounded anterior (fig. 3b–c). The anterior region presented a granular cytoplasm composed of amylopectin, a well-developed Golgi region, fibrils, and numerous electron-dense inclusions (fig. 3c–e). Maturing trophozoites and gamonts developed projections similar to digitations in the protomerite (fig. 3f). It was noted the absence of epicytic folds and the presence of amorphous material of unknown origin in the contact zone between the host and the parasite (fig. 3g).
The elongated cylindrical deutomerite extended from the septum to the posterior region of the body; it increased in thickness and ended in a rounded extremity that abutted inside the midgut lumen (figs. 2a, b and 3a, b, f). A spherical nucleus with a defined nucleolus, amylopectin granules (fig. 3c), and lipid droplets were located in this region (fig. 3h).
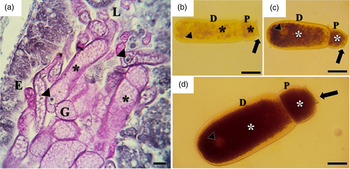
The amylopectin observed in both the protomerite and deutomerite were positively marked by PAS staining (fig. 4a). The number of granules deposited increased with maturation (fig. 4b, d).
Deposition of amylopectin granules during development of G. cuneata. (a) PAS positive gamonts (G) evident by the presence of amylopectin (asterisk); nucleus in the deutomerite (arrowhead); lumen (L); epithelium (E). Scale bar = 20 µm. (b–d) Total preparation of maturing trophozoites, stained with iodinated zinc chloride. Protomerite (P); deutomerite (D). Increased number of amylopectin granules deposited in the protomerite and deutomerite (asterisk); collar-like modified apical part of protomerite of the rather a detached satellite (arrows); nucleus (arrowhead); Scale bar = 20 µm.

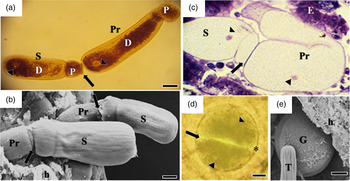
Recognition between sexual cells initiated the reproduction phase (fig. 5a). In a biassociative and caudofrontal association, the anterior cell (primite) morphologically differed from the posterior cell (satellite). The primite exhibited a spatulate protomerite and an elongate cylindrical deutomerite; it became thicker furthest from the septum and had a rounded posterior extremity. The satellite had a hemispheric protomerite, and the deutomerite differed from the anterior cell only in length (fig. 5b, c).
Association of gamonts and gametocysts. (a) Recognition between sexual cells (arrow): primite (Pr) and satellite (S), stained with iodinated zinc chloride. Nucleus (arrowhead); protomerite (P); deutomerite (D). Scale bar = 20 µm. (b) SEM of associated primite (Pr) and satellite (S) gamonts adhering to the host tissue (h); Syzygy junction (arrow). primite (Pr); satellite (S); protomerite (P); deutomerite (D). Scale bar = 10 µm. (c) Satellite gamonts (S) and primite gamonts (Pr) initiating rotation movement, stained with H/E. Junctional complex (arrow); nucleus (arrowhead); epithelium (E). Scale bar = 20 µm. (d) Initial stage of gametocyst formation in which individual gamonts associate (arrow) to form a spherical structure, stained with iodinated zinc chloride. Nucleus (arrowhead), envelope and hyaline space (asterisk). (e) SEM of spherical gametocyst (G) located in the posterior region of the midgut (h). Trophozoite (T). Scale bar = 10 µm.
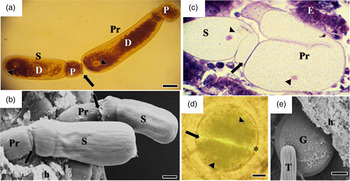
Rotational movements and the morphological alterations observed in the associated gamonts (fig. 5c) resulted in the formation of spherical gametocysts (fig. 5d, e). These structures were found in the posterior extremity of the midgut and in the proctodeum, from which they were released through the feces.
Development of T. castaneum parasitized and unparasitized by G. cuneata
We assessed the life cycle T. castaneum, parasitized and unparasitized (control) by G. cuneata. In both groups, the remaining eggs were incubated for 4 days; 42 parasitized and 40 unparasitized larvae hatched, and larval development was evaluated at 8, 20, 31, 40, 48, and 59 days after hatching.
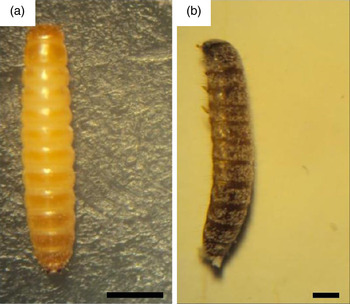
The parasitized larvae showed blackened bodies and reduced size compared with unparasitized larvae (fig. 6).
Larvae of the T. castaneum with 31 days of the developmental. (a) Unparasitized, (b) parasitized. Scale bar = 1 mm.

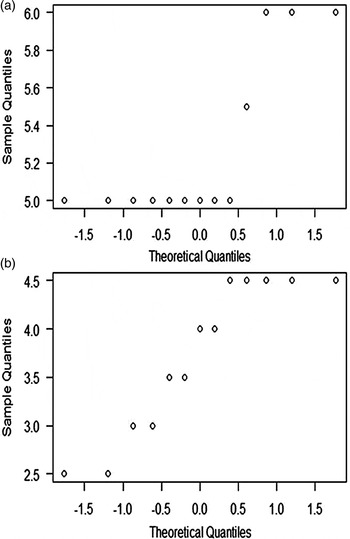
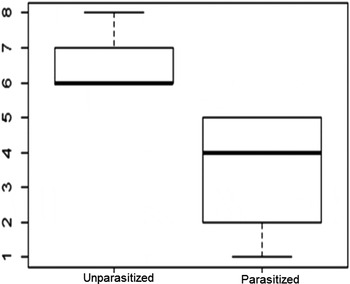
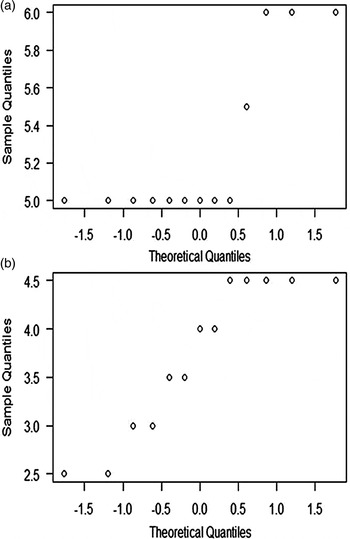
This difference in length of parasitized (W = 0.8496, P = 0.02814) and unparasitized (W = 0.6186, P = 9, 513 × 10 − 5) larvae at 31 days of development was initially assessed using the Shapiro–Wilk test (fig. 7). The results were not normally distributed and, thus, the non-parametric Wilcoxon–Mann–Whitney test was performed, showing a significant difference in the larval size in both groups (W = 169, P = 9,825 × 10 − 6, IC 95%: 1.999993–4.000041). The unparasitized larvae (5.2 mm average length) were larger than the parasitized larvae (3.7 mm average length) of the same age (fig. 8).
Normal distribution of lengths T. castaneum larvae in third instar. (a) Unparasitized, (b) parasitized by G. cuneata.
Length of T. castaneum unparasitized and parasitized by G. cuneata. The y-axis is generated for ranking the Wilcoxon–Mann–Whitney test created with larval lengths, where 1 = 2.5, 2 = 3, 3 = 3.5, 4 = 4, 5 = 4.5, 6 = 5, 7 = 5.5, 8 = 6 cm.

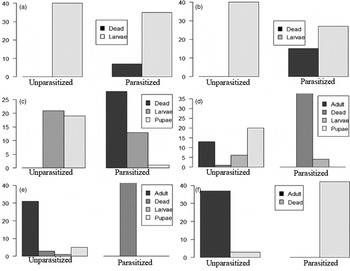
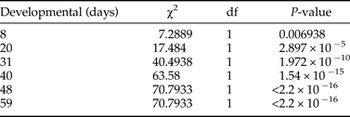
Using χ2 independence, it was observed that the mortality of the parasitized larvae started after 8 days of development, and increased considerably at 20, 31, 40, 48, and 59 days, and it was significantly different to the unparasitized larvae (table 1, fig. 9a–f).
Survival differences and delays in the development of T. castaneum unparasitized and parasitized by G. cuneata at different stages of development. (a) Insects with 8 days, (b) insects with 20 days, (c) insects with 31 days, (d) insects with 40 days, (e) insects with 48 days, and (f) insects 59 days of development.

Differences in survival T. castaneum parasitized and unparasitized by G. cuneata throughout its life cycle.

While 47.5% of the unparasitized larvae became pupae at 31 days, only one parasitized larvae reached this stage in the same period (fig. 9c). This was the only parasitized individual that reached the pupal stage in the whole period examined; however, it did not complete metamorphosis, dying 9 days after pupation (fig. 9d).
There was no insect emergence adult parasitized (fig. 9d–f). At 48 days of development, the mortality in this group reached 100% (fig. 9e). However, the unparasitized insects completed the cycle between 40 and 59 days after hatching, and only 2.5% mortality was recorded in this period (table 1, fig. 9d–f).
Discussion
Tribolium castaneum is infected by G. cuneata after the ingestion of food containing oocysts and through cannibalism. Activation and excystation occur in the lumen of the midgut, in response to physiological stimuli such as the pH of intestinal contents, as observed in Tenebrio molitor infected by G. cuneata and Gregarina polymorpha (Clopton & Gold, Reference Clopton and Gold1995). The sporozoites, which were not assessed in this study, bind to midgut epithelial cells and develop into trophozoites.
At this stage, the parasites remained attached to the cells by an epimerite. In addition to attaching to the host, this structure is thought to be metabolically active and involved in gregarine feeding (Baudoin, Reference Baudoin1969; Schrevel & Philippe, Reference Schrevel, Philippe and Kreier1993; Valigurová et al., Reference Valigurová, Michalkova and Koudela2009). The occurrence of endoplasmic reticulum and a large number of mitochondria in the apical region of infected cells suggests an interaction between the epimerite of G. cuneata and the epithelium of T. castaneum, as observed in Didymorphyes gigantea by Hildebrand (Reference Hildebrand1976) and Leidyana canadensis by Lucarotti (Reference Lucarotti2000).
When fixed to the host cell, the epimerite and protomerite cause deep invaginations in the plasma membrane of midgut epithelial cells in T. castaneum during larval development, similar to those observed in Gregarina garnhami infections of Schistocerca gregaria (Valigurová & Koudela, Reference Valigurová and Koudela2008) and G. polymorpha invasions of T. molitor larval intestines (Valigurová et al., Reference Valigurová, Michalkova and Koudela2009).
According to Lucarotti (Reference Lucarotti2000) and Valigurová et al. (Reference Valigurová, Michalkova and Koudela2009), trophozoites can detach from senescent cells at any point and reattach to young cells, exhibiting better physiological conditions for the completion of their development. This is an active, self-regulated process involving gregarine motility (Walker et al., Reference Walker, Mackenzie, Bainbridge and Orme1979) and epimerite retraction, facilitated by contractile fibrils located in the epimerite itself and in the apical region of the protomerite (Lucarotti, Reference Lucarotti2000; Valigurová & Koudela, Reference Valigurová and Koudela2008; Valigurová et al., Reference Valigurová, Michalkova and Koudela2009; Valigurová, Reference Valigurová2012).
In the protomerite of G. cuneata, the presence of a fibril-rich region covered by an intact membrane, and the absence of epimerite remnants in the host tissue, may indicate the occurrence of the retraction mechanism observed previously in G. cuneata infections of T. molitor larvae by Valigurová (Reference Valigurová2012), in G. garnhami by Valigurová & Koudela (Reference Valigurová and Koudela2008), in G. polymorpha by Valigurová et al. (Reference Valigurová, Michalkova and Koudela2009), and in other parasitic species (Lucarotti, Reference Lucarotti2000; Heintzelman, Reference Heintzelman2004; Lange & Cigliano, Reference Lange and Cigliano2004).
At the end of the growth period, the epimerite usually disappears and the gregarine cells acquire a dicystid-like morphology (protomerite and deutomerite). Projections similar to the digitations in the G. cuneata protomerite emerged and amorphous material accumulated at the interface between the parasitic anterior region and the microvilli of the host cell. The presence of a well-developed Golgi region and a large number of electron-dense vesicles in the protomerite must be related to the secretion of the amorphous, probably adhesive, substance (Valigurová et al., Reference Valigurová, Hofmannova, Koudela and Vavra2007, Reference Valigurová, Jirku, Koudela, Gelnar, Modry and Slapeta2008, Reference Valigurová, Michalkova and Koudela2009; Valigurová & Koudela, Reference Valigurová and Koudela2008; Valigurová, Reference Valigurová2012).
Changes in the protomerite allowed mature trophozoites and gamonts to remain attached to the host where they possibly absorbed nutrients through a process based on membrane permeability (MacMillan, Reference MacMillan1973; Valigurová & Koudela, Reference Valigurová and Koudela2008; Valigurová et al., Reference Valigurová, Michalkova and Koudela2009; Valigurová, Reference Valigurová2012).
The increasing deposition of amylopectin granules throughout G. cuneata development suggests an active metabolic interaction between the parasite and infected cells. Gregarines must employ carbohydrates enzymatically degraded by the host to fuel energetically costly processes such as reproduction or motility (Schreurs & Janovy, Reference Schreurs and Janovy2008).
Gliding motility is driven by lateral undulations in the epicystic folds, through the action of either contractile proteins (Vivier, Reference Vivier1968; Valigurová et al., Reference Valigurová, Vaškovicová, Musilová and Schrével2013) or systems that antagonize fold filaments (Ruhl, Reference Ruhl1976). Motility is alternatively achieved through the release of lubricating mucus (Schewiakoff, Reference Schewiakoff1894; Valigurová et al., Reference Valigurová, Vaškovicová, Musilová and Schrével2013). In G. cuneata, micropore-like structures that interrupt the pellicle region may be involved in the secretion of mucus that facilitates motility (Schrevel, Reference Schrevel1972; Talluri & Dallai, Reference Talluri and Dallai1983).
In addition to their role in motility, fibrillar filaments in the apical extremity of the epicystic folds may be involved in morphological transformations that occur during gregarine development and culminate with the initiation of the sexual phase of the cycle (syzygy) and gametocyst formation (Toso & Omoto, Reference Toso and Omoto2007). These transformations are influenced by external factors such as temperature and humidity (Smith et al., Reference Smith, Cook and Lutterschmidt2007), but mainly by the efficacy of the immune system (Thomas & Rudolf, Reference Thomas and Rudolf2010), diet, nutritional status (Rodriguez et al., Reference Rodriguez, Omoto and Gomulkiewicz2007; Schreurs & Janovy, Reference Schreurs and Janovy2008), and host physiology (Schawang & Janovy, Reference Schawang and Janovy2001; Thomas & Rudolf, Reference Thomas and Rudolf2010).
Several studies have shown that physical and metabolic interactions established between parasites and their hosts are fundamental to the completion of their life cycle (Schawang & Janovy, Reference Schawang and Janovy2001; Schreurs & Janovy, Reference Schreurs and Janovy2008). However, the pathogenicity of gregarines is still unknown and studies describing the effects of infection on reproduction, development, growth, longevity, and mortality of infected insects are limited (Harry, Reference Harry1967; Dunkel & Boush, Reference Dunkel and Boush1969; Schwalbe & Baker, Reference Schwalbe and Baker1976; Brooks & Jackson, Reference Brooks, Jackson and Pinnock1990; Ball et al., Reference Ball, Cunningham, Clake and Daszak1995; Johny et al., Reference Johny, Muralirangan and Sanjayan2000; Er & Gokce, Reference Er and Gokce2005).
In the present study, parasitized larvae of T. castaneum decreased in size compared with unparasitized larvae of the same age, which may be indicate delayed growth. This impact may be associated with a reduction in food availability caused by occlusion of the midgut by the parasites during development, as seen in Blattella germanica (Lopes & Alves, Reference Lopes and Alves2005) and Dermestes maculatus (Lord & Omoto, Reference Lord and Omoto2012). Similarly, it may be associated with physical damage in the microvillis to the digestive cells which reduces absorption and excretion, causing host malnutrition as observed in T. castaneum adults parasitized by G. cuneata (Gigliolli et al., Reference Gigliolli, Lapenta, Ruvolo-Takasusuki, Abrahão and Conte2015).
In addition to nutritional deficiencies, it is likely that other cell types as renegerative and endocrine cells are damaged, affecting hormone production and the regeneration of damaged tissue, as previously observed in T. castaneum parasitized by G. cuneata (Gigliolli et al., Reference Gigliolli, Lapenta, Ruvolo-Takasusuki, Abrahão and Conte2015).
These functional alterations in the midgut should be reflected in the insect physiology, interfering with metamorphosis or the ability of the larvae to molt, thereby hindering larval development and survival of the infected insects (Lucarotti, Reference Lucarotti2000; Valigurová & Koudela, Reference Valigurová and Koudela2005). As gregarine rapidly proliferate and frequently reinfect the same tissue, the insects lose their ability to repair damaged tissue and develop septicemia. This was observed in the high mortality rate of B. germanica parasitized by Gregarina sp. (Lopes & Alves, Reference Lopes and Alves2005).
Our results contradict those of Valigurová (Reference Valigurová2012) for studies on T. molitor parasitized by G. cuneata. While in T. castaneum, the infection resulted in morphological and physiological changes in the host (Gigliolli et al., Reference Gigliolli, Lapenta, Ruvolo-Takasusuki, Abrahão and Conte2015), with negative impacts on their development and survival, in T. molitor, the same parasite might have favored the development, fitness, and survival of the parasitized insects (Valigurová, Reference Valigurová2012).
Although T. castaneum and T. molitor are phylogenetically related species, and both can be infected by G. cuneata, the different pathogenic effects observed may be associated with the co-evolution of host and parasite. Although T. castaneum and T. molitor are phylogenetically related species, and both can be infected by G. cuneata, the different pathogenic effects observed may be associated with the co-evolution of host and parasite (Agnew et al., Reference Agnew, Koella and Michelakis2000; Gourbal et al., Reference Gourbal, Righi, Petit and Gabrion2001; Lefèvre et al., Reference Lefèvre, Lebarbenchon, Gauthier-Clerc, Poulin and Thomas2009).
In this evolutionary process, the parasite might have altered its morphophysiology and the host's (T. molitor) behavior to eliminate harmful relationships between members, thus encouraging the spread and survival of the parasite (Lefèvre et al., Reference Lefèvre, Lebarbenchon, Gauthier-Clerc, Poulin and Thomas2009). The parasite may also have adapted to environmental conditions and other hosts physiochemical (T. castaneum), thereby establishing new evolutionary relationships.
For G. cuneata invasions, external environmental conditions, as well as morphological and physiological conditions of the host, can interfere with established relationships and have pathogenic effects on insects. This information allows us to evaluate new integrated pest management strategies and techniques that use natural enemies in storage units to reduce the proliferation of insects and, at the same time, resolve some of the environmental and health problems caused by conventional control methods.
Acknowledgments
We thank of the Centro de Microscopia Eletrônica (CME) at the Universidade Estadual Paulista (UNESP), Botucatu, SP and Centro de Microscopia (CMI) of Complexo de Centrais de Apoio à pesquisa (COMCAP) at the Universidade Estadual de Maringa (UEM), Maringa, PR in processing material used and assistance in handling the equipment. This work was supported by the Conselho Nacional de Desenvolvimento Científico e Tecnológico (CNPq).