1. Introduction
Studies of the transition from diagenesis to metamorphism in foreland fold-and-thrust belts represent important contributions to the establishment of tectonothermal evolution and the understanding of orogenic processes. They can also contribute to the assessment of potential hydrocarbon resources and ore deposits. In these foreland areas, the most common sediments are siliciclastic and carbonate rocks under diagenetic or very low metamorphic conditions. In these rocks, the study of the transition between diagenesis and metamorphism is possible using techniques such as the conodont colour alteration index (CAI), the analysis of clay minerals, the Kübler index of illite (KI), K-white mica b 0 dimensions, vitrinite reflectance, the palynomorph darkness index or fluid inclusion homogenization temperatures. In this study, the CAI method is used to estimate the maximum palaeotemperatures and the metamorphic grade reached by the rocks. Other palaeothermal indicators previously used in the study area are also considered in this tectonothermal analysis.
The transition between diagenesis and metamorphism can occur under different conditions: orogenic regional metamorphism, burial or contact metamorphism. On the other hand, the peak of a thermal event can occur before, during or after the main structures of the study area. Assessment of the tectonothermal evolution of a specific area using the CAI method therefore requires the steps: (1) determination and location of the CAI values and, if possible, mapping of the corresponding isograds in order to determine the thermal events that occurred in the area and the factors that controlled the development of each of them; and (2) establishment of the spatial and temporal relationships between the thermal episodes and the stratigraphy, structure and erosional events of the area.
The analysis of CAI isograd maps, together with that of the corresponding geological maps, has been very useful for the understanding of the type and age of the thermal events under diagenetic conditions or very-low- or low-grade metamorphism in many areas. The change in the colour of conodonts is a progressive and irreversible process; the CAI method therefore does not present the problems of other methods such as the Kübler index, which may be modified when retrograde metamorphism affects the clay minerals. In addition, the frequent presence of detrital phyllosilicates inherited from a metamorphic source area makes it difficult to interpret the obtained values in the context of the regional geology, mainly in synorogenic basins.
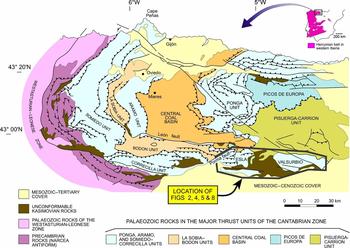
The Cantabrian Zone (CZ) represents the foreland fold-and-thrust belt of the Variscan orogen in NW Spain (Fig. 1). It presents thin-skinned tectonics, and its major structural features describe an arc (Ibero–Armorican arc). The thrusts branch from a sole thrust located in the base of a carbonate formation (Láncara Formation; Lower–Middle Cambrian). Folds associated with the thrusts are common, and they are mainly fault-bend folds. They form two systems (Julivert, Reference Julivert1971; Pérez-Estaún et al. Reference Pérez-Estaún, Bastida, Alonso, Marquinez, Aller, Álvarez-Marrón, Marcos and Pulgar1988): (1) a longitudinal or arcuate system, mainly formed by folds initially related to frontal ramps; and (2) a transversal or radial system, mainly formed by folds initially related to lateral ramps. Transition from diagenesis to metamorphism occurred in several areas of this zone under different conditions. The front of the orogenic regional metamorphism, which extends towards the hinterland, appears in the western and south-western parts of the zone. A cleavage is associated with this metamorphism (Pérez-Estaún, Reference Pérez-Estaún1978; Brime & Pérez-Estaún, Reference Brime and Pérez-Estaún1980; Aller et al. Reference Aller, Bastida, Brime and Pérez-Estaún1987, Reference Aller, Valín, García-López, Brime and Bastida2005; Gutiérrez-Alonso & Nieto, Reference Gutiérrez-Alonso and Nieto1996; García-López et al. Reference García-López, Brime, Bastida and Sarmiento1997, Reference García-López, Brime, Valín, Sanz-López, Bastida, Aller and Blanco-Ferrera2007; Brime et al. Reference Brime, García-López, Bastida, Valín, Sanz-López and Aller2001). In the basal part of some thrust nappes, anchizonal conditions are reached as a result of burial (Brime, Reference Brime1981; Bastida et al. Reference Bastida, Brime, García-López and Sarmiento1999; Brime et al. Reference Brime, García-López, Bastida, Valín, Sanz-López and Aller2001; Aller et al. Reference Aller, Valín, García-López, Brime and Bastida2005; García-López et al. Reference García-López, Brime, Valín, Sanz-López, Bastida, Aller and Blanco-Ferrera2007). Late or post-Variscan episodes of very-low- or low-grade metamorphism occurred in areas of the southern and south-eastern parts of the CZ (Aller & Brime, Reference Brime1985; Brime, Reference Brime1985; Raven & van der Pluijm, Reference Raven and van der Pluijm1986; Marín et al. Reference Marín, Villa, García-López and Menéndez1996; J.A. Marín, unpub. data, 1997; Bastida et al. Reference Bastida, Blanco-Ferrera, García-López, Sanz-López and Valín2004; Aller et al. Reference Aller, Valín, García-López, Brime and Bastida2005; García-López et al. Reference García-López, Brime, Valín, Sanz-López, Bastida, Aller and Blanco-Ferrera2007). Nearly horizontal or moderately dipping cleavage appears associated with this metamorphism. Finally, local contact metamorphism due to the intrusion of late or scarce post-Variscan igneous rocks is present in a few points of the CZ. Reviews of the tectonothermal evolution of the CZ can be seen in Raven & van der Pluijm (Reference Raven and van der Pluijm1986) and García-López et al. (Reference García-López, Bastida, Brime, Aller, Valín, Sanz-López, Méndez and Menéndez-Álvarez1999, Reference García-López, Brime, Valín, Sanz-López, Bastida, Aller and Blanco-Ferrera2007).
Generalized geological map of the Cantabrian Zone (after Julivert, Reference Julivert1971) with the location of the study area.

The Esla–Valsurbio unit, located in the south-eastern part of the CZ (Fig. 1), is an area where the tectonothermal evolution is not well known. However, the existence of a thick Palaeozoic succession and of an important tectonic superimposition due to thrusting makes this unit very interesting for the study of the transition between diagenesis and metamorphism.
The aim of this study is to produce a map of CAI isograds and to establish the tectonothermal history of the Esla–Valsurbio unit. We also use the CAI method to develop a model of the temporal relationships between the tectonothermal evolution, development of thrusts and folds, erosion processes and subsequent extensional deformation. This model can be applied to external zones of other orogenic belts. Similarly, the CAI method is used to establish a regional correlation between metamorphic grade and development of cleavage. The results of the research are considered in the context of the regional geology of the CZ in order to improve our knowledge of the Iberian Variscan belt.
2. Geological setting
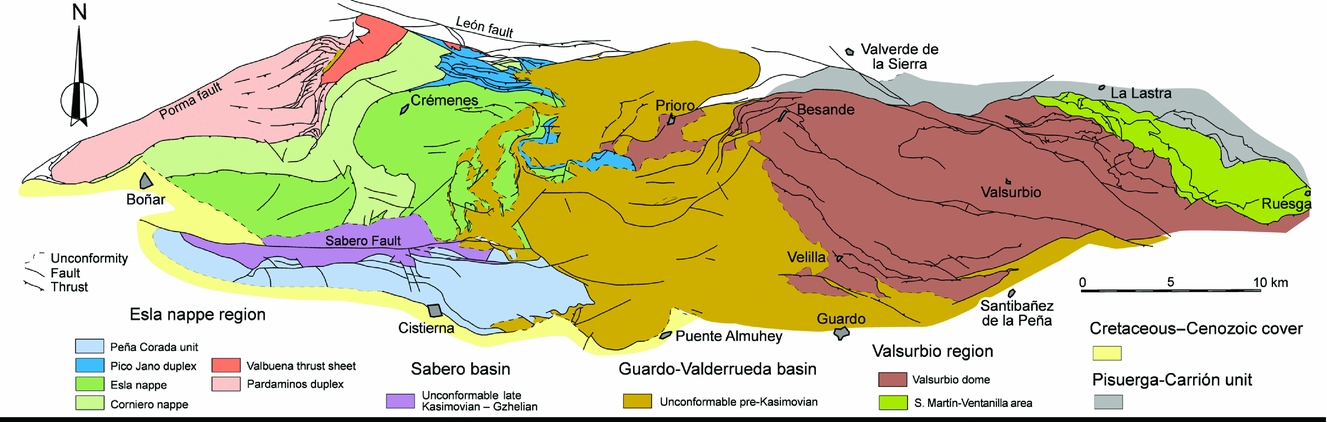
The Esla–Valsurbio unit can be divided into two regions (Fig. 2): the Esla nappe region and the Valsurbio region. These are separated by a wide area occupied by synorogenic, mainly siliciclastic, and mostly non-marine Carboniferous rocks (Guardo–Valderrueda basin). The two regions present comparable Devonian facies (Astur-leonese facies by Brouwer, Reference Brouwer1964) and a similar location in the original Palaeozoic basin. This palaeogeographic similitude has usually led to the Esla nappe region and the Valsurbio region being considered parts of a single major unit of the CZ.
Map of the tectonic units of the Esla–Valsurbio unit (based on Alonso, Reference Alonso1987a ; J.A. Marín, unpub. thesis, 1997).

The Esla nappe region is separated from the south-western thrust units of the CZ by a tear fault (the Porma fault) (Fig. 2). Another important fault (the León Fault) separates it from the adjacent units of the Central Coal basin and the Pisuerga–Carrión unit, which are located to the north of the study area. To the south, the Palaeozoic rocks are overlapped by the Mesozoic–Cenozoic cover of the Duero basin. The Valsurbio region is separated by several faults to the north of the Pisuerga–Carrión unit (Fig. 2). To the south, it is bounded by a narrow corridor of synorogenic Carboniferous rocks that are overlapped by the Mesozoic–Cenozoic cover.
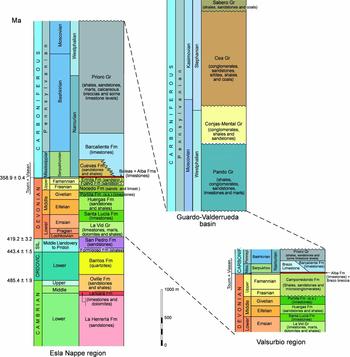
The Esla nappe and Valsurbio regions present certain stratigraphic differences (Fig. 3). A near-complete succession from the Lower Cambrian to the Upper Carboniferous exists in the former, but in the latter pre-Devonian rocks do not crop out. On the other hand, the cropping out succession of Carboniferous rocks conformable on the substratum is thicker in the Esla nappe region. However, in both cases the top of this succession is overlapped by the unconformable synorogenic Carboniferous rocks of the Guardo–Valderrueda basin.
Synthetic logs of the stratigraphic succession of the Esla–Valsurbio unit (based on Alonso, Reference Alonso1987a ; J.A. Marín, unpub. thesis, 1997). Absolute ages for the boundaries between periods are from the International Stratigraphic Chart (International Commission on Stratigraphy, unpub. data, 2013: http://www.stratigraphy.org/ICSchart/ChronostratChart2013–01.pdf).

Cambrian to Silurian rocks of the Esla nappe region are dominantly siliciclastic, and the Devonian rocks of the whole of the study unit consist of an alternation of siliciclastic and carbonate formations (Fig. 3). The sediments of this succession were mainly deposited in shallow-water marine environments. The conformable Carboniferous succession is dominantly calcareous in its basal part, but it culminates with a siliciclastic succession in turbidite facies (Prioro Group).
The syntectonic Carboniferous rocks of the Guardo–Valderrueda basin rest unconformably on the above succession (Fig. 3). They consist of several siliciclastic sequences separated by syntectonic unconformities (Alonso, Reference Alonso1982a , Reference Alonso b , Reference Alonso1987a ). Some of these unconformities are evident on the map of Figure 4. In the southern part of the Esla nappe region, an E–W band of late-orogenic coal-bearing rocks (Sabero Group; Kasimovian age) crops out unconformably on rocks of the preorogenic succession and on late Moscovian rocks. The marine character of the synorogenic succession dominates in the lower part of the succession, but the amount of continental sediments increases upwards, prevailing in the Kasimovian sediments. Development of the Carboniferous cover is the result of the sedimentation of materials coming from several neighbouring source areas, mainly the Valsurbio region to the east, the Esla nappe region to the west and the extension of the Westastur-leonese Zone to the south (Aller et al. Reference Aller, Alonso and Pérez-Estaún1985; Alonso, Reference Alonso1987a ). The latter is part of the internal zone of the orogen, and is hidden below the Mesozoic–Cenozoic cover located to the south of the study area.
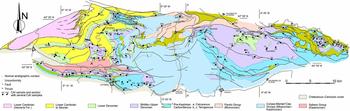
Sample locality map of the Esla–Valsurbio unit (geology from Alonso, Reference Alonso1987a ; J.A. Marín, unpub. thesis, 1997). West of line A–A’, E-samples; east of line A–A’, V-samples (see Table 1).

The Esla nappe region is formed by several thrust units with associated folds (Figs 2, 4) (de Sitter, Reference de Sitter1959; Rupke, Reference Rupke1965; Arboleya, Reference Arboleya1981; Alonso, Reference Alonso1987a , Reference Alonso b ). As in the rest of the CZ, the main décollement level of the thrusts is located at the base of the Láncara Formation (Lower–Middle Cambrian). Displacement of the thrust units was probably firstly northwards and later towards the NE, with an accumulated displacement of c. 90 km (Alonso, Reference Alonso1987a ). Since the thrusts are unconformably covered by late Moscovian rocks, their motion took place during the late Bashkirian – Moscovian. Deformation of the unconformable Carboniferous rocks indicates that, subsequent to the motion of the thrust units, the area was affected by N–S-shortening, which was probably related to the southwards motion of the last Variscan thrust unit of the CZ (Picos de Europa unit, Fig. 1). This shortening involved a tightening of folds, with a rotation of their axial surfaces, and of the thrusts, which went on to develop a high southwards dip. Finally, the Alpine deformation gave rise to a southwards thrust in the boundary of the study area with the Duero basin. This produced an overturning of the Mesozoic–Cenozoic rocks of the cover, and also contributed to the tightening of folds and the rotation of folds and thrusts (Alonso et al. Reference Alonso, Pulgar, García-Ramos, Barba, Friend and Dabrio1996). Moreover, the Alpine deformation gave rise to the reactivation of several faults, such as the Sabero Fault (Fig. 2).
The structure of different parts of the Valsurbio region has been studied by several authors (de Sitter, Reference de Sitter1962; Koopmans, Reference Koopmans1962, Reference Koopmans1964; Pulgar, Reference Pulgar1973; Rodríguez-Fernández et al. Reference Rodríguez-Fernández, Heredia, Lobato and Velando1985; Marín et al. Reference Marín, Pulgar and Alonso1995; J.A. Marín, unpub. thesis, 1997). The Variscan structure of this region consists of two thrust sequences (J.A. Marín, unpub. thesis, 1997). The thrusts of the first sequence are NE-directed and have a folded trend; some of these structures do not affect the rocks of the Carboniferous cover, but others cut these rocks and have been interpreted as reactivated thrusts. The thrusts of the second sequence are NW-directed and have various associated recumbent folds. As in the Esla nappe region, late Variscan N–S-shortening gave rise to a tightening of the folds and a rotation towards a near-vertical position of the thrusts. This rotation mainly affected the thrusts of the second sequence.
A well-developed cleavage appears in the unconformable Carboniferous rocks of the Guardo–Valderrueda basin and in the Palaeozoic rocks of the Valsurbio region (Alonso, Reference Alonso1987a ; J.A. Marín, unpub. thesis, 1997). This cleavage cuts most of the Variscan folds and originally had a small dip mainly to the NE. In the Valsurbio dome (Fig. 4) this cleavage has been folded into an antiform as a result of the Alpine deformation. This deformation is associated with a hanging-wall ramp of the south-directed Alpine thrust, and gave rise to a new tightening of the folds and to the overturned position of the southern limb of the Valsurbio dome and the thrusts located in it (Marín et al. Reference Marín, Pulgar and Alonso1995; J.A. Marín, unpub. thesis, 1997).
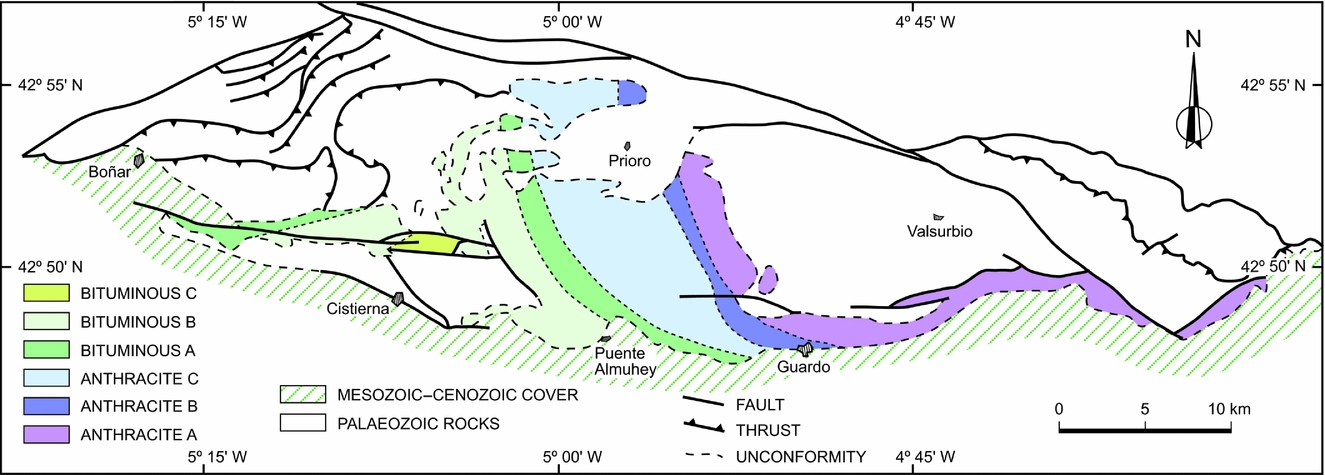
Some regional studies of the Valsurbio region or the whole CZ have shown the existence of the very-low- or low-grade metamorphism in the Valsurbio region and diagenetic conditions in the Esla nappe region (Koopmans, Reference Koopmans1962; Raven & van der Pluijm, Reference Raven and van der Pluijm1986; Keller & Krumm, Reference Keller and Krumm1993; Marín et al. Reference Marín, Villa, García-López and Menéndez1996; J.A. Marín, unpub. thesis, 1997; García-López et al. Reference García-López, Bastida, Brime, Aller, Valín, Sanz-López, Méndez and Menéndez-Álvarez1999, Reference García-López, Brime, Valín, Sanz-López, Bastida, Aller and Blanco-Ferrera2007). Colmenero & Prado (Reference Colmenero and Prado1993) and Colmenero et al. (Reference Colmenero, Suárez-Ruiz, Fernández-Suárez, Barba and Llorens2008) found a progressive increase eastwards of the Carboniferous coal rank between the Esla nappe region and the Valsurbio region (Fig. 5). Coals change from medium coal-rank (bituminous B, A) to high coal-rank (anthracite C, B, A).
Map showing the coal rank zonation in the Esla nappe region (composed from Colmenero et al. Reference Colmenero, Suárez-Ruiz, Fernández-Suárez, Barba and Llorens2008).

3. Materials and methods
The CAI method is based on analysis of the colour changes that conodont elements undergo through a response of the organic matter to a temperature increase with time. These changes permit construction of a scale of CAI values with eight units that allows the use of the conodonts as maximum palaeothermometers for a temperature interval of between 50 and 600 °C (Epstein et al. Reference Epstein, Epstein and Harris1977; Rejebian et al. Reference Rejebian, Harris and Huebner1987). It is used mainly in carbonate rocks.
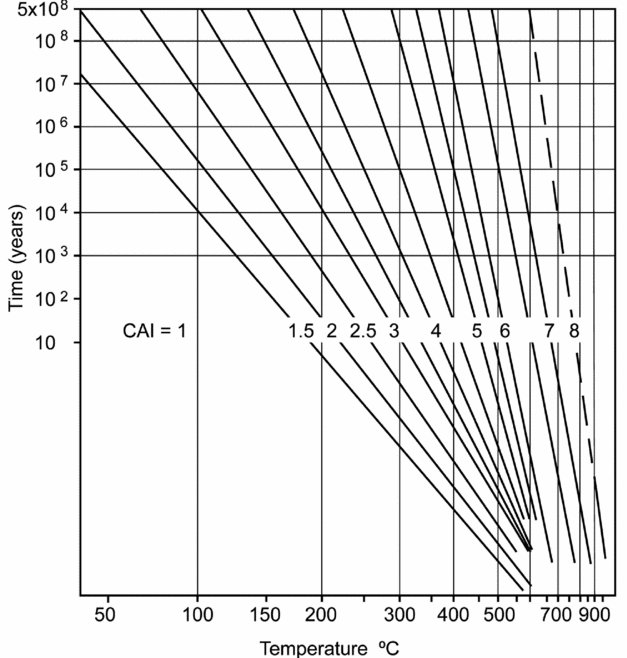
In order to obtain the palaeotemperatures from different CAI values, the Arrhenius plot developed by Epstein et al. (Reference Epstein, Epstein and Harris1977) and Rejebian et al. (Reference Rejebian, Harris and Huebner1987) is used. This plot permits an estimation of the temperature reached by the conodonts as a function of the heating time and the CAI value (Fig. 6). Application of this plot requires the assumption of a heating time for the conodonts. This poses a problem because in nature the heating temperature varies with time, whereas the Arrhenius plot involves heating with a constant temperature. The maximum heating time is obviously the age of the rock. Nevertheless, it is possible to further constrain this maximum time. Observation of the Arrhenius plot allows us to deduce that the development of a specific CAI value requires a minimum temperature. For example, in an Ordovician rock, development of CAI = 5 requires at least 285 °C (Fig. 6). It is reasonable to assume that a lower temperature does not contribute to the development of that CAI value. Hence, assuming an adequate palaeothermal gradient in agreement with the available thermal data, the time elapsed from the deposition of the sediment to the development of the minimum burial temperature necessary to obtain the CAI value can be neglected. Consequently, the maximum time period of heating begins when the rock reaches the minimum temperature to produce the specific CAI of the conodont, and it ends when some geological event indicates the cooling of the rock.
Arrhenius plot to obtain temperature from the CAI value (on the lines) and the heating time (from Rejebian et al. Reference Rejebian, Harris and Huebner1987).

In the Esla nappe region we consider that this period ended at the late Moscovian, when intense erosion had already occurred and the thrusts were covered by unconformable Carboniferous rocks (Fig. 4). In the Valsurbio unit, the pre-Moscovian succession is not thick enough to produce the minimum temperature necessary to give rise to the observed CAI values. In agreement with the age of the metamorphism analysed below, we therefore consider that the heating period began at the boundary Kasimovian–Gzhelian and ended at the beginning of the Triassic (c. 50 Ma). In any case, the difference in heating temperature obtained between a maximum heating period of 10 Ma and one of 100 Ma is lower than 20 °C, independently of the CAI value. In agreement with other authors (Patrick et al. Reference Patrick, Evans, Dumoulin and Harris1985; Rejebian et al. Reference Rejebian, Harris and Huebner1987), the minimum period of heating considered here is 1 Ma.
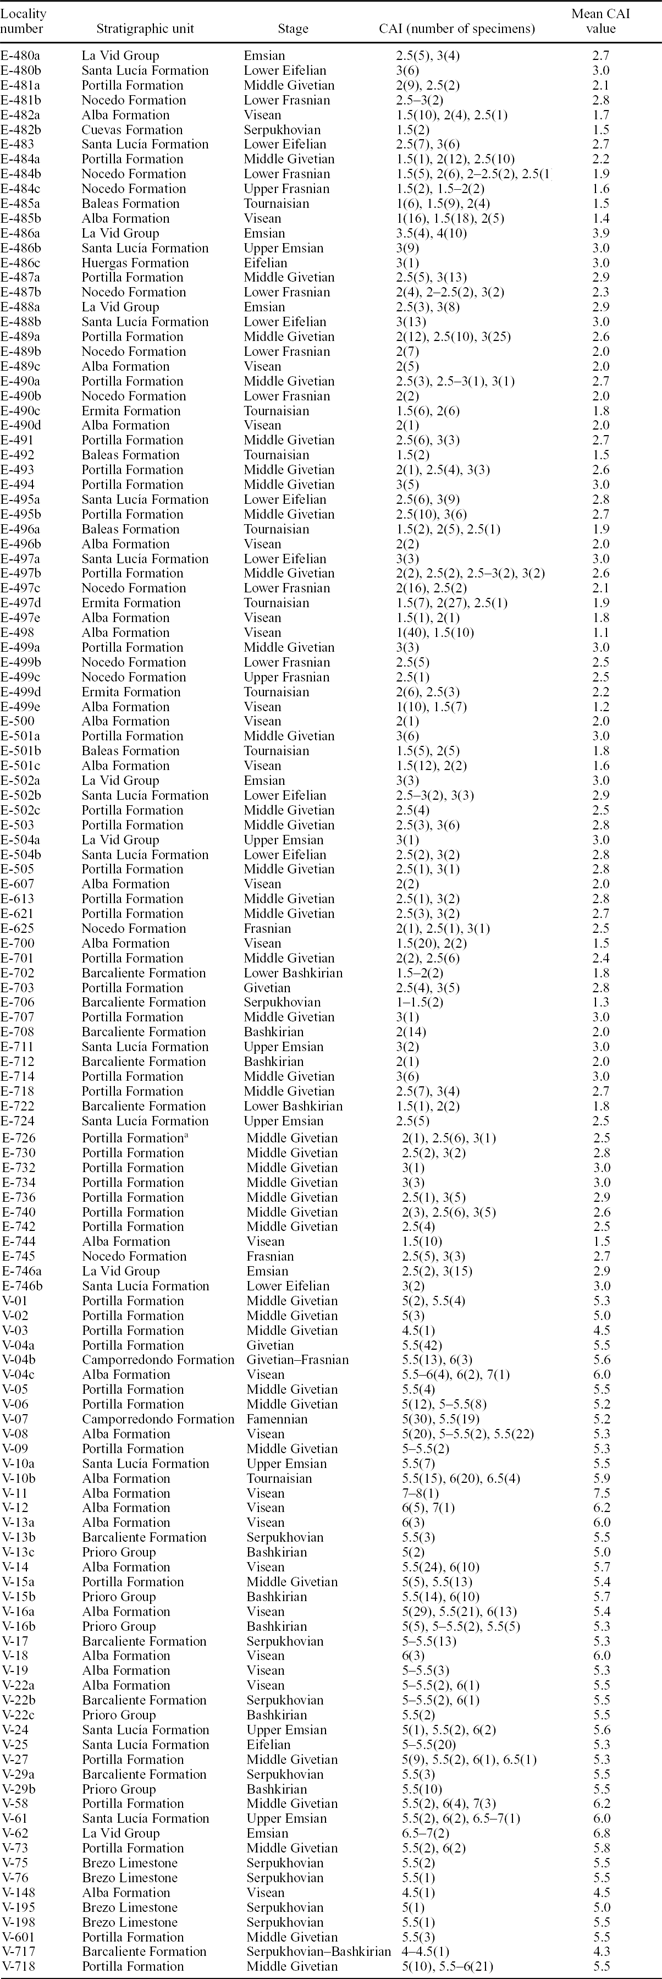
All the previously available information about conodonts from the Esla–Valsurbio unit, corresponding to the collections in the University of Oviedo (Spain) and in the National Museum of Natural History at Leiden (the Netherlands), has been checked. This collection of samples incorporated data from 80 localities in the study area, and these were complemented by the 93 new localities sampled for this study, 50 of which yielded conodonts and enabled CAI determination (Table 1). Due to the lack of conodont-bearing carbonate rocks in the Lower Palaeozoic rocks and upper Bashkirian–Kasimovian rocks, the information given by CAI data is restricted to the zones with outcrops of Devonian – lower Bashkirian rocks. The methodology used for sample treatment and CAI determination has been described in García-López et al. (Reference García-López, Brime, Bastida and Sarmiento1997) and Bastida et al. (Reference Bastida, Brime, García-López and Sarmiento1999).
Conodont colour alteration index (CAI) values and temperatures inferred from the CAI Arrhenius plot (Epstein et al. Reference Epstein, Epstein and Harris1977; Rejebian et al. Reference Rejebian, Harris and Huebner1987). (E-samples: Esla nappe region; V-samples: Valsurbio region.)

aSample E-726 was collected from reworked pebbles of the Portilla Formation included in conglomerates of the Cea Group.
For the metamorphic zonation from CAI data, we use the terms defined by García-López et al. (Reference García-López, Bastida, Aller and Sanz-López2001): diacaizone (CAI < 4), ancaizone (4≤CAI ≤ 5.5) and epicaizone (CAI > 5.5). These zones result from the correlation between the CAI values and the KI values for the anchizone boundaries in areas where the two indices have been used together. At each locality, the mean CAI value has been used for contouring of the CAI data on the map. In order to establish a relationship between the textural features of conodonts and the thermal conditions, the textures were analysed under optical and scanning electron microscopes.
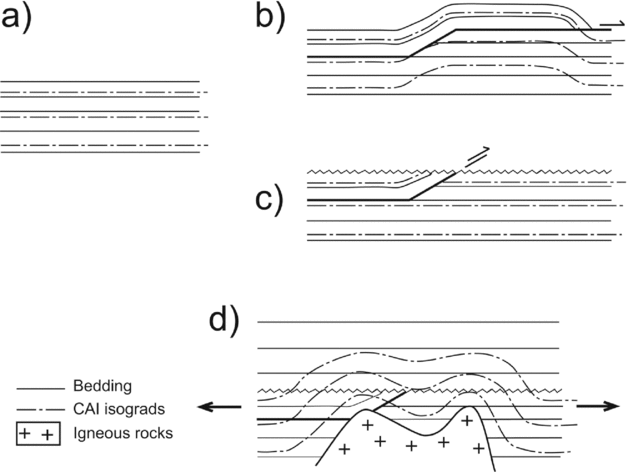
Interpretation of the results is mainly based on the cartographic analysis of the CAI isograds. Four relevant conceptual patterns of isograds are represented in the sections of Figure 7. Figure 7a shows the CAI isograds resulting from a sedimentary burial. In Figure 7b, a thrust has occurred and erosion is absent or very slow. In this case, a thermal re-equilibration has occurred meaning that the isograds are essentially continuous through the thrust; this is a tectonic burial. In Figure 7c, a quick and intense erosion coeval with the development of a thrust has taken place. In this case the isograds are displaced by the thrust, thermal re-equilibration has not occurred and a discontinuity in the trend of the isograds appears. A jump of these isograds is generated by the displacement of the thrust and a superimposition of higher-grade isograds on lower-grade isograds (discontinuous metamorphic inversion). In Figure 7d, a post-orogenic extensional episode with an associated thermal dome has occurred. A post-orogenic metamorphism has developed and the isograds cut the main structures generated during the orogenic deformation.
Sections showing several idealized patterns of CAI isograds. (a) Sedimentary burial; (b) tectonic burial with thermal re-equilibration after the development of a thrust; (c) discontinuity of the isograds after the development of a thrust with quick and intense coeval erosion (there is no thermal re-equilibration); (d) CAI isograds cutting the main structures generated by the orogenic deformation as a result of a post-orogenic extensional episode.

4. Results and interpretation
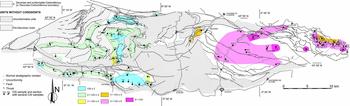
The results obtained are shown in Table 1 and the map of Figure 8. Analysis of this map reveals very different CAI values in the two regions of the study area.
Map with location of conodont colour alteration index (CAI) values and delimitation of equal CAI contours.

4.a. CAI values in the Esla nappe region
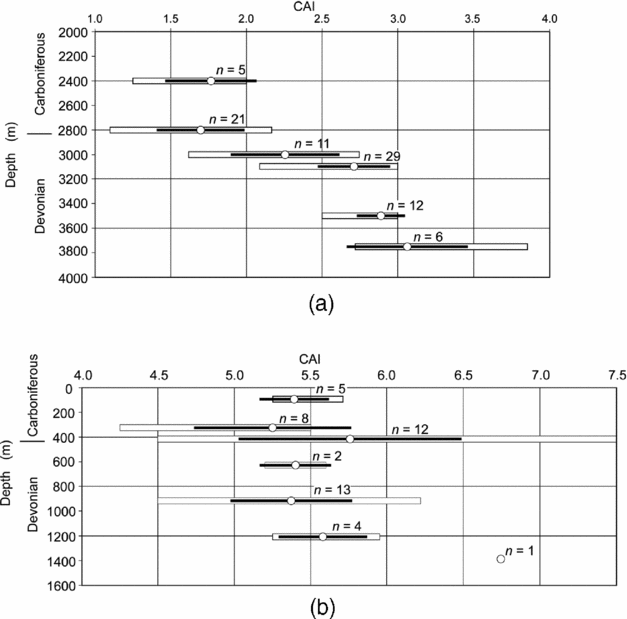
All of the CAI data indicate diacaizonal conditions in this region (Table 1, E-samples). Two main CAI levels can be distinguished: one mainly associated with Devonian rocks with CAI > 2; and another mainly associated with Carboniferous rocks with CAI ≤ 2. The isograd for the CAI value 2 roughly follows the trend of the stratigraphic contacts. Distribution of mean CAI values for the different formations shows an increase in values as the rock age increases, with an exception in the Barcaliente Formation (Serpukhovian–Bashkirian age) where the mean CAI is slightly higher than in the underlying formation (Fig. 9a). This anomaly could be due to the influence of the lithology on the CAI value; the high content in organic matter of the black limestones of the Barcaliente Formation can favour the appearance of a somewhat anomalously high CAI value, as described by Königshof (Reference Königshof1991) and Helsen (Reference Helsen1997) in other areas.
Variation of the mean CAI values (white circles) with depth in (a) the Esla nappe region and (b) the Valsurbio region. The reference datum for the depth is the unconformity surface of the Carboniferous cover of the Guardo–Valderrueda basin (base of the Pando Group). Black lines, standard deviation; white bars, range. In these plots, the mean, standard deviation and range of the CAI values for the conodont samples corresponding to each lithostratigraphic unit are shown. The results for each unit are located in the diagrams at the halfway depth for the whole unit.

The CAI pattern described above can be interpreted as a result of burial previous to the development of the thrusts. In contrast, a CAI pattern associated with the tectonic superimposition due to the emplacement of thrusts, which would involve a higher CAI value in the lower thrust units, is not observed. Furthermore, a CAI pattern related to a burial due to the presence of unconformable Carboniferous rocks (Guardo–Valderrueda basin), involving boundaries of the CAI zones cross-cutting the previous thrusts and folds, is not observed either.
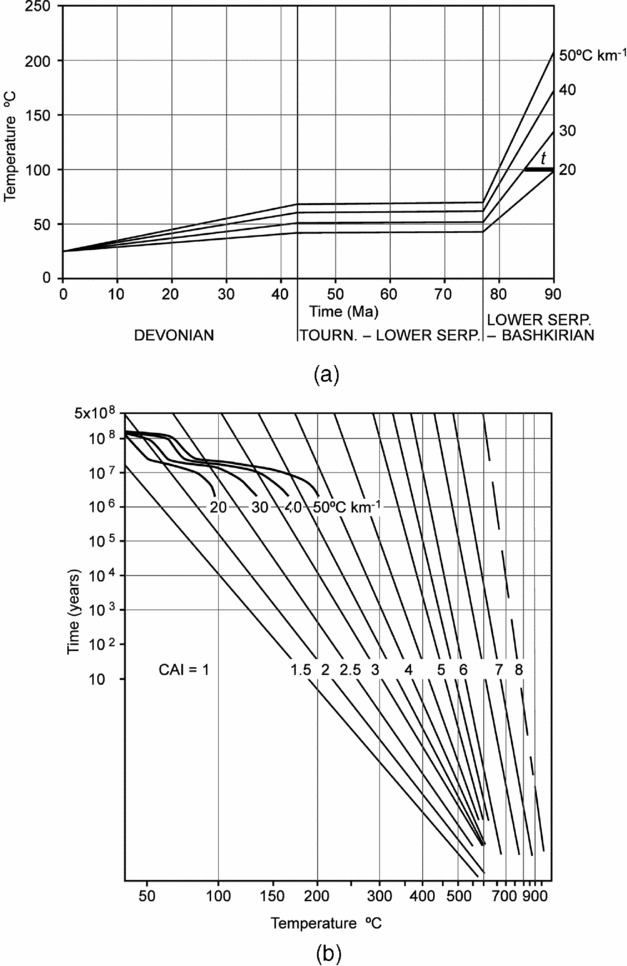
The CAI pattern due to burial allows us to estimate the geothermal palaeogradient involved in the CAI development (García-López et al. Reference García-López, Bastida, Aller and Sanz-López2001; Voldman et al. Reference Voldman, Bustos-Marún and Albanesi2010). The results obtained by the method described by García-López et al. (Reference García-López, Bastida, Aller and Sanz-López2001) are shown in Figure 10. Times considered in this figure correspond to the time that has elapsed since the moment of the deposit of the oldest conodont-bearing sediments (Emsian age in the La Vid Group) in the area. Assuming different geothermal gradients (20, 30, 40 and 50 °C km−1) and using the thickness of the stratigraphic units for each time interval, we can determine the temperature reached by the oldest rocks (Emsian age) at the end of each interval. For example, with a geothermal gradient of 30 °C km−1 the temperature reached by the Emsian rocks at the end of the Devonian is c. 50 °C (Fig. 10a). Three segments are obtained for each gradient in Figure 10a, each corresponding to a sedimentation rate with small variations (the slope of each segment is proportional to the mean sedimentation rate). Assuming a cooling time equal to the heating time (in agreement with García-López et al. Reference García-López, Bastida, Aller and Sanz-López2001, which hardly affects the final result), it is possible to estimate how long the rock was above a specific temperature from a given geothermal palaeogradient line. In Figure 10a for example, for a gradient of 30 °C km−1 the time during which the rock was above 100 °C would be 2t (taking into account the cooling time). The points obtained in this way can be plotted on the Arrhenius diagram and joined to obtain a curve for each palaeogradient (Fig. 10b).
Graphics to obtain the geothermal palaeogradient from CAI data of the La Vid Group (Lower Devonian), from age and thickness of the lithostratigraphic units. (a) Temperature–time diagram for several palaeogradients; (b) Arrhenius plot (based on Epstein et al. Reference Epstein, Epstein and Harris1977; Rejebian et al. Reference Rejebian, Harris and Huebner1987) with the T–t path for several palaeogradients.

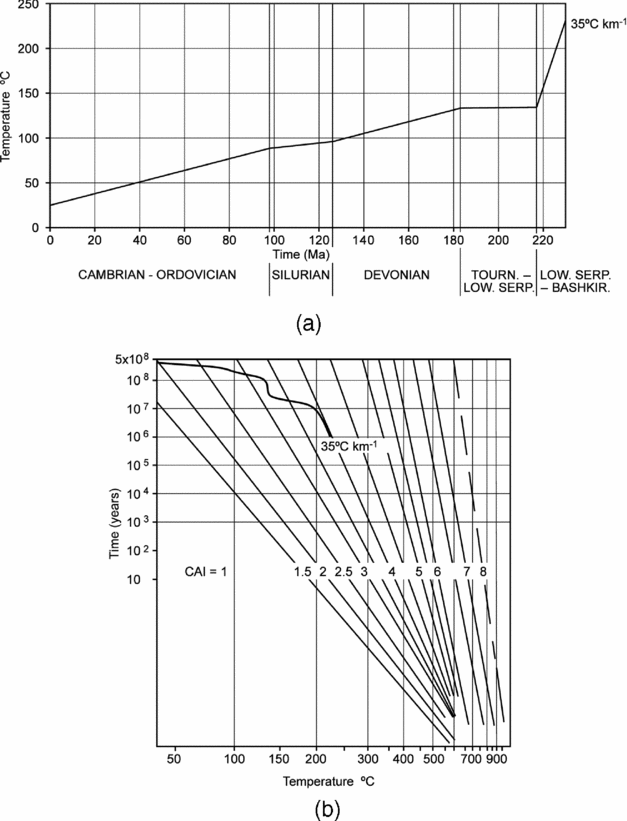
The mean CAI value in the La Vid Group is 3.1; in Figure 10b we can observe that the line representative of CAI 3 is located between the highest temperature part of the curves corresponding to the gradients of 30 and 40 °C km−1. This suggests a geothermal palaeogradient of c. 35 °C km−1; this value has been used to estimate the heating time in the E-samples in Table 1. This value probably represents a maximum value, because the top of the younger stratigraphic unit prior to the thrust unit's emplacement (Prioro Group) is not visible on the map in Figure 4 and the thickness considered for this unit is a minimum value. In agreement with Figure 10, the CAI of 3 required a temperature of 140–150 °C maintained during a time shorter than 4 Ma. Extrapolation to the Lower Cambrian rocks in the Arrhenius diagram using the geothermal palaeogradient estimated above (35 °C km−1) allows us to determine that the maximum temperature reached in these rocks during this event was between 210 and 230 °C, corresponding to a potential CAI value slightly lower than 4 (Fig. 11).
Extrapolation of the CAI values and the corresponding temperatures to the Cambrian rocks assuming a geothermal palaeogradient of 35 °C km−1. (a) Temperature–time diagram and (b) Arrhenius plot (based on Epstein et al. Reference Epstein, Epstein and Harris1977; Rejebian et al. Reference Rejebian, Harris and Huebner1987).

An important conclusion of the CAI distribution is that the CAI values were not affected by the tectonic superposition of rocks due to the emplacement of the thrust units. This involves a quick and intense erosion of these units before the thermal equilibrium, altered by the superposition, was reached and a normal geothermal gradient was re-established. This evolution corresponds conceptually to the pattern of CAI isograds shown in Figure 7c. Examination of the map in Figure 4 allows us to infer that an intense erosion of all the thrust units happened during the Moscovian, when the emplacement of thrust units and the reverse movement of the Porma Fault took place and a high area was generated (Alonso, Reference Alonso1987a ). Erosion continued during the Kasimovian, with the result that the thrust units of the Esla region were an important source of sediments for the Cea Group (Aller et al. Reference Aller and Brime1985). At the end of the Kasimovian, the cartographic trace of the thrust was not very different to the present one. In fact, the way in which the unconformable rocks of the Sabero Group (Kasimovian) cut the Esla thrust indicates that the tectonic half-window described by this thrust was already present before the deposition of these sediments.
Most of the conodonts from the Esla nappe region have a sugary texture (dull, frosted to pitted surfaces). Under the scanning electron microscope, external casts and small apatite crystal microtextures (Blanco-Ferrera et al. Reference Blanco-Ferrera, Sanz-López, García-López, Bastida and Valín2011) are the most common. These modifications of the original conodont surface developed independently of the CAI values (or thermal changes) under the diacaizonal conditions of the Esla nappe region, and were mainly a result of apatite neocrystallization.
4.b. CAI values in the Valsurbio region
Unlike the Esla nappe region, all CAI values are ancaizonal or epicaizonal in the Valsurbio region (V-samples in Table 1, Figs 8, 9b). The mean CAI values of the samples from the different lithostratigraphic units range between 5 and 6, with an exception for the La Vid Group (Lower Devonian) where only the mean CAI value of a single sample is available (CAI = 6.8) (Fig. 9b). Nevertheless, Figure 9b shows a notable standard deviation and range in some cases, mainly in the Alba Formation (Mississippian). Thus, three mean CAI values in individual samples are in the interval 5>CAI>4 and four values are >6 (Table 1). In addition, the irregular distribution of CAI values makes it difficult to draw the CAI 5.5 isograd, which separates the ancaizone from the epicaizone. Examination of Figure 9b reveals the absence of a CAI gradient with depth, allowing us to discard a burial metamorphic event. Since the metamorphism seems to be associated with the originally subhorizontal cleavage that cuts the main Variscan folds, it can be interpreted as having developed in an extensional episode. This episode agrees with the common existence of metric dykes, sills and other minor intrusions of granodioritic to gabbroic composition (Loeschke, Reference Loeschke1982; Corretgé & Suárez, Reference Corretgé, Suárez, Dallmeyer and Martínez García1990). These igneous bodies are mainly located in the northern and north-eastern parts of the Valsurbio region and are associated with the major faults in the area. The cleavage is sometimes cut by the intrusive bodies and other times it crosses them. These bodies have been interpreted as coeval with the cleavage (J.A. Marín, unpub. thesis, 1997). The distribution of CAI values corresponds in this case to the conceptual pattern shown in Figure 7d.
The temperature estimated from the CAI data lies between 215 and 590 °C. Nevertheless, if the minority of CAI values <5 and >6 are not considered, the temperature interval lies between 305 and 415 °C, which includes the most common temperatures associated with this metamorphic event.
Many conodonts from this region have a subidiomorphic granular texture (García-López et al. Reference García-López, Brime, Bastida and Sarmiento1997, Reference García-López, Blanco-Ferrera and Sanz-López2006), which is due to apatite recrystallization under high temperature. The apatite crystals do not show preferential orientation and their size increases with temperature; these crystals are visible under optical microscope for CAI values of 6–7. Other features observed in some conodonts from this area are: (1) parallel microfissures defining a rough cleavage; (2) corrosion and loss of ornamentation, so that in some cases they have lost their original morphology (‘ghost conodonts’); (3) deformation (‘folding’) during the heating; and (4) a green patina probably related to presence of chlorite. In agreement with Rejebian et al. (Reference Rejebian, Harris and Huebner1987) and Kovács & Árkai (Reference Kovács, Árkai and Austin1987), these features could be the result of regional metamorphism.
The existence of a few very high CAI values, together with severe recrystallization and corrosion of the conodonts, suggests the occurrence of a local contact metamorphism with probable hydrothermal fluids activity in these cases. The igneous rocks responsible for this do not crop out in many cases, but the common presence of dykes and sills of igneous rocks in the area supports this interpretation (J.A. Marín, unpub. thesis, 1997) and hydrothermalism has been invoked to explain the thermal alteration of the coals in this area (Llorens et al. Reference Llorens, Suárez-Ruiz and Colmenero2006).
5. Comparison of results, discussion and conclusions
Due to their palaeogeographic affinity and location in the context of the CZ, the Esla nappe and Valsurbio regions have been considered as parts of the same unit (Esla–Valsurbio unit). Nevertheless, the tectonothermal evolution of these regions is different. In the Esla nappe region, all rocks indicate diacaizonal conditions, with the maximum, palaeotemperature reached controlled by burial (increasing with the age of the rocks). The maximum temperature was c. 210–230 °C for the Cambrian rocks and the geothermal palaeogradient was c. 35 °C km−1; the same value was obtained in the NW sector of the CZ (Brime et al. Reference Brime, García-López, Bastida, Valín, Sanz-López and Aller2001). The tectonic superimposition did not modify the palaeotemperature pattern prior to the emplacement of the thrust nappes and involved intense and quick erosion during the emplacement and a deposition of large amounts of sediments in the neighbouring Carboniferous Guardo–Valderrueda basin.
The Valsurbio region underwent a post-Variscan metamorphic episode in extensional conditions that deleted any vestige of rock heating by burial. The most common maximum palaeotemperatures reached during this episode lie between 305 and 415 °C, indicating very-low-or low-grade metamorphism (ancaizone and epicaizone). This temperature interval is similar to that obtained previously by J.A. Marín (unpub. thesis, 1997), who also found muscovite and chlorite in these rocks. The CAI values agree with the values of the Kübler index obtained by Keller & Krumm (Reference Keller and Krumm1993), which lie between 0.15 and 0.5Δ°2θ and correspond mostly to anchizonal or epizonal conditions. This metamorphism has associated subhorizontal cleavage which cuts the main Variscan folds. The minimum CAI value in areas with cleavage is c. 4.5. A local contact metamorphism involved temperatures up to 590 °C (CAl>6) in some areas. Chloritoid post-kinematic with respect to the cleavage has been found in this region (J.A. Marín, unpub. thesis, 1997), and its origin has been related to hydrothermalism (Brime & Valín, Reference Brime and Valín2006), probably associated with contact metamorphism. The mica b 0 parameter determined by J.A. Marín (unpub. thesis, 1997) in several samples indicates low pressure for the metamorphism in this region.
The metamorphism of the Valsurbio region extends into the neighbouring Pisuerga–Carrión unit (García-López et al. Reference García-López, Brime, Valín, Sanz-López, Bastida, Aller and Blanco-Ferrera2007), where its age can be established. In this unit, the metamorphism and the associated cleavage affect Kasimovian rocks. In addition, contact metamorphism occurred in relation to a granodiorite stock (Peña Prieta granodiorite), whose U–Pb age is 292+2/–3 Ma (Sakmarian) (Valverde-Vaquero et al. Reference Valverde-Vaquero, Cuesta, Gallastegui, Suárez, Corretgé and Dunning1999). Minerals originated by this contact metamorphism are post-kinematic with respect to the cleavage (Gallastegui et al. Reference Gallastegui, Heredia, Rodríguez-Fernández and Cuesta1990; Rodríguez-Fernández, Reference Rodríguez-Fernández1994). These data suggest that the extensional metamorphism of this region occurred near the Carboniferous–Permian boundary and probably continued as local contact metamorphism during the Permian at the same time that the intrusion of small igneous bodies occurred. The fact that one of these bodies appears to be covered non-conformably by Lower Triassic rocks (Gallastegui et al. Reference Gallastegui, Heredia, Rodríguez-Fernández and Cuesta1990) allows us to establish a time limit to this thermal episode.
The Carboniferous Guardo–Valderrueda cover provides some information about how the transition between the different tectonothermal histories of the Esla nappe region and the Valsurbio unit was produced. Unfortunately, the lack of marine carbonate beds in this cover makes it impossible to find conodonts. CAI data of 4.3 and 5 (ancaizone) in the rocks underlying the Guardo–Valderrueda basin gives an indication of this transition since these are intermediate values, lying between the highest values of the Esla nappe region and the most common values of the Valsurbio region. Variation of coal rank through this cover provides valuable information in relation to this problem. The map in Figure 5 shows a progressive eastwards increase in this rank, from bituminous B coal (diagenetic) up to anthracite A (metamorphic) (Colmenero et al. Reference Colmenero, Suárez-Ruiz, Fernández-Suárez, Barba and Llorens2008). Palaeozoic rocks with conodonts in the Esla nappe region adjacent to the Carboniferous cover area with bituminous B coal have a CAI value between 2 and 3, whereas the Palaeozoic rocks with conodonts in the Valsurbio region adjacent to the cover area with anthracite A have a CAI≥5. Taking into account the 1998 United Nations Economic Commission for Europe (UNECE) coal classification (Alpern & Lemos de Sousa, Reference Alpern and Lemos de Sousa2002), the above CAI values agree with the correlation between coal ranks, vitrinite reflectance and CAI values obtained by Sarmiento & García-López (Reference Sarmiento and García-López1996), Merriman & Kemp (Reference Merriman, Kemp and Merriman1997) and Merriman & Frey (Reference Merriman, Frey, Frey and Robinson1999) (CAI≥5 or CAI≥5.5 respectively for anthracite A, and 2<CAI<3 for bituminous B coal). In conclusion, the transition from the diagenetic zone of the Esla nappe region to the area with extensional post-Variscan metamorphism of the Valsurbio region is gradual.
The different tectonothermal evolution of the Esla nappe region and the Valsurbio region are probably related to their different location inside the CZ. General studies of metamorphism in the CZ show that metamorphism with associated subhorizontal cleavage is restricted to the core of the Ibero–Armorican arc and to a narrow band adjacent to the León Fault (Fig. 1). This core was thrust by various units with different directions of emplacement and, as a consequence, was horizontally squeezed during the Variscan orogeny. At the end of the orogeny, the horizontal compressive stresses relaxed and the vertical compression due to gravity became dominant. This change gave rise to an extensional regime with the development of low-pressure, low-grade metamorphism, subhorizontal cleavage, various normal faults and rock melting in deep levels. Hence, outcrops of small bodies of intrusive rocks are common. In some areas, this magmatism gave rise to a local contact or hydrothermal metamorphism which, as result of a progressive evolution, superimposed on the extensional metamorphism. In short, the difference between the tectonothermal histories of the Valsurbio nappe region and the Esla nappe region lies in the fact that the former underwent the post-orogenic tectonothermal processes that occurred in the core of the Ibero–Armorican arc whereas the latter, due to its location, was distant from these processes.
The Alpine deformation gave rise to a translation of rocks along faults and to limited strain, involving uplifting and intense erosion of this part of the belt. Inside the Esla–Valsurbio unit, the Alpine slip along faults was however small and did not produce an appreciable jump in the CAI values. Hence, the Alpine deformation did not substantially affect the CAI pattern.
Acknowledgements
The present study was supported by the CGL-2009-09109 project funded by the Spanish Ministerio de Ciencia e Innovación and the Fondo Europeo de Desarrollo Regional (FEDER). S. García-López acknowledges the cooperation of C.F. Winkler Prins, from the Nationaal Natuurhistorisch Museum (Leiden, The Netherlands), in facilitating access to the Cantabrian conodonts collection of this institution. C. Brime and M. L. Valín are thanked for their valuable help with fieldwork. We are grateful to reviewers Iliana Boncheva and Jonathan Imber, whose helpful suggestions allowed us to notably improve this paper.