INTRODUCTION
Understanding the causes and effects of natural climate variability requires long-term perspectives that extend beyond instrumental records. The Brooks Range in northern Alaska (Fig. 1a) is a large area of considerable interest for paleoclimate research. Sedimentary sequences and geomorphic features in the western and central parts of the 900-km-long range have been studied to reconstruct late Quaternary glacier extent (e.g., Hamilton and Porter, Reference Hamilton and Porter1975; Calkin, Reference Calkin1988; Hamilton, Reference Hamilton2003; Balascio et al., Reference Balascio, Kaufman, Briner and Manley2005; Pendleton et al., Reference Pendleton, Ceperley, Briner, Kaufman and Zimmerman2015, Reference Pendleton, Briner, Kaufman and Zimmerman2017), vegetation communities (e.g., Anderson, Reference Anderson1988; Anderson and Brubaker, Reference Anderson and Brubaker1994; Oswald et al., Reference Oswald, Gavin, Anderson, Brubaker and Hu2012), and hydroclimate variability (e.g., Anderson et al., Reference Anderson, Abbott and Finney2001; Mann et al., Reference Mann, Peteet, Reanier and Kunz2002; Finkenbinder et al., Reference Finkenbinder, Abbott, Finney, Stoner and Dorfman2015; Gaglioti et al., Reference Gaglioti, Mann, Wooller, Jones, Wiles, Groves, Kunz, Baughman and Reanier2017). Less is known about the remote eastern end of the range, where the highest mountains in the Brooks Range are situated only 70 km from the coast of the Arctic Ocean. Changes in sea-ice extent over the Beaufort Sea likely influence precipitation amounts, like in other places around the Arctic (Boisvert and Stroeve, Reference Boisvert and Stroeve2015; Kopec et al., Reference Kopec, Feng, Michel and Posmentier2016), which, in combination with other climate variables, influence the extent of mountain glaciers in this region.
Study area locations and photographs. (a) Northern Alaska showing the extent of glaciers in the Brooks Range during the late Wisconsin (pink line) (Kaufman et al., Reference Kaufman, Young, Briner, Manley, Ehlers, Gibbard and Hughes2011). Sites mentioned in the text include the following: Chukchi Sea cores ARA2B-1A (Stein et al., Reference Stein, Fahl, Schade, Manerung, Wassmuth, Niessen and Nam2017), P1/B3, and GGC-19 (Farmer et al., Reference Farmer, Cronin, de Vernal, Dwyer, Keigwin and Thunell2011); Bu = Burial Lake (Finkenbinder et al., Reference Finkenbinder, Abbott, Finney, Stoner and Dorfman2015); M = Meli Lake, and Ta = Tangled Up Lake (Anderson et al., Reference Anderson, Abbott and Finney2001); Wa = Wahoo Lake (Vachula et al., Reference Vachula, Chipman and Hu2017); LP = Lake Peters (this study); TL = Trout Lake (Irvine et al., Reference Irvine, Cwynar, Vermaire and Rees2012); HL = Hanging Lake (Kurek et al., Reference Kurek, Cwynar and Vermaire2009b). Zagoskin Lake (Kurek et al., Reference Kurek, Cwynar, Ager, Abbott and Edwards2009a) is near the bottom left corner of the map but not shown. (b) Lake Peters–Lake Schrader watershed divide (blue dashed line), Lake Peters watershed (short dashed line) showing major inflows, and 2016 glacier outlines (red lines). (c) View to the south toward Mt. Chamberlin, the glacier-clad summit in the background (filled triangle in panel b), from near the outflow of Lake Schrader. (d) View to the north across Lake Peters, with the inflow delta of Carnivore Creek in the foreground. (For interpretation of the references to color in this figure legend, the reader is referred to the web version of this article.)

Sediment that accumulates in proglacial lakes can be used to infer fluctuations in glacier size and activity. Glacial erosion produces abundant silt- and clay-sized particles (rock flour) that wash into downstream lakes where they form dense, inorganic deposits. The rock flour also causes turbidity, which reduces the penetration depth of incoming short-wave radiation and hampers autochthonous primary production. Changes in organic matter (OM) content and bulk density (BD) of such lake sediment can thereby be used to reconstruct glacier variations (e.g., Karlén, Reference Karlén1976; Nesje and Dahl, Reference Nesje and Dahl1991; Bakke et al., Reference Bakke, Lie, Nesje, Dahl and Paasche2005). Sediments in lakes situated more distally, or in less extensively glaciated catchments, have less glacier influence and instead reflect other regional hydroclimate changes that affect lake conditions and stream discharges. For example, variations in the frequency and magnitude of flood events influence the amount of OM in lake sediments as streams transport coarse particles and terrestrial OM during high-flow events (e.g., Noren et al., Reference Noren, Bierman, Steig, Lini and Southon2002; Gilli et al., Reference Gilli, Anselmetti, Glur, Wirth, Schneuwly-Bollschweiler, Stoffel and Rudolf-Miklau2013).
The primary objectives of this study were to develop the stratigraphic framework and interpret the paleoenvironmental changes from the sediments of two adjacent lakes in the northeastern Brooks Range, Alaska. The sedimentary sequence was sampled in multiple cores, up to 3.4 m long, and was analyzed for multiple biophysical properties including BD, OM, and grain-size distribution. The sequence was dated by radiocarbon analysis of 29 samples of macrofossils. Comparison with other regional glacial, lacustrine, and sea-ice records going back approximately 16 ka places this new evidence in the context of a growing body of research on deglacial and postglacial environmental changes in the Arctic.
Study site and regional setting
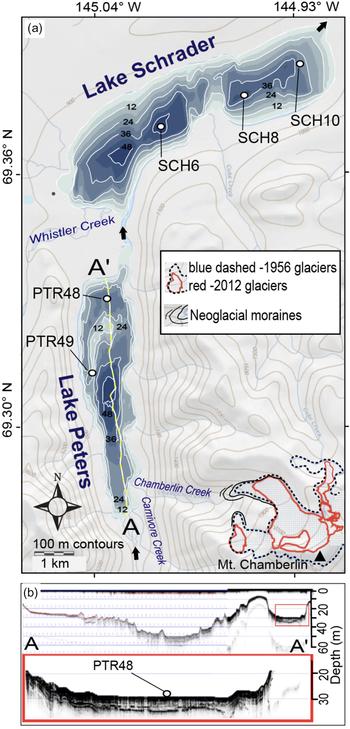
Lake Peters and Lake Schrader, also known as the Neruokpuk Lakes, are a prominent pair of lakes within a glacially eroded trough at the northern front of the easternmost Brooks Range (69.3°N, 145.0°W; 850 meters above sea level [m asl]; zmax = 48 and 54 m, respectively). Neither lake has been cored to investigate past environmental changes, although a short core from Lake Schrader was analyzed for atmospherically derived pollutants (Gubala et al., Reference Gubala, Landers, Monetti, Heit, Wade, Lasorsa and Allen-Gil1995). The lakes have a combined surface area of 20 km2 and are fed by a 320 km2 catchment within the Arctic National Wildlife Refuge (Fig. 1). They are connected by a 1-km-long, shallow interflow confined by a fan delta of a prominent drainage entering from the southwest (Whistler Creek). Lake Peters is upvalley and south of Lake Schrader and receives most of its of stream flow from Carnivore Creek, and secondarily from Chamberlin Creek, which drains the Mt. Chamberlin massif (Fig. 2). The lakes are ice covered from early October until mid-June or July, and both lakes tend to thermally stratify in summer (Hobbie, Reference Hobbie1962; Broadman et al., Reference Broadman, Thurston, McKay, Kaufman, Schiefer, Fortin and Geck2019).
Lake Peters and Lake Schrader area. (a) Topography, bathymetry, and core locations. (b) Subbottom acoustic profile of Lake Peters. Glacier outlines for 1956 (blue dashed) are based on U.S. Geological Survey Mt. Michelson (B-2) map and from aerial images for 2016 (red). Neoglacial moraines were mapped as part of this study (Benson, Reference Benson2018). (For interpretation of the references to color in this figure legend, the reader is referred to the web version of this article.)

The Lake Peters catchment contains extant, but rapidly retreating glaciers in several tributary valleys, with a combined glacier-covered area of 15 km2 (9% based on 2016 aerial photographs) out of the 171 km2 watershed (Fig. 1b). In addition to inflow from Lake Peters, Lake Schrader receives water from Whistler Creek, which drains an area of 70 km2 with 1.3 km2 (2%) of glacial cover, and Coke Creek, which drains 25 km2 with 0.08 km2 (0.3%) glacier cover.
The bedrock of the Lake Peters area is composed of Devonian to Jurassic sedimentary and meta-sedimentary rocks (Reed, Reference Reed1968). Lake Schrader is located mostly beyond the northern mountain front where it is surrounded by low ridges mantled by glacial till and colluvium (Fig. 1c). The lake is enclosed by a late-Wisconsin–aged moraine, which was designated as the reference locality for the Schrader Glaciation by Holmes and Lewis (Reference Holmes and Lewis1965). We correlate it with nearby Itkillik II moraines in the Jago and Okpilak River valleys dated to 23.2 ± 2.8 cal ka BP (Balascio et al., Reference Balascio, Kaufman, Briner and Manley2005; Briner et al., Reference Briner, Kaufman, Manley, Finkel and Caffee2005). In contrast, Lake Peters is located mostly within the mountains where it is flanked by well-defined benches of till, colluvium, alluvial fans, and steep valley walls with relief up to 1300 m adjacent to the lake (Fig. 1d).
The study area is located in the Arctic tundra biome in a region underlain by continuous permafrost with a thin active layer; vegetation is dominantly shrub tundra (dwarf willow (Salix) and birch (Betula)), with tall willows along stream courses (Jorgenson and Heiner, Reference Jorgenson and Heiner2003). We measured (Kaufman et al., Reference Kaufman, Fortin, Broadman, Thurston, Benson, Schiefer and McKay2019) hourly temperature along the shore of Lake Peters at 850 m asl from May 2015 to May 2018. Annual mean temperature at the lake was approximately −8°C, and monthly averages ranged from −20°C (January) to 10°C (July). Rainfall totaled 268 mm at 1750 m asl for the above-freezing part of 2015 and 2016. Weather stations on the nearby McCall Glacier (30 km to the east at 2200 m asl) recorded 500 mm/yr, with about half falling as snow (Wendler et al., Reference Wendler, Ishikawa and Streten1974). The McCall Glacier is classified as polythermal (Rabus and Echelmeyer, Reference Rabus and Echelmeyer1997), with relatively small mass exchanges of 20 cm (winter) and −60 cm (summer), and receives moisture from both the Bering Sea and the Arctic Ocean (Rabus and Echelmeyer, Reference Rabus and Echelmeyer1998).
METHODS
Lake coring
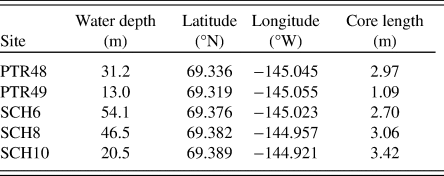
Multiple sediment cores were extracted from the two lakes in April 2016. In this study, we focus on the longer sequences recovered from two sites in Lake Peters and three in Lake Schrader (Table 1). The coring followed a survey of subbottom stratigraphy (Lake Peters only) using a Knudsen 320BP acoustic profiler (200 kHz) and bathymetric mapping using a Lowrance sonar depth recorder in August 2015 (Fig. 2a and b). Water depth at the core sites ranged from 13 to 55 m including approximately 1 m of ice at the time of coring. Five aluminum-cased vibracores ranging in length from 1.1 to 3.4 m were collected using a Rossfelder P-3 underwater vibracorer and were cut into shorter sections in the field for transport. Cores sites were selected in areas that displayed undeformed acoustic stratigraphy or were located in depositional centers (Lake Schrader). A corresponding surface core was taken at each site using a Uwitec gravity corer with slide hammer and polycarbonate core tube. Surface-core stratigraphy was correlated with the uppermost sections of adjacent vibracores based on prominent color bands. Depths are referenced relative to (below) the lake floor (blf).
Core site locations and total length of cores from Lakes Peters (PTR) and Schrader (SCH). A vibracore and a surface core were collected from each site in 2016.

Sedimentologic analyses
Cores were split and initially analyzed using a multisensor core logger (MSCL) at 0.5 cm intervals at the Lacustrine Core Facility (LacCore), University of Minnesota. The MSCL utilized 137Cs-sourced gamma attenuation to measure wet bulk density (WBD), a surface sensor to measure magnetic susceptibility (MS) on surface cores only (vibracores are in aluminum tubing, which distorts MS measurements), and a Geoscan V-5000-pixel linescan camera for high-definition core images. One-half of each split core was archived at LacCore, and the working halves were shipped to Northern Arizona University for sampling and analysis.
Dry bulk density (DBD) and OM content were measured on 1 cm3 aliquots sampled at 5, 2, 2, 2.5, and 2 cm intervals for PTR48, PTR49, SCH6, SCH8, and SCH10, respectively. Sample intervals were chosen based on inferred deposition rates to capture sub-centennial-scale variability. Volumetric samples were oven-dried overnight (12 hours) at 85°C and weighed to obtain DBD. Samples were then heated to 550°C for 5 hours and reweighed to determine percent weight loss-on-ignition, which was used to estimate the OM content. Replicate analyses show that the reproducibility of the results is high, especially compared with down-core fluctuations, which are an order of magnitude higher. Duplicate samples returned OM values that differed by an average of 0.23% (n = 31) (Benson, Reference Benson2018).
Grain-size distributions were measured every ~10 cm using a Coulter LS230 laser diffraction particle-size analyzer. Thirty samples from three cores (PTR48, SCH8, and SCH10) were pretreated with 30% H2O2 and then heated overnight at 50°C to remove organics. Additionally, 10% Na2CO3 was added for 5 hours to eliminate biogenic silica. The pretreated samples were deflocculated by adding sodium metahexaphosphate and shaking for 1 hour before performing particle-size analysis.
Geochronology
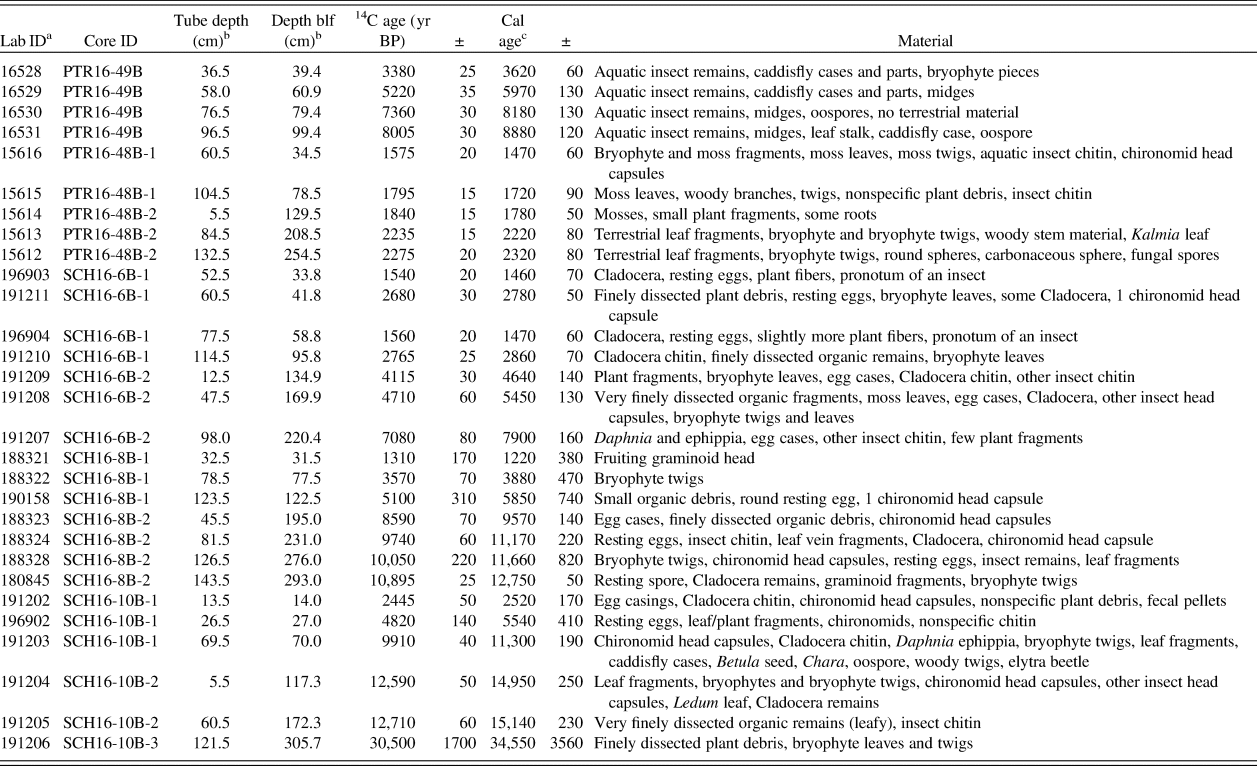
In total, 29 samples of organic material for radiocarbon analysis were taken from the vibracores (Table 2). Sediment samples, each 1 cm thick (except one), were wet-sieved (150 µm) using distilled water mixed with sodium metahexaphosphate as a deflocculant to isolate macrofossils. Because macrofossils from terrestrial plants are scarce in the sediment, most samples consisted of a mixture of terrestrial and aquatic organic materials, which was needed to gather a sufficient sample mass. Samples were analyzed for 14C at the Keck Carbon Cycle AMS Facility at the University of California, Irvine. 210Pb and 137Cs profiles from PTR48 and SCH8 were measured at the University of Southern California (Table 3). Classical age-depth modeling using 14C ages, radionuclides, and the sediment-water interface (2016) was performed with a cubic spline (SCH8) or smooth spline (PTR49, PTR48, SCH6, and SCH10) using the clam v. 2.1 code (Blaauw, Reference Blaauw2010), except for the lower portion of SCH10, which used linear interpolation to model the dramatic shift in sedimentation rate in this section of the core. The 14C ages were calibrated using CALIB 7.1 (Stuiver et al., Reference Stuiver, Reimer and Reimer2018), and all ages are reported as calendar years, or thousands of years, before present (= AD 1950), hereafter abbreviated as “yr” and “cal ka BP,” respectively.
Radiocarbon dates and calibrated ages showing median probability ± one-half of the 2-sigma error range. blf, below the lake floor.

aKeck Carbon Cycle AMS Facility, University of California, Irvine.
bCentered sample depth; samples 1.0 cm thick, except for 188324, which was 3 cm thick.
cMedian probability ± one-half of the 2-sigma range; calibrated using CALIB 7.1 (Stuiver et al., Reference Stuiver, Reimer and Reimer2018)
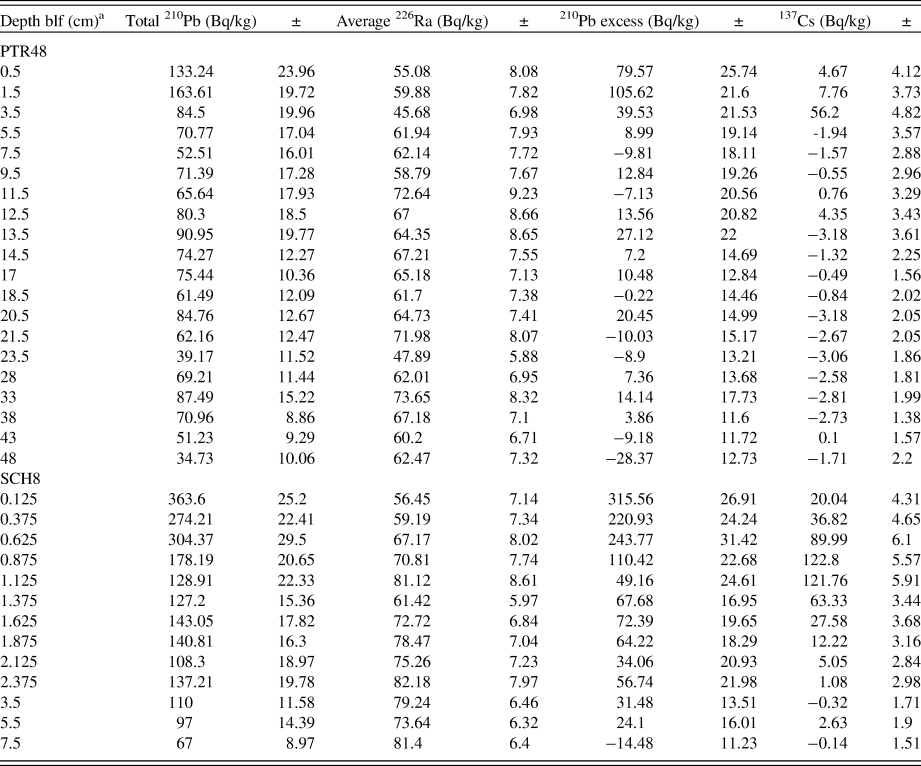
Activity profiles for the short-lived isotopes, 210Pb, 226Ra, and 137Cs, from the surface cores PTR48 and SCH8. blf, below the lake floor.

aDepth is measured to middepth of sample.
RESULTS
Geochronology and sedimentation rates
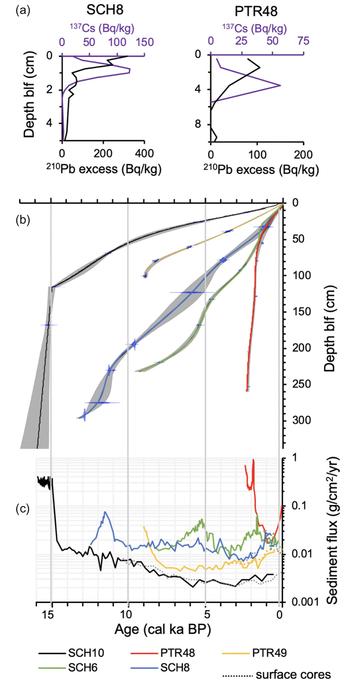
Sedimentation rates across the five sites vary by two orders of magnitude (Fig. 3b and c). The northernmost core from Lake Peters (PTR48), located near the delta of Whistler Creek at a water depth of 31.2 m (Fig. 2a), extends back to only 2.3 cal ka BP, with the highest and most variable sedimentation rates. The vertical accumulation rate in this core varies between 1 and 5 mm/yr in the lower portion of the core, with a sharp decrease to 0.53 mm/yr in the upper 70 cm.
Age-depth models for cores from Lake Peters (PTR) and Lake Schrader (SCH). (a) 137Cs and 210Pb excess profiles for SCH8 and PTR48 (Table 3). (b) Radiocarbon-based age models for each of the five cores using the clam v. 2 code (Blaauw, Reference Blaauw2010). Blue shapes are probability density functions of radiocarbon calibrated ages. Gray shading indicates 95% confidence range. Data are in Table 2. (c) Sediment flux on semilog plot. Dotted lines are corresponding surface cores. blf, below the lake floor. (For interpretation of the references to color in this figure legend, the reader is referred to the web version of this article.)

Short-lived isotope profiles constrain recent sedimentation rates; assuming the rate of supply of unsupported 210Pb has remained constant, an exponential fit of unsupported 210Pb activity indicates an average sedimentation rate of 1.06 ± 0.31 mm/yr for sediments deposited during the last century (Fig. 3a, Table 3). This compares with 137Cs peak activity at 35 mm depth, which we correlate with the spike in atmospheric weapons testing, indicating an average sedimentation rate of 0.66 ± 0.09 mm/yr since the 1963 peak. The low sedimentation rates implied by the 210Pb and 137Cs activities agree within their analytical uncertainty. Accounting for BD, the average mass accumulation rate over the last 400 yr (upper 15 cm of PTR48) is 0.047 g/cm2/yr and is similar to previous estimates for the north end of Lake Peters (Thurston, Reference Thurston2017).
Nearby, PTR49 (2 km to the southwest; Fig. 2a) is located on a submerged ridge at 13.0 m water depth and extends to 9.2 cal ka BP, with overall average sedimentation rates of 0.4 mm/yr in the lower 30 cm decreasing up core to 0.1 mm/yr.
In Lake Schrader, three cores form a transect from proximal (west) to distal (east) sites that decrease in water depth (SCH6 = 54.1 m, SCH8 = 46.5 m, and SCH10 = 20.5 m; Fig. 2a) and in Holocene sedimentation rates (0.28, 0.23, and 0.07 mm/yr, respectively), and extend back at least 9.2, 13.0, and 15.9 cal ka BP, respectively. Of the 29 radiocarbon ages, only 1 was stratigraphically reversed, at 41.8 cm blf in SCH6, where further inspection revealed a slump deposit. The lowest 14C sample in SCH10 dates to 34.6 cal ka BP and was not included in the age model. Instead, the approximate number of rhythmic couplets (800) below the 14C age at 172.0 cm blf roughly coincides with the projected basal age (15.9 ± 1.0 cal ka BP) using a linear sedimentation rate calculated between this and the overlying 14C age at 117.3 blf (Fig. 3, Table 2). These distinctly rhythmic layers are interpreted as clastic varves, bolstering our interpretation that the 14C age from 305.7 cm blf is composed of older reworked material. Furthermore, an age of 34.6 ka is improbable considering that the lake was likely covered by glaciers during the last glacial maximum, as implied by correlation with dated moraines in valleys to the east (Balascio et al., Reference Balascio, Kaufman, Briner and Manley2005) and west (Pendleton et al., Reference Pendleton, Ceperley, Briner, Kaufman and Zimmerman2015) of our field area. We cannot, however, exclude the unlikely possibility that the old 14C age accurately represents the age of the enclosing lake sediment and that glaciers terminated upvalley from Lake Schrader during the last glacial maximum.
Near the top of SCH8, an exponential fit of unsupported 210Pb activity indicates an average sedimentation rate of 0.28 ± 0.03 mm/yr during the last century (Fig. 3a, Table 3). The peak in 137 Cs at 11.25 mm blf (middepth of sample) suggests recent sedimentation rates of 0.21 ± 0.02 mm/yr. Both of these estimates accord with Gubala et al. (Reference Gubala, Landers, Monetti, Heit, Wade, Lasorsa and Allen-Gil1995) who found similar rates based on 210Pb and 137Cs (0.25–0.33 mm/yr), although it is unclear where in Schrader Lake their core site was located. Mass accumulation rates for the upper 8.5 cm of SCH8 are 0.014 g/cm2/yr.
Lithostratigraphy
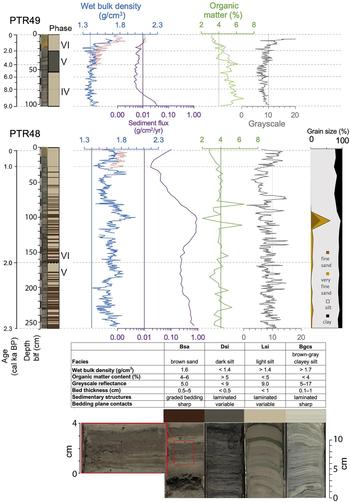
The sedimentary sequences recovered in cores from Lake Peters (Fig. 4) and Lake Schrader (Fig. 5) exhibit considerable biophysical differences among the sample sites. The proximity of individual core sites to inflow streams is a major influence on the sediment characteristics. PTR48 is located near paleochannels of Whistler Creek. It contains brown (5Y 5/2), relatively organic-rich, sandy beds ranging in thickness from millimeters to several centimeters that likely were deposited by underflows and turbidity currents. The other cores are located away from inflow deltas, generally lack these coarse-grained beds, and instead are dominantly composed of particles that have settled from suspension.
Multiparameter sediment profiles from Lake Peters (PTR) cores. PTR49 (top) and PTR48 (bottom), along with corresponding surface cores (red dotted lines). From left to right: age, depth, core face image, phases (roman numerals), gamma-ray-inferred wet bulk density, sediment flux, organic matter content, gray scale, and grain-size distribution. Lower panel shows major facies types and associated indicative properties. (For interpretation of the references to color in this figure legend, the reader is referred to the web version of this article.)

(color online) Same as for Figure 4, but for cores from Lake Schrader (SCH): SCH6 (top), SCH8 (middle), and SCH10 (bottom).

Sediments were classified into four distinct lithologic facies based on visible appearance and characteristic values for density, OM content, gray-scale reflectance, and grain-size distributions (Fig. 4). OM abundance and BD are inversely correlated, whereas other sediment variables have little or no covariance (Benson, Reference Benson2018). The stratigraphic sequence of facies in each core was correlated among the cores to form a temporal framework of six phases (sensu Bakke et al., Reference Bakke, Lie, Nesje, Dahl and Paasche2005) for the overall sedimentary sequence (Fig. 6). Theoretically, the ages of phase boundaries are synchronous across core sites, whereas the facies comprising a phase might be different depending on the depositional setting of the core site. In reality, the ages of the phase boundaries are not equivalent across all of the cores but are generally within the uncertainties of the chronologies. The ages represented in SCH10 are used as the reference because the core contains the most complete stratigraphic sequence.
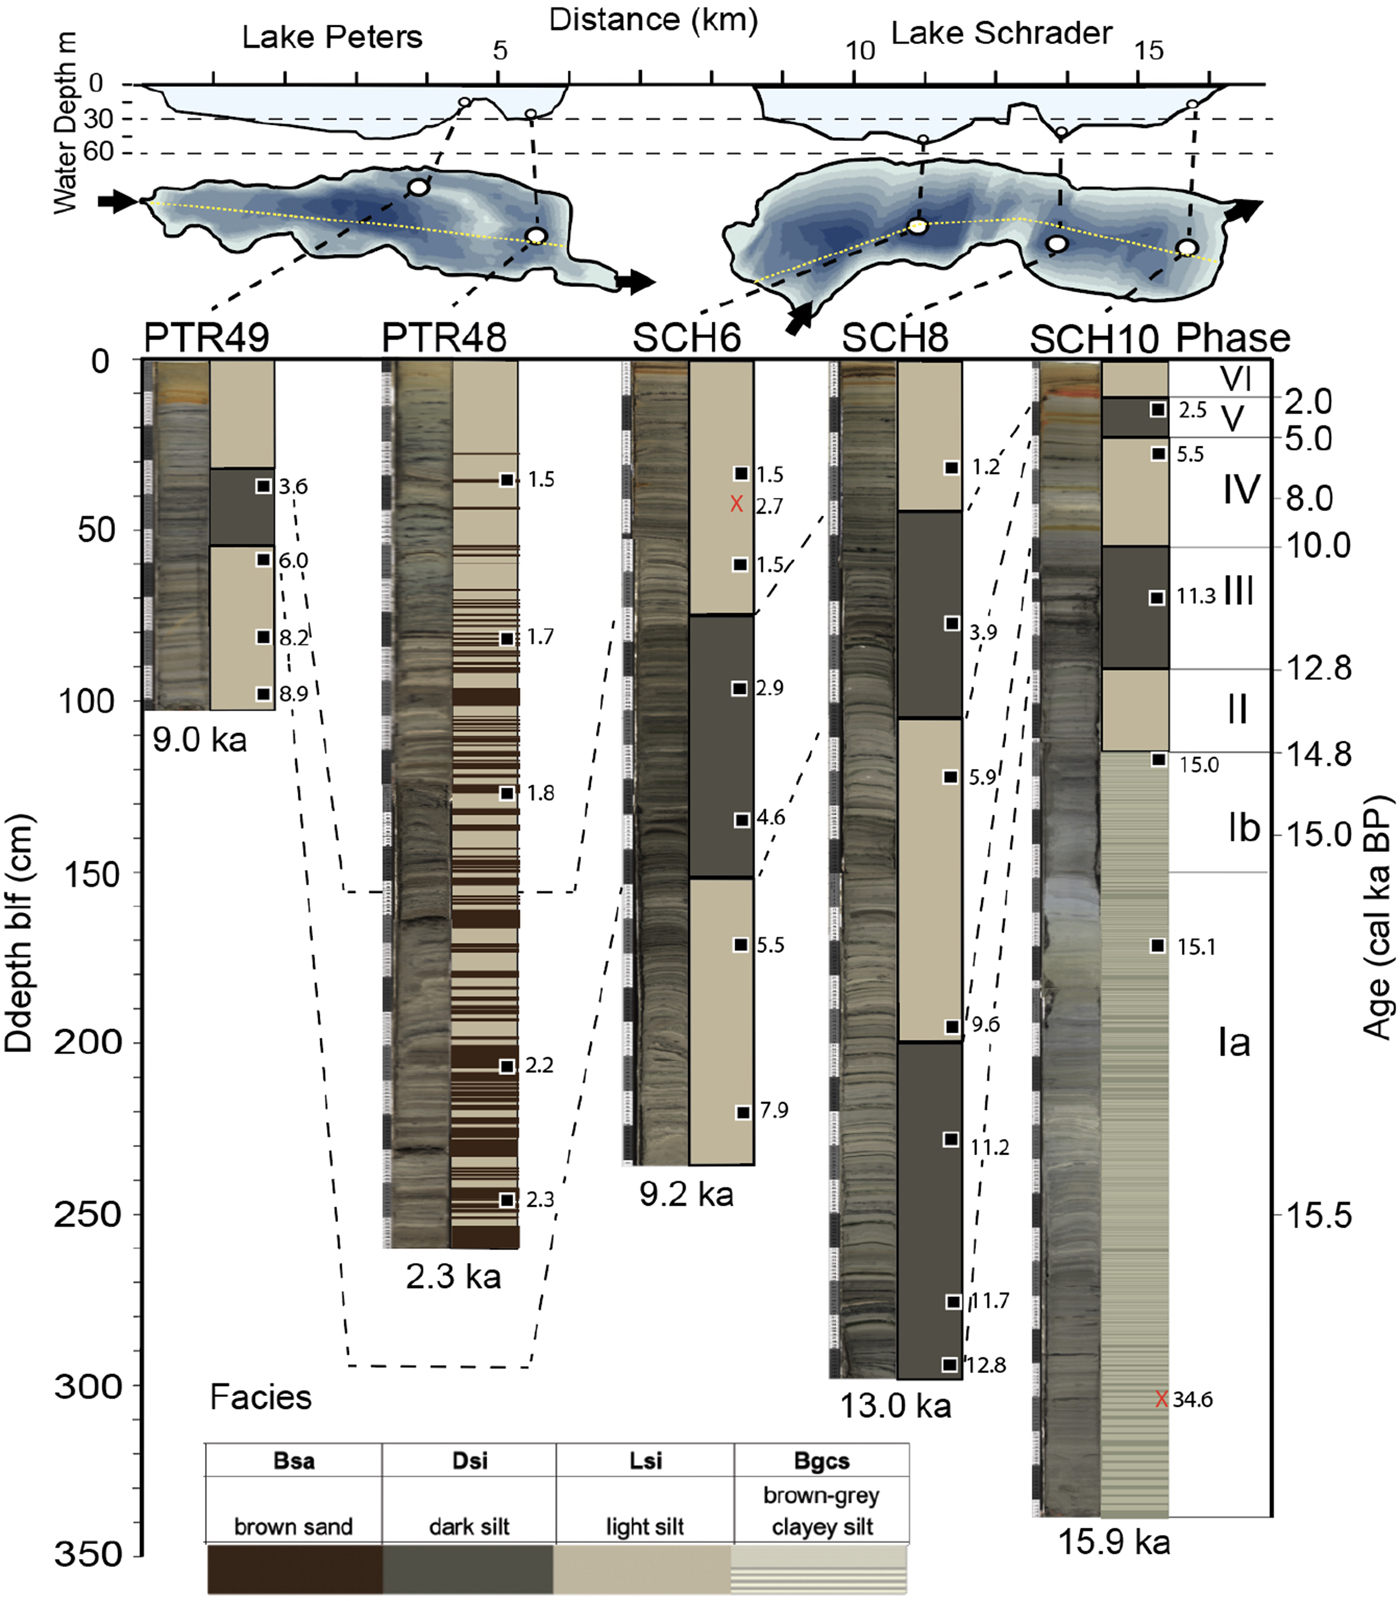
Images of cores from Lake Peters (PTR) and Lake Schrader (SCH) arranged from proximal to distal showing facies designations, correlations of depositional phases, and 14C macrofossil sample ages (samples not used in age models are noted with a red x). Water-depth profile and core locations with bathymetry showing inflows and outflows (top), and depositional phases with ages (right). See Figure 4 for facies descriptions. (For interpretation of the references to color in this figure legend, the reader is referred to the web version of this article.)

Phases Ia and Ib (15.9–14.8 cal ka BP) are represented only in the lower half of SCH10, which mainly consists of brown-gray (GLEY 6/10Y) clayey silt (Bgcs) with light tan (5Y 8/1) laminations forming distinct couplets (Figs. 4 and 5). These couplets range in thickness from centimeters at the bottom to millimeters in the upper part of the unit. Darker laminae are visibly coarse grained and fine upward into lighter laminae, exhibiting a sharp overlying contact. This rhythmically bedded sediment is distinct from overlying sediments, with some of the highest values of WBD (ranging from 1.7 to 2.1 g/cm3), highest clay content (35%), and lowest OM (<3%) content. Sediment deposited around 15 cal ka BP (phase Ib) is distinctly dense and bluish (GLEY 7/N), with the lowest OM content of lake sediment observed in this study. Sedimentation rates decrease sharply after 15 cal ka BP (Fig. 3c).
Phase II (14.8–12.8 cal ka BP) is represented only in SCH10 and consists of light-colored silt (Lsi) (Fig. 5). Color alternates between tan (5Y 7/4) and dark-olive-green (5Y 6/6) laminations, with some distinct (1–10 mm thick) dark-brown/black (5Y 3/2), relatively organic-rich layers. Around 13.5 cal ka BP, WBD decreases from 1.6 to 1.4 g/cm3. OM is generally less than 5%, and grain-size distributions are approximately 75% silt and 20% clay.
Phase III (12.8–10 cal ka BP) is represented in SCH8 and SCH10 by dark silt (Dsi). Color laminations alternate between tan (5Y 7/4) and dark olive green (5Y 6/6), with relatively frequent dark-brown/black (5Y 3/2), organic-rich layers. WBD is low in both cores and averages roughly 1.4 g/cm3. Multiple 5- to 10-mm-thick, dense, and coarse-grained beds are present in SCH8 from 280 to 270 cm blf. OM content increases to some of the highest values (~7%) in SCH10, whereas OM content in SCH8 shows predominantly low values. Grain-size distributions are >75% silt and 20% clay. Sedimentation rates increase in SCH8 between 12.5 and 11.5 cal ka BP, whereas SCH10 sedimentation rates are fairly constant.
Phase IV (10–5 cal ka BP) is represented in PTR49 and all three Lake Schrader cores by the Lsi facies. In Lake Schrader, BD reaches a maximum around 8 ka, ranging from 1.5 to 1.7 g/cm3, with OM showing correspondingly lower values (2–5%). In contrast, sediments in PTR49 show some of the highest OM (6%) and lowest density (1.4 g/cm3) values during this time, yet visually, sediments appear to have few organic-rich layers. The base of PTR49 contains two subangular, nonstriated pebbles (~1.5 cm in diameter). The vibracore was not able to penetrate past this clast-bearing sediment, suggesting the presence of an underlying sandy or stony deposit.
Phase V (5–2 cal ka BP) sediments comprise facies Dsi. Density values for Lake Schrader cores (1.3–1.5 g/cm3) are consistently among the lowest for the entire Holocene. OM increases to 6–8% and is consistently elevated across Lake Schrader cores from 5 to 2 ka. In contrast, OM content in sediments in PTR49 show a continuously decreasing trend with a stepwise drop around 3 ka. Grain-size distributions are >75% silt and 20% clay. Toward the end of phase V (2.3 ka), the lower section of PTR48 contains facies Bsa (brown sand) consisting of brown (5Y 5/2) silty sand composed of distinct 5- to 50-mm-thick beds with sharp basal contacts.
Phase VI (2 cal ka BP–present) sediment is composed of facies Lsi in all of the cores. Density increases by (0.2–0.3 g/cm3) in all cores starting around 2 ka, whereas OM decreases by (1–2%). Sediment flux increases for most cores (Fig. 3c). In PTR48, facies Bsa is absent after roughly 1.4 cal ka BP. In nearly all the cores, the upper 1–20 cm is distinctly oxidized to reddish brown (2.5Y 6/6), with cores located in shallower water tending to exhibit thicker red zones (e.g., PTR49 = 18 cm and SCH10 = 12 cm blf).
DISCUSSION
Late glacial period (phases I and II)
High-density, low-OM-content, rhythmic bedding and rapid accumulation rates suggest phase I sediments were derived from glacial and paraglacial activity. They were deposited when glaciers were close to the lake and retreated to expose unstable glacial deposits that were washed into the lake. The absence of stones indicates that glaciers had retreated upvalley of Lake Schrader during phase I. The approximate number of rhythmic couplets (800) below the 14C age at 172.0 cm blf roughly coincides with the projected basal age (15.9 ± 1.0 cal ka BP) using a linear sedimentation rate calculated between this and the overlying 14C age at 117.3 blf (Fig. 3, Table 2). These distinctly rhythmic layers are interpreted as clastic varves and bolster our interpretation that the 14C age from 305.7 cm blf represents reworked material that was stored on the landscape for tens of thousands of years prior to washing into the lake. The upward decrease in couplet thickness may represent declining sediment supply as glaciers retreated upvalley (e.g., Ballantyne and Benn, Reference Ballantyne and Benn1994).
Toward the end of phase I, between around 15.1 and 14.9 cal ka BP (phase Ib), sediment in Lake Schrader is marked by a distinct increase in density and decrease in OM values and a transition to thicker bedding (Fig. 5). Phase Ib may be a pulse of sediment eroded from freshly uncovered and perhaps ice-rich glacial deposits associated with the paraglacial period (e.g., Church and Ryder, Reference Church and Ryder1972; Leonard, Reference Leonard1997). Elsewhere in the Brooks Range, it was initially suggested (Hamilton, Reference Hamilton2003) that rapid alluviation between 15 and 13 cal ka BP represented a widespread glacier advance, and we cannot exclude the possibility that the dense, inorganic, bluish mud represents an advance of local glaciers. However, this period coincides with a pronounced retreat of mountain glaciers in multiple places in Alaska, driven by an increase in atmospheric CO2 and summer insolation (Briner et al., Reference Briner, Tulenko, Kaufman, Young, Baichtal and Lesnek2017). Additionally, multiple 10Be exposure ages on bedrock from the central Brooks Range suggest that glaciers were close to, or even upvalley of, their maximum Neoglacial extent by ~15 cal ka BP (Badding et al., Reference Badding, Briner and Kaufman2013; Pendleton et al., Reference Pendleton, Ceperley, Briner, Kaufman and Zimmerman2015). We suggest that the rapid glacier retreat and consequent sediment pulse is likely related to the Bølling transition, which began around 14.7 cal ka BP as dated in Greenland ice (Rasmussen et al., Reference Rasmussen, Andersen, Svensson, Steffensen, Vinther, Clausen and Siggaard-Andersen2006). This apparent warming trend identified in Lake Schrader sediments also overlaps within age uncertainties with a 12°C stepwise increase in July temperature inferred from chironomids from Hanging Lake, northern Yukon Territory (Kurek et al., Reference Kurek, Cwynar and Vermaire2009b) (Fig. 7).
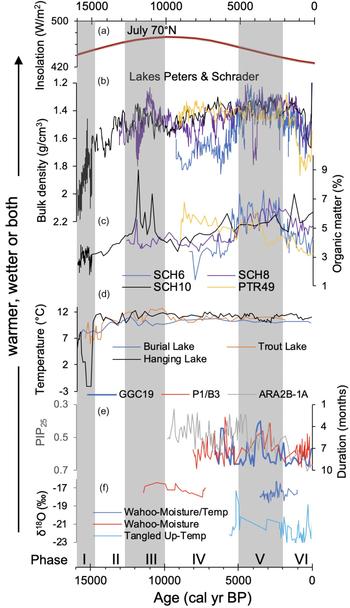
(color online) Comparison of organic matter content and wet bulk density, the two most consistent biophysical properties of the sediment cores from Lake Peters and Lake Schrader, with other proxy climate records regionally (PTR49, SCH6, SCH8, and SCH10 site locations are shown in Fig. 1). (a) July insolation at 70°N latitude (Berger and Loutre, Reference Berger and Loutre1991). Wet bulk density (b) and organic matter content (c) of sediment from Lake Peters and Lake Schrader cores. (d) Chironomid-inferred summer temperature from Burial Lake (Kurek et al., Reference Kurek, Cwynar, Ager, Abbott and Edwards2009a), Trout Lake (Irvine et al., Reference Irvine, Cwynar, Vermaire and Rees2012), and Hanging Lake (Kurek et al., Reference Kurek, Cwynar and Vermaire2009b). (e) Sea-ice cover inferred from three Chukchi Sea cores (Farmer et al., Reference Farmer, Cronin, de Vernal, Dwyer, Keigwin and Thunell2011; Stein et al., Reference Stein, Fahl, Schade, Manerung, Wassmuth, Niessen and Nam2017). (f) Oxygen isotopes in lacustrine carbonate from Tangled Up Lake (Anderson et al., Reference Anderson, Abbott and Finney2001) and Wahoo Lake (Vachula et al., Reference Vachula, Chipman and Hu2017). Depositional phases indicated by gray vertical bars.

Beginning in phase II, a distinct decrease in both density and sedimentation rate occurs after 14.8 cal ka BP. This is perhaps one of the most pronounced paleoenvironmental shifts in this study and suggests a substantial decrease in local glacier extents. Elsewhere in Alaska, Burial Lake (Finkenbinder et al., Reference Finkenbinder, Abbott, Finney, Stoner and Dorfman2015) and Cascade Lake (Steen, Reference Steen2016) show similar decreases in sediment density around 15 cal ka BP, as does Lone Spruce Pond in the Ahklun Mountains (Kaufman et al., Reference Kaufman, Axford, Anderson, Lamoureux, Schindler, Walker and Werner2012).
In comparison with clear environmental changes around 15 cal ka BP, the transition from the late glacial period to the early Holocene is less pronounced. Beginning around 13 cal ka BP, two different cores contain variable WBD values averaging ~1.5 g/cm3, similar to Holocene values (1.45 g/cm3). The cores analyzed in this study lack evidence for a Younger Dryas (YD) reversal, and no candidate YD moraines have been identified in the region. Few studies from northern Alaska have generated clear evidence for a climate fluctuation during the YD, a recent exception being isotopic evidence for YD cooling in fossil willows from the North Slope (Gaglioti et al., Reference Gaglioti, Mann, Wooller, Jones, Wiles, Groves, Kunz, Baughman and Reanier2017). Although further work is needed, the lack of signal in this study could be explained by the notion that YD cooling was mostly a wintertime cooling phenomenon (Denton et al., Reference Denton, Alley, Comer and Broecker2005) and may have had little effect on the size of glaciers dominantly controlled by summer melt in the Lake Peters area.
Early and middle Holocene (phases III and IV)
Both SCH8 and SCH10 record early Holocene conditions and consist of Dsi (dark silt), which characterizes phase III sediments. From 12 to 10 cal ka BP, SCH10 displays some of the highest values of OM content (6–9%) and relatively low WBD (1.3–1.4 g/cm3). SCH8 shares a peak in OM at ~12 cal ka BP but then transitions to low OM. The high-density section deposited just after 12 ka in SCH8 is likely related to the presence of several thin (~1 cm), coarse-grained layers, interpreted as turbidites, likely sourced in sediment pulses from Coke Creek, which may explain the discordantly high-density values and low OM as compared with SCH10. Turbidites are otherwise rare in this core (except around 4 ka), suggesting they represent infrequent, high-magnitude flood events caused by intense precipitation.
The increase in OM from 12 to 10 ka is likely related to relatively warm summers, which were driven by orbitally controlled insolation (Fig. 7) that reached a maximum around ~10 cal ka BP for July at 70°N (Berger and Loutre, Reference Berger and Loutre1991). Temperature largely controls glacier extent, which directly controls the influx of mineral matter to the lakes, which reduces the proportional abundance of OM, and indirectly influences aquatic production through turbidity. Temperature also influences aquatic production through its effect on the duration of lake-ice cover. Growing season temperature affects terrestrial production as well, which in turn affects the availability of organic material for transport to the lakes. Similar increases in OM are found at Burial Lake in the northwestern Brooks Range (Finkenbinder et al., Reference Finkenbinder, Abbott, Finney, Stoner and Dorfman2015). Summer temperatures reconstructed from Burial, Zagoskin, and Trout Lakes using fossil Chironomidae assemblages provide additional evidence of increased summer temperatures (Fig. 7) that were roughly 1–2°C warmer than modern July air temperatures (Kurek et al., Reference Kurek, Cwynar and Vermaire2009b; Irvine et al., Reference Irvine, Cwynar, Vermaire and Rees2012). Additional evidence suggesting regionally warm conditions during the early Holocene includes the highest rates of thaw-lake initiation and peat formation ages from 11 to 10 cal ka BP (Jones and Yu, Reference Jones and Yu2010; Walter Anthony et al., Reference Walter Anthony, Zimov, Grosse, Jones, Anthony, Chapin and Finlay2014). Pollen evidence from Okpilak Lake (~40 km east of Lake Peters) suggests early Holocene warming represented by a shift from Cyperaceae- to Betula-dominated pollen assemblages around 12.0–11.6 cal ka BP (Oswald et al., Reference Oswald, Gavin, Anderson, Brubaker and Hu2012).
Phase IV sediments were deposited from 10 to 5 cal ka BP and consist of Lsi (light silt). Lake Schrader sediments show considerable variation but SCH8 increases in density from 10 to 8 cal ka BP, followed by a decrease from 8 to 5 ka. In SCH6, density reaches some of the highest values for the entire Holocene from 9 to 6 ka. OM shows an inverse pattern. This interval of relatively high-density sediment could suggest that glaciers had expanded during this time; however, this contrasts with the majority of evidence from eastern Beringia where most temperature reconstructions show relatively warm conditions, and there is no evidence of glacial advances around 8 cal ka BP in Alaska (Barclay et al., Reference Barclay, Wiles and Calkin2009). On the other hand, evidence of glacier advances around this time is present from elsewhere in the Arctic (e.g., Solomina et al., Reference Solomina, Bradley, Hodgson, Ivy-Ochs, Jomelli, Mackintosh and Nesje2015). Lake sediment characteristics suggest the presence of glaciers between 10 and 6 cal ka BP in northeastern Baffin Island, followed by minimum extents from 6 to 2 ka (Thomas et al., Reference Thomas, Szymanski and Briner2010). Marked early Holocene glacier fluctuations also occurred in Scandinavia (Nesje, Reference Nesje2009). Considering this regional perspective, a glacier influence on phase IV sediments cannot be entirely excluded.
Alternatively, decreased stream discharge under drier conditions could explain the relatively low OM content (less terrestrial productivity and subsequent runoff-driven transport into the lakes) and correspondingly high density of sediment in phase IV. Low lake levels across Alaska during the early Holocene indicate relative aridity (Kaufman et al., Reference Kaufman, Axford, Henderson, Mckay, Oswald, Saenger and Anderson2016). Additionally, isotopic evidence for early Holocene aridity is found at Wahoo Lake (80 km west of Lake Peters) where sediments are enriched in authigenic carbonate with elevated δ18O values (Fig. 7f), possibly because of the evaporative enrichment of lake water from 11.5 to 8.9 cal ka BP (Vachula et al., Reference Vachula, Chipman and Hu2017). Isotopic evidence from Meli Lake in the northcentral Brooks Range also suggests relatively dry conditions from 8.5 to 6 cal ka BP (Anderson et al., Reference Anderson, Abbott and Finney2001). In contrast, low δ18O values measured in Chara-stem encrustations from Takahula Lake in the south-central Brooks Range (Clegg and Hu, Reference Clegg and Hu2010) indicate that effective moisture was relatively high from 8.0 to 5.0 cal ka BP; however, this proxy record may have been affected by the avulsion of the inflow channel.
In contrast to Lake Schrader cores, PTR49 has relatively high OM content (7%) in phase IV, which decreases with some variability until about 5 cal ka BP. This discordance is likely related to the depositional setting of PTR49, located at 13 m depth on the submerged moraine at the northern end of Lake Peters (Fig. 2b). Four 14C samples contain abundant aquatic insect remains including nearly intact caddisfly remnants, which suggest the presence of a nearby shore and rocky habitat as these macrofossils would not likely survive long transport distances. One mechanism to explain the presence of these macrofossils is lake-level lowering because of decreased precipitation. Alternatively, the submerged moraine might have been roughly 5–10 m higher and then subsided because, like many arctic moraines, it may have been ice-cored. Substantial amounts of ground ice exist in the region and have a pronounced effect on topography (Kanevskiy et al., Reference Kanevskiy, Shur, Jorgenson, Ping, Michaelson, Fortier, Stephani, Dillon. and Tumskoy2013).
Late Holocene (phase V)
Around 5 cal ka BP, sediment density decreases (with some variation) in Lake Schrader cores until around 3 ka. OM content increases during this time and reaches relatively high values and together characterizes phase V sediments as Dsi (dark silt). This trend may record warmer summers as described for phase III. Additionally, the magnitude and frequency of high-discharge events influence the amount and proportion of mineral matter versus terrestrial OM delivered to the lakes. We suggest that the proportion of OM increases with runoff, especially when summers are warm. A more definitive interpretation awaits additional information about the origin of the organic material in the lake sediment. In SCH8, a discordant peak in density occurs around 4 ka and is associated with thin, visibly coarse-grained beds. Similar to phase III, these are interpreted as turbidites and suggest the occurrence of relatively high-magnitude precipitation events.
In Alaska and the Yukon, Neoglacial cooling primarily began following warm temperatures ca. 6 cal ka BP (McKay et al., Reference McKay, Kaufman, Routson, Erb and Zander2018); however, evidence from northern Alaska generally indicates warm conditions until ca. 2 ka. Temperature reconstructions from Burial Lake (Kurek et al., Reference Kurek, Cwynar, Ager, Abbott and Edwards2009a) and Trout Lake (Irvine et al., Reference Irvine, Cwynar, Vermaire and Rees2012) show that mid-Holocene summers were warmer than present (Fig. 7). Qualitative temperatures inferred from Tangled Up Lake using Chara calcite δ18O suggest cool conditions for the past 6.7 cal ka BP, but with a warm period centered at 4.5 cal ka BP (Anderson et al., Reference Anderson, Abbott and Finney2001). In the north-central Brooks Range, a quantitative temperature reconstruction from Kurupa Lake using spectrally inferred sedimentary chlorophyll suggests summer temperatures were typically colder than twentieth-century averages, but warmer from 3 to 2 cal ka BP (Boldt et al., Reference Boldt, Kaufman, McKay and Briner2015). Together, temperature reconstructions from northern Alaska bolster the interpretation that higher summer temperatures could have contributed to the protracted increase in OM during phase V.
Increased precipitation may have also been a factor. Regional hydroclimate reconstructions from Meli Lake δ18O values suggest increased moisture after 6 cal ka BP (Anderson et al., Reference Anderson, Abbott and Finney2001), and rising lake levels at Wahoo Lake further indicate increasing effective moisture at this time (Vachula et al., Reference Vachula, Chipman and Hu2017). Increases in precipitation may be related to decreases in sea-ice extent as modern examples of this have been observed around the Arctic (e.g., Boisvert and Stroeve, Reference Boisvert and Stroeve2015; Kopec et al., Reference Kopec, Feng, Michel and Posmentier2016). Sea-ice reconstructions from the Chukchi Sea (~800 km to the northwest) indicate somewhat conflicting trends but, in general, suggest reduced extents at 6.5 and 3.5 cal ka BP (Farmer et al., Reference Farmer, Cronin, de Vernal, Dwyer, Keigwin and Thunell2011; Polyak et al., Reference Polyak, Belt, Cabedo-Sanz, Yamamoto and Park2016; Stein et al., Reference Stein, Fahl, Schade, Manerung, Wassmuth, Niessen and Nam2017) (Fig. 7e). In contrast, the adjacent Beaufort Sea sea-ice reconstructions dating back to 4.5 ka suggest comparatively little variability (Bringué and Rochon, Reference Bringué and Rochon2012).
Taken together, these records suggest an increase in Holocene summer temperatures and/or increases in precipitation associated with reductions in sea-ice extent between 5 and 2 cal ka BP. Intriguingly, similar increases in OM are recorded in glaciolacustrine sediments on Baffin Island (Thomas et al., Reference Thomas, Szymanski and Briner2010) and in southern Greenland (Kaplan et al., Reference Kaplan, Wolfe and Miller2002) during this time. However, this inferred warm and/or wet period appears to contrast with paleoclimate evidence throughout eastern Beringia where most records show peak summer warmth from 7 to 5 cal ka BP and subsequent cooling related to decreasing summer insolation (Kaufman et al., Reference Kaufman, Axford, Henderson, Mckay, Oswald, Saenger and Anderson2016). We suggest that Lake Peters and other Arctic sites that are heavily influenced by adjacent oceans respond to climate forcings that differ from more continental settings.
Past 2000 years (phase VI)
Starting at 2 cal ka BP, sediments transition to Lsi (light silt), with density increasing and OM decreasing until the present. Sediment flux in nearly all cores increases during this time (Fig. 3c). This increase in density and decrease in OM likely represents the growth of glaciers in the catchment. PTR48 exhibits additional sedimentologic evidence for glacier expansion: turbidites most likely sourced from the nearby inflow of Whistler Creek dominate the lower portion of the core and contribute to relatively high sediment flux (Fig. 4). In the upper portion, a shift to finer-grained sediments and much lower sedimentation rates suggests that this drainage experienced a channel avulsion sometime after 1.4 ka, when Whistler Creek switched from discharging into Lake Peters to its modern channel draining into Lake Schrader. Although several factors contribute to proglacial fluvial dynamics, glacial advances are associated with increases in sediment production and can result in aggradation and channel avulsion (Gurnell et al., Reference Gurnell, Edwards, Petts and Ward1999). Neoglacial moraines potentially deposited around this time are found in the Lake Peters area (Evison et al., Reference Evison, Calkin and Ellis1996; Benson, Reference Benson2018), but no candidate moraines that represent this advance have been recognized in Whistler Creek valley.
Moraine evidence from the nearby Chamberlin Glacier bolsters the interpretation that phase VI sediments represent the expansion of mountain glaciers in the Lake Peters catchment. The outermost moraine of the Chamberlin Glacier forefield was dated to ~2.6 cal ka BP using lichenometry and regional growth curves (Evison et al., Reference Evison, Calkin and Ellis1996). Although cosmogenic 10Be exposure dating has generally superseded lichenometry as the preferred technique, a recent comparison of Brooks Range lichen-inferred ages with 10Be surface exposure ages concluded that conflicts within and between these two methods made it unclear as to which is superior for this timescale (Pendleton et al., Reference Pendleton, Briner, Kaufman and Zimmerman2017). The oldest definitive moraine at Chamberlin Glacier may be associated with increased moraine frequency from elsewhere in the Brooks Range dating to 2.5–1.9 cal ka BP (Pendleton et al., Reference Pendleton, Briner, Kaufman and Zimmerman2017). A distinct increase in moraine frequency also occurs throughout the Brooks Range from 1.1 to 1.0 ka. Although uncertainty exists in the timing and relation to regional patterns, moraines and lake sediments both suggest the growth of glaciers in the Lake Peters area starting around 2 ka.
The Little Ice Age (LIA) is widely recognized as the most recent period of Neoglacial cooling occurring around AD 1500–1850 (e.g., Matthews and Briffa, Reference Matthews and Briffa2005). In the Brooks Range, the outermost LIA moraines are typically within 0.2 ± 0.1 km of the mid-twentieth-century termini (Sikorski et al., Reference Sikorski, Kaufman, Manley and Nolan2009). These moraines have lichen-inferred ages 60 yr before 1950, suggesting glaciers were at their LIA maximum around 1890 (Evison et al., Reference Evison, Calkin and Ellis1996).
Evidence for the well-known glacier advances late during the LIA and the subsequent twentieth-century retreat is difficult to identify in the sediment of Lakes Peters and Schrader. Sedimentation rates in the lakes are low (typically <0.5 mm/yr), and glacier cover in the catchment is small (9% overall). Post-LIA glacier retreat might be represented in sediments of Lakes Peter and Schrader by increased sedimentation rates in response to a pulse in the availability of unstable glacial deposits left by retreating glaciers, as Leonard (Reference Leonard1997) demonstrated in the Rocky Mountains. Despite considerable uncertainties, average sedimentation rates based on 210Pb suggest a twofold increase in PTR48 and a slight increase (8–34%) for SCH8. Additional evidence for glacier fluctuations during the LIA, albeit equivocal, is based on changes in OM content and spectrally inferred chlorophyll content of the near-surface sediment as described by Benson (Reference Benson2018).
CONCLUSION
This study provides an initial stratigraphic framework of glaciolacustrine sediments from Lakes Peters and Schrader, two large lakes located near the Beaufort Sea with a watershed that encompasses some of the highest and most extensively glaciated peaks of the Brooks Range. As one of the longest records from a glaciated catchment, this study provides regional insight into deglaciation and the Bølling transition. Variability in physical sediment properties among the cores illustrates the complexity of comparing multiple core sites across relatively large lakes, but overall, sediments show coherent patterns of early Holocene peak warmth followed by relative aridity. The increase in OM content from 5 to 2 ka suggests warmer and/or wetter conditions, which contrasts with other paleoclimate evidence regionally but accords with studies from elsewhere in the Arctic, especially in the North Atlantic region where a pronounced shift toward cooling began around 2 cal ka BP (McKay et al., Reference McKay, Kaufman, Routson, Erb and Zander2018). Glaciolacustrine evidence of late Holocene glacial advances starting at 2 ka is accompanied by the formation of moraines within the catchment and provides an additional record of Neoglacial cooling in the northeastern Brooks Range. Further analysis of this sedimentary sequence will provide additional insight into the paleoenvironmental history of this valuable study site.
ACKNOWLEDGMENTS
This research benefited from the efforts of many individuals who participated in fieldwork as part of the Arctic Glacial Lakes Project (http://www2.nau.edu/arcss-p/). We thank two anonymous reviewers and the editors for their helpful comments. In addition, K. Whitacre and R.S. Anderson helped in the laboratory; M. Retelle and R. Bradley loaned us their field equipment; J. Southon analyzed the radiocarbon; D. Hammond analyzed the Pb and Cs; and the Lacustrine Core Facility (LacCore) provided the initial core description data sets. U.S. Fish and Wildlife Service, Arctic Refuge Office permitted the research activities. Their decisions and guidance helped assure the preservation of the area's wilderness values while continuing the long tradition of scientific research at the Holmes Research Station. CH2MHill Polar Services and Coyote Air Service provided logistical support. This project was funded by National Science Foundation award ARC-1418000. Data availability: The down-core data for the multiparameter, biophysical properties analyzed on the sediment cores from Lakes Peters and Schrader are available as a digital supplement to Benson's (Reference Benson2018) master's thesis (available online at: https://pqdtopen.proquest.com/doc/2054017313.html?FMT=ABS).