INTRODUCTION
Rural communities in the Andean region are confronted with a number of significant livelihood challenges, including low incomes, food insecurity and natural resource constraints. Such difficulties figure prominently in the lives of subsistence farming households in the Bolivar province of central Ecuador, where 77% of families lack the resources to fulfill their basic needs (Andrade Lopez, Reference Andrade Lopez2008). Bolivar is ranked lowest among Ecuador's 24 provinces in its poverty index (Andrade Lopez, Reference Andrade Lopez2008). Rural Andean households are heavily dependent on agriculture, yet farm production is limited by factors such as steep topography and erratic rainfall. Although the area's volcanic soil is naturally rich in nutrients, landslides have created an increasing number of dead zones with virtually no vegetative cover. Moreover, farmers' exposure to risk from climatic and economic shocks is heightened by dependence on a limited number of staple food crops (SANREM CRSP, 2012).
Ecuadorian farmers attempt to compensate for low yields by expanding the area cropped. This expansion often means cultivating land that is of lower quality and located on steep slopes, making it susceptible to erosion; thus develops a persistent cycle of low yields, expansion of croplands, and soil erosion. This pattern is accompanied by other forms of environmental degradation, including increased sedimentation in rivers and streams that has resulted in heavy flooding with associated economic damage downstream. Improving the continued food security of the households caught up in this cycle will require efforts to conserve the soil on which they depend (SANREM CRSP, 2012).
Conservation agriculture (CA) has been identified as a potential solution to the area's environmental degradation and associated decline in agricultural yields. This innovative approach to agriculture has the potential to provide environmental benefits, including reduced soil erosion and thus less downstream sedimentation, thereby leading to less flooding and avoidance of clean-up costs (SANREM CRSP, 2012). Conservation agriculture, an environment-focused approach to agriculture, is defined as a collection of farming practices aimed at conserving, improving and more efficiently utilizing the available natural resource base. The three main principles for the majority of conservation agriculture systems are the use of reduced or minimum tillage, maintenance of an organic soil cover (food crop or cover crop) at all times and the implementation of purposeful crop rotations (Corsi et al., Reference Corsi, Pisante, Kassam and Friedrich2011; FAO, 2012). Conservation agriculture focuses on environmental and long-run economic benefits, in addition to agricultural and short-term economic benefits (Kassam and Friedich, Reference Kassam and Friedrich2011).
Numerous research projects applying diverse methods, including cost-benefit analysis, case studies, econometrics, meta-analysis and linear programming, have examined the potential impact of conservation agriculture. The literature encompasses research on the associated changes in yields and farm income, the impacts on the environment and the natural resource base, the components of conservation agriculture and the various factors affecting the adoption of conservation agriculture systems. For an overview of the spread and implications of conservation agriculture in North and South America, see Derpsch (Reference Derpsch2005). Much of the research has focused on Sub-Saharan Africa, including studies in Zimbabwe, Ghana, Uganda and Zambia, which indicate positive environmental and economic impacts from conservation agriculture (Jenrich, Reference Jenrich2011; Marongwe et al., Reference Marongwe, Kwazira, Jenrich, Thierfelder, Kassam and Friedrich2011). Other studies present less favourable results, with limited environmental benefits and significant barriers to adoption of conservation agriculture systems. Important factors limiting adoption include increased labour requirements under conservation agriculture, competing uses for the cover crops needed as mulch materials in conservation agriculture and limited access to necessary inputs to implement conservation agriculture (Giller et al., Reference Giller, Witter, Corbeels and Tittonell2009; Govaerts et al., Reference Govaerts, Verhulst, Castellanos-Navarrete, Sayre, Dixon and Dendooven2009). Other studies examine the implementation of conservation agriculture in semi-arid drylands and flood zones as well as in combination with agro-forestry (Bayala et al., Reference Bayala, Kalinganire, Tchoundjeu, Sinclair and Garrity2011; Umar and Nyanga, Reference Umar and Nyanga2011; Zarea, Reference Zarea and Lichtfouse2011).
One of the primary goals of conservation agriculture is to increase the percentage of organic matter, especially carbon, in agricultural soils. There has been a focus on soil carbon content because a higher organic content is linked to greater soil productivity, which increases the profitability and thus the livelihoods of individual farm households. Moreover, an improved natural resource base can be beneficial to future generations of farmers and consumers (Shaxson et al., Reference Shaxson, Kassam, Friedrich, Boddey and Adekunle2008; West and Post, Reference West and Post2002). Increased levels of organic matter in the soil also represent an environmental improvement in that the farming techniques associated with conservation agriculture, including reduced tillage, cover crops and crop rotations, have been shown to contribute to carbon sequestration and thus to a decrease in the rate of global warming (Lal and Kimble, Reference Lal and Kimble1997; Shaxson et al., Reference Shaxson, Kassam, Friedrich, Boddey and Adekunle2008; West and Post, Reference West and Post2002).
Drawing on the potential benefits offered by conservation agriculture, and given the need for innovative approaches to combat the challenges faced by farming communities in the Andes and throughout the developing world, the US Agency for International Development is funding a research-based conservation agriculture program focused on improving the livelihoods of the rural poor. Implemented by the Sustainable Agriculture and Natural Resource Management Collaborative Research Support Program (SANREM CRSP, 2012), the program has focused on Ecuador among other countries. The current goals are to develop and disseminate sustainable agricultural technologies, such as soil conservation techniques, to increase incomes and conserve the natural resource base. Several techniques have been developed, or identified and adapted to the local context, including water-diversion ditches, organic fertilizer, minimal tillage, crop rotation and terraced cropping (SANREM CRSP, 2012).
This study assesses economic benefits of conservation agriculture practices developed on SANREM CRSP in Ecuador. The objective of the assessment is to evaluate the impact of conservation agriculture innovations on farm income and to identify profit-maximizing mixes of practices for farmers in the study area. A two-year farm-level linear programming model is used which maximizes net revenue subject to farm resource and production constraints, and projects livelihood improvements from diffusing and adopting conservation agriculture innovations.Footnote 1 When additional data are available, the model will be extended to explore implications of meeting soil carbon and erosion constraints.
MATERIALS AND METHODS
Site description
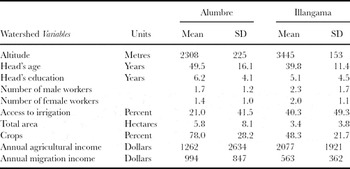
The study focuses on two areas of the Chimbo River watershed in Bolivar province that are geographically, culturally and socio-economically distinct: the higher elevation Illangama and the lower elevation Alumbre sub-watersheds (Table 1). These sub-watersheds have cropping systems that differ because of elevation; the lower sub-watershed ranging from 600 to 2400 masl, and the upper from 2400 to 4500 masl (Gibson et al., Reference Gibson, Zeiders, Hall, Martin, Sowell, Celleri, Monar, Escudero, Barrera, Alwang, Bosch and Norton2009). The average farm size is 3.4 hectares (48% cropped) in the upper sub-watershed and 5.8 hectares (78% cropped) in the lower sub-watershed. The principal crops in the upper sub-watershed are potatoes and fava beans, while corn and beans dominate the lower sub-watershed. Additional crops in the upper sub-watershed include onions, pasture for dairy cattle and sheep and barley. Dairy incomes are particularly important for households in Illangama. In the lower sub-watershed, farmers grow wheat, fruit and vegetables. Food insecurity in both sub-watersheds is affected by low agricultural yields, which are linked to poor soil quality (SANREM CRSP, 2012).
Summary statistics for the study area (SANREM CRSP, 2012).

Model design
The basic elements of the linear programming model are activities and constraints. Numerical values for activity coefficients and resource constraint levels were based on primary data and published data for the two sub-watersheds. A version of the model was constructed for each sub-watershed. The model activities are a direct function of conservation agricultural practices developed and being tested in the SANREM agricultural field experiments. Therefore, each sub-watershed model is a two-year model encompassing four approximately six-month crop rotation cycles.
The model solutions contain levels of the model activities that would maximize net revenue subject to the land, labour, capital and other constraints if implemented by the farmer. The model is used to determine the number of square metres in a typical farm that should be devoted to each experimental crop rotation. The model allocates the limited (constrained) amount of available agricultural land, labour and capital per farm among the different possible crop rotations.
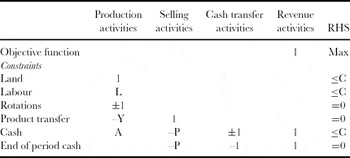
An aggregated version of the linear programming tableau for a sub-watershed is presented in Table 2. Model activities (columns) are grouped into four categories – production, selling, cash transfer and revenue, while the model constraints (rows) are grouped into six categories, including land, labour, rotational, product transfer, cash and end of period cash.
Aggregated tableau for the upper and lower watershed models.

Notes: L = Monthly labour requirements for each production activity (h/m2).
Y = Yield for each production activity (kg/m2).
A = Costs for each production activity ($/m2).
P = Price for each production activity crop ($/kg).
C = Model constraint values.
The elements shown in the middle section of Table 2 represent coefficients that are multiplied by the activity levels (amounts) selected by the model to determine the impact of each activity on the available farm household resource or other constraint. Positive coefficients denote that the activity requires labour, cash or other inputs, while negative coefficients signify that the activity contributes cash or other input. For example, the coefficient for the production activities column on the cash constraint row is a +A, which indicates that these activities require cash, while the corresponding coefficient under the selling activities column is a negative –P because the latter activities contribute cash.
Model activities
Specific model activities within each group shown in Table 2 were determined by identifying the principal crop-related activities on a typical farm in the study area, as well as the experimental crop production activities introduced by the SANREM CRSP in Ecuador. The experimental SANREM activities include the construction of diversion ditches to reduce soil loss from rainwater runoff, reduced tillage to protect soil, new crop rotations, herbicides and manual weed removal and use of cover crops as organic mulch and to reduce soil erosion and increase soil organic matter.
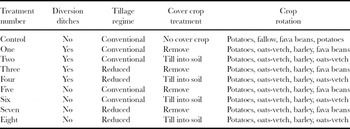
The Illangama sub-watershed model contains nine sets of cropping activities, corresponding to the experimental control – that is, the traditional farming system – and eight experimental treatments. These nine cropping activities are presented in Table 3.
Cropping activities in the Illangama watershed.

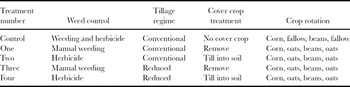
In the Alumbre sub-watershed, four experimental treatments were introduced, along with the experimental control of traditional practices. These five treatments are presented in Table 4.
Cropping activities in the Alumbre watershed.

Additional model activities were included in each sub-watershed model to account for crop sales and the transfer of cash from one six-month period to another, as well as from the end of the final six-month period into a net revenue account. The model does not include consumption of crops by the farm household; the solution values reflect the net value to the producer of each activity whether consumed or sold. Activities related to borrowing money and selling/hiring of labour were excluded from the models based on the minimal use by farm households in the study area as indicated in farmer interviews.Footnote 2 The Illangama sub-watershed model comprises 47 activities, while the Alumbre watershed model contains 27 activities.Footnote 3
Model constraints
The farm production-related constraints were determined by identifying existing constraints on farming activities – that is constraints on land, labour and available cash. Additional constraints were developed to account for traditional and experimental crop rotations in the model, as well as to link crop yields to selling activities. Because men and women work side by side within family groups for the traditional and experimental cropping activities included in the model, labour constraints by gender were not included in the model.Footnote 4 The Illangama sub-watershed model included a total of 64 constraints, and the Alumbre sub-watershed model contained 48 constraints.Footnote 5
Data collection and population of the model
The data required to populate the model's activity coefficients and constraints included production costs (labour requirements and other inputs) of current agricultural practices in the study area, production costs of the experimental crop rotations, current yields and prices, expected or actual yield changes associated with new practices and resources available to the average farm household in the study area. Some of the data came from three experimental trials that were carried out in the upper watershed (Illangama) and from five trials carried out in the lower watershed (Alumbre).
Model activity coefficients
Interviews with six project economists, agronomists and soil scientists between June 2010 and July 2011 provided information on the experimental conservation agriculture practices which constitute the SANREM CRSP Ecuador project, along with associated costs and yields for various practices. Data were also obtained through a survey of farmers in the study area conducted by Virginia Tech students with the assistance of National Agricultural Research Institute of Ecuador (INIAP) in June 2011. A total of 45 survey participants in the Illangama watershed and 43 participants in the Alumbre watershed were selected randomly among the heads of farm households. Participants included both those practicing conventional agriculture and those implementing the experimental production practices introduced by the SANREM project.
The data gathered through these interviews of farmers and other experts were used to construct crop budgets for the SANREM control and treatment activities analysed. Labour required for each cropping activity was compiled on a monthly basis, covering 24 months of the model period. Likewise, input requirements for each crop production activity were combined into a cash costs figure. Finally, the budgets were completed with yields for each production activity. Since the SANREM experiments are ongoing, complete yield information for all cropping activities is not yet available. Therefore, yields used to populate the models were either actual or expected, depending on data availability. Assumptions about expected yields for various experimental crop production activities were determined through interviews with agronomists involved in the SANREM project implementation as described below.
For the upper sub-watershed, Illangama, actual yield data were available for oats-vetch. Since the role of this crop in the SANREM experiment was a cover crop incorporated into the soil to enrich it, the yield data consisted of total vegetation produced – including both edible and non-edible portions of the crop. Based on a comparison with average production yields for the crop in Ecuador obtained from the Statistics Division of the United Nations Food and Agriculture Organization (FAOSTAT, 2011), it was assumed that 5% of the total vegetation produced was edible, and thus saleable at the market price included in the model. Thus, the marketable yield coefficients for oats-vetch used for model population were 5% of the measured experimental yields. The same assumption was applied to oats-vetch yields for the Alumbre sub-watershed model.
In the Illangama model, yield data for potatoes under current practices (the control treatment) were obtained through farmer interviews. The use of diversion ditches cost money but was found in earlier experiments to have no impact on yields, at least in the short run. Because they would not appear in the model solution unless subsidized, they were dropped from the model. Reduced tillage was estimated to provide a 15% smaller potato yield than conventional tillage, based on initial observations of experimental plots, but reduced production costs.Footnote 6 For barley, yield under current practices was determined through farmer interviews, and the yield was assumed to be 10% more for barley planted in fields following the tilling under of the oats-vetch cover crop (Treatments 2, 4, 6 and 8). The tillage regime was expected to have no effect on barley yield. Finally, for fava beans, data on yield under current practices were acquired through farm household surveys, and the experimental treatment yields were expected to be equivalent to that for the control treatment.
For the lower elevation Alumbre sub-watershed, actual yield outcomes were available for all the corn and oats-vetch treatments. (Again, saleable yields of oats-vetch were assumed to be 5% of actual experimental yields.) For beans, information on yields under current practices (conventional tillage, no cover crop) was obtained through the farmer survey. Based on initial observations of the experimental plots at a pre-harvest stage, it was assumed that yield would be highest under the conventional tillage regime preceded by the tilling into the soil of the oats-vetch cover crop. Compared with this scenario, reduced tillage combined with the incorporated cover crop was assumed to provide 10% less yield, while the removal (rather than tilling in) of the oats-vetch cover crop, combined with either conventional or reduced tillage, was assumed to provide 20% less yield than the first scenario (conventional tillage combined with incorporated cover crop).Footnote 7
Model constraint levels
Land constraint levels were obtained from a 2007 baseline survey of 207 households in the study area, conducted by INIAP. The average cropped area per farm was 1.6 hectares in the upper watershed and 4.2 hectares in the lower watershed (Table 1). The labour constraint – that is, the amount of available labour for the average farm family – was assumed to be 400 h per month in both Illangama and Alumbre watersheds. This amount was determined based on an average rural family size of two adults and four children, with each adult providing 100 h of labour per month, and each child supplying 50 h of labour per month.Footnote 8 Thus, total available labour per family was calculated to be 400 h per month. Based on expert interview data, cash at the beginning of a six-month period was assumed to be $400. According to project scientists, farm families in the study area obtain the capital needed to begin a planting cycle through the sale of livestock, including pigs and chickens.
Model implementation and sensitivity analysis
The linear programming model was run using Excel Solver software. The model solution for each sub-watershed indicated the optimal mix of production activity levels for various experimental cropping treatments, which were selected by the Solver program along with other model activities in order to maximize farm household revenue. The results were analysed by considering the impact of the model constraint levels on the results, as well as the implications of shadow prices associated with the constraints, including labour and cash resources (capital). Additional analysis consisted of an examination of the profit reductions that would be brought about by implementing the model activities that were not selected as part of the optimal solution. Finally, sensitivity analysis was conducted to determine the impact of altering the assumptions used in this study on the expected yield changes from implementing conservation agriculture practices.
RESULTS
Optimal solutions
The implementation of the Illangama model produced an optimal solution which satisfied the model constraints. The model indicated that 1180 square metres of land should be planted according to the model's control scenario – that is, the current farm practices of a potatoes, fallow land, fava beans and fallow land rotation, sown under conventional tillage and without a cover crop. In addition, 1078 square metres should be devoted to experimental cropping activity 5, which calls for a rotation of potatoes, oats-vetch, barley and fava beans, with conventional tillage, and the removal, rather than incorporation into the soil, of the cover crop. Finally, experimental cropping activity 6 should be implemented on 864 square metres of land. Treatment 6 consists of growing the crop rotation potatoes, oats-vetch, barley, oats-vetch under conventional tillage, and with the incorporation into the soil of the oats-vetch cover crop. Taken together, the three sets of cropping activities chosen by the model indicate that over an initial two-year period, conventional tillage is more economically beneficial than reduced tillage. Results were mixed as to the profitability of the conservation agriculture treatment of tilling the oats-vetch cover crop into the soil, as well as with regard to which crop rotation is ideal, since the model allocated cropland to three different crop rotations.
The resulting total 3122 square metres of land planted in the Illangama model would produce 2926 kg of potatoes in cycle one and 1106 kg in cycle four, 447 kg of saleable oats-vetch in cycle two and 184 kg in cycle four, and 298 kg of barley and 123 kg of fava beans in cycle three and 112 kg in cycle four. If all crops produced are sold, it would result in a net revenue of $2283.
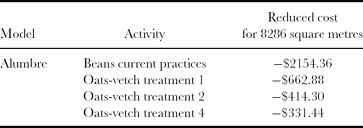
The implementation of the Alumbre model also resulted in an optimal solution satisfying all model constraints. These results indicated that cropping activity 3 should be undertaken on 8286 square metres of land and that no other cropping activities should be implemented. Treatment 3 consists of growing the crop rotation corn, oats-vetch, beans and oats-vetch under reduced tillage and manual weeding, and without the incorporation of the oats-vetch cover crop into the soil. Unlike in the upper watershed solution, reduced tillage proved more revenue-maximizing than did conventional tillage even in the short term. Incorporation of the cover crop was not part of the optimal solution, while in the upper watershed the opposite was true. Manual weeding proved to be more profitable than herbicide use. The 8286 square metres of land would yield 2897 kg of corn, 2159 kg of saleable oats-vetch in both cycles two and four and 2173 kg of beans. All crops would be sold to produce $7711 in net revenue.
Analysis of the results and sensitivity analysis
The model output was analysed to determine the role of constraint levels in determining the optimal solutions, as well as the projected impact on revenue that would result from the implementation of the experimental activities not selected as part of the revenue-maximizing cropping system. Seven constraints were binding in the Illangama model: available labour for the months of January (year 2) and July (year 2) and available cash – that is, capital – in each of the four six-month model periods. The high labour requirement in January and July of year 2 results from planting the labour-intensive fava in both current practices and experimental Treatment 5. The shadow prices for labour in January and July of year 2 are $0.57 and $0.16 respectively, indicating that an additional hour of labour in the corresponding months would contribute those dollar amounts to total revenue. In other words, a farmer would be willing to pay up to only $0.57 and $0.16 per hour to hire additional labour in those periods, which is well below the current wage for agricultural labour of approximately $1.00 per hour. There is in fact little labour market activity in the upper watershed and this result may partially explain the reason for this. In the Alumbre model, none of the labour constraints are binding.
In the Illangama model, the shadow price for available cash in the second, third and fourth six-month periods is $1.00, which suggests that an additional dollar of capital investment for those periods would be rewarded in proportional increases in net revenue. The same is true for the final three available cash constraints in the Alumbre model. This indicates that increased credit availability could improve outcomes for small farmers in the study area. Indeed, the shadow price for available cash in the Illangama model's first period is about $2.00, and for the Alumbre model in the same period it is $16.00, indicating that additional capital at the beginning of the planting cycle would be highly profitable. The formal credit market in both watersheds is limited, although an informal credit market does provide farmers in the study area with some access to credit. It appears more credit needs to be made available.
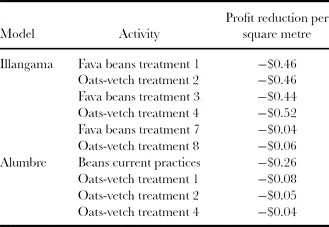
As indicated in Table 5, the implementation of certain cropping activities that were not selected as part of the optimal solutions in both Illangama and Alumbre models would lead to reductions in profits. These results indicate that forcing these activities into the model – in other words, choosing to implement cropping activities not determined to be part of the revenue-maximizing solution – would reduce revenue substantially.
Profit reduction from implementing non-optimal activities.

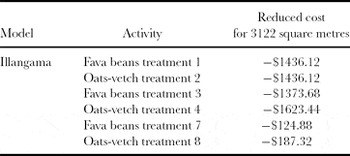
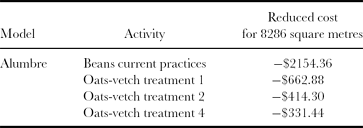
For the Illangama watershed, a typical farm planting 3122 square metres of land – as selected by the optimal model solution – would be faced with the reduced profits from implementing non-optimal activities presented in Table 6. A typical farm in the Alumbre watershed, planting 8286 square metres of land as selected by the linear programming model, would face the profit reductions for each non-optimal model farm activity indicated in Table 7.Footnote 9 The model results for the optimal amount of land to plant per farm household under conservation agriculture are significantly less than the current cropped averages: In the upper watershed Illangama, 3122 square metres (model optimal) versus 16422 square metres (current average), and for the lower watershed Alumbre, 8286 square metres (model optimal) versus 45,240 square metres (current average).
Profit reduction from implementing non-optimal activities for a typical farm in the upper (Illangama) watershed.

Profit reduction from implementing non-optimal activities for a typical farm in the lower (Alumbre) sub-watershed.
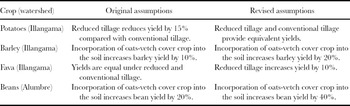
Sensitivity analysis was conducted to determine the impact on the model results of the assumptions used to estimate yield changes that would result from the implementation of the experimental conservation agriculture practices. In order to test the sensitivity of the results, additional model runs were carried out using less conservative assumptions about the benefits of conservation agriculture, reflecting the potential for conservation agriculture to improve soil quality, and thus greater yields, over time. Actual yield data were available for oats-vetch in both Illangama and Alumbre watersheds, as well as for corn in the Alumbre watershed. Therefore, the model coefficients for these two crops were not altered during the sensitivity analysis, like they were for the other crops. For example, in the case of potatoes in the upper sub-watershed, the original assumption held that reduced tillage (a conservation agriculture treatment) would reduce yields by 15% as compared with conventional tillage. For purposes of this step in the analysis, assumptions were changed to a scenario in which conventional and reduced tillage provide equivalent yields. Table 8 shows the assumptions used in the original model, as well as those used for the sensitivity analysis, for the four crops subject to sensitivity analysis.
Altered yield assumptions for sensitivity analysis.

Four additional model runs were implemented for the Illangama sub-watershed: a separate run for each of the crops targeted by the sensitivity analysis (potatoes, barley and fava), as well as one run incorporating the changed assumptions for all three crops. Under the new potato yield scenario, assuming that reduced tillage and conventional tillage provide equal potato yields, the model shifted production from Treatment 5 (conventional tillage) to the less labour-intensive Treatment 7 (reduced tillage), increasing revenue from $2283 to $2285. Given the revised assumptions about the effect of incorporating the oats-vetch cover crop into the soil ahead of the barley planting – that is, a 20% rather than a 10% greater barley yield – the model results indicated that the same crop activities should be undertaken as in the original solution, with an increase in revenue from $2283 to $2288. The altered assumptions about the fava bean yield, with reduced tillage increasing yield by 10% rather than providing the same yield as conventional tillage, did not affect the optimal solution. Finally, the simultaneous revision of yield assumptions for all three crops (potatoes, barley and fava) mirrored the results of the sensitivity analysis for potatoes alone, as the new solution indicated that production should be transferred from Treatment 5 (conventional tillage) to Treatment 7, benefiting from the lower labour costs associated with reduced tillage. Under this new scenario, revenue increased from $2283 to $2292, a significant amount considering that this corresponds to 3122 square metres, or less than an acre, of cultivated land. Sensitivity analysis was likewise carried out for the Alumbre watershed model. The initial assumptions about bean yield were altered, assuming a 40% rather than a 20% increase in yield after the incorporation of the oats-vetch cover crop into the soil. The results were a shift in production from experimental cropping activity 3 (with removal of the oats-vetch cover crop) to activity 4 (tilling in of the cover crop), as well as a decrease in production from 8286 to 8016 square metres. Revenue increased from $7711 to $7908, a difference of nearly $200.
DISCUSSION
Based on the findings of this study, it appears that conservation agriculture practices have the potential to improve the livelihood of the rural poor in Ecuador, since those practices appeared in the revenue-optimizing solutions of the models for both sub-watersheds. Innovative conservation agriculture practices – either alone or in combination with current practices, depending on the watershed – provide higher net revenue than do current practices alone. In addition, many of the crops included in the experimental conservation agriculture treatments have well-established cultural value – that is, the crops are already an important part of the traditional diet for farmers in the study area – a fact that complements the crops' economic value.
This study makes a contribution to the literature on the impact of conservation agriculture by examining the short-run profitability of this still-evolving approach to agriculture in a controlled, experimental setting. The cropping systems being tested as part of the SANREM CRSP research and development program in Ecuador allow a systematic analysis of the benefits and costs of conservation agriculture, currently in the short run and eventually in the long run. Farm level and off-site benefits of conservation tillage are expected to be greater in the long run than the short run. This study does not estimate those benefits, but unless farmers benefit in the short run, either from the practices or from subsidies, they are not likely to adopt them. This study indicates the practices that are most likely to be adopted, and hence might be around to eventually provide long-term benefits. As additional data become available over time, a more dynamic long-term assessment of the benefits of conservation agriculture will be possible.
Recommendation for further research
One of the main objectives of conservation agriculture research is to develop innovative approaches to conserving the soil and other ecological resources on which long-term agricultural productivity depends. It is therefore important to analyse the impact that conservation agriculture innovations have on soil quality. Such an analysis would require collection of soil quality data specifically linked to the experimental crop production treatments under consideration for a period of at least three and as many as 10 years. The current phase of the SANREM CRSP includes a research component focusing on soil carbon content. Experiments are underway to collect and analyse soil samples from the various experimental conservation agriculture farm plots. Thus, data to complete an analysis of the impact of conservation agriculture techniques on soil quality and profits will be available within three years.
Acknowledgment
We are grateful for the support of USAID project agreement EPP-A-00-04-00013-00, Sustainable Agriculture and Natural Resource Management Collaborative Research Support Program.