Implications
This study aimed to establish the dietary crude protein requirement for growing blue-breasted quail (BBQ). The BBQ is the smallest quail and is considered a good laboratory model for avian research because of its hardiness, small size, short generation interval and excellent reproductive performance. There are, however, little data on its nutrient requirements. Literature indicates BBQ are fed turkey starter, lettuce leaves, finch seed, tubeworms and/or larvae. If the BBQ is to become a useful small animal model, similar to the mice, it is necessary to establish its nutrient requirements.
Introduction
The blue-breasted quail (BBQ) is the smallest quail in the family Phasianidae; it is kept mainly for egg production and is considered to be a good laboratory model for avian research (Tsudzuki, Reference Tsudzuki1994) because of its hardiness, small body size, short generation interval, excellent reproductive performance and easily distinguishable gender after 4 weeks of age. Recent BBQ experiments have focused on hormones (Andersson et al., Reference Andersson, Uller, Lõhmus and Sundstrom2004; Lõhmus and Sundstrom, Reference Lõhmus and Sundstrom2004; Lõhmus et al., Reference Lõhmus, Sundstrom and Silverin2006), embryonic development (Ono et al., Reference Ono, Nakane, Wadayama, Tsudzuki, Arisawa, Ninomiya, Suzuki, Mizutani and Kagami2005), disease (Morita et al., Reference Morita, Maruyama, Hashizaki and Katsube1999) and flight dynamics (Askew et al., Reference Askew, Marsh and Ellington2001; Askew and Marsh, Reference Askew and Marsh2001 and Reference Askew and Marsh2002). There are, however, little data on its nutrient requirements. If the BBQ is to become a useful small animal model for research, as is the mouse, it is necessary to establish its nutrient requirements for the preparation of practical or synthetic feed. As protein is a major nutrient for growth and maintenance (Pond et al., Reference Pond, Church, Pond and Schoknecht2005), establishing its requirement should be the first priority. The aim of this research was to estimate the requirement of dietary crude protein (CP) for growing BBQ. As the dietary metabolisable energy (ME) concentration affects protein utilisation, the possibility of an effect of ME concentration on CP requirements was also investigated.
Material and methods
Experiment 1
A total of 300 1-day-old quails from a flock reared at National Taiwan University, hatched by electrically heated incubators, wearing leg rings made by small-size plastic cable ties with different colours and numbers for identification, and weighing 3.80 ± 0.40 g, were raised in 30 individual cages (48 × 33 cm2) holding 10 birds each, according to a 2 × 5 factorial arrangement of treatments with 2 ME levels (12.13 and 13.39 MJ/kg) and 5 CP concentrations (160, 190, 220, 250 and 280 g/kg). As it is very difficult to distinguish the genders of newly hatched quails, the 1-day-old quails were assigned to each pen at random. After 4 weeks of age, the genders of the quail were recognised by their appearance. Data from 132 females and 134 males were analysed. These numbers exclude animals that died during the experiment, most of whom were in the lower CP treatments. The temperature in each brooder was maintained at 40 ± 1°C for the first 2 weeks (Bernstein, Reference Bernstein1971), and was subsequently decreased by 2°C every 2 days to 30°C. Water and feed (Table 1) were supplied ad libitum for 8 weeks. In the absence of previous data, the concentrations of individual essential amino acids, vitamins and minerals in the diets were set to satisfy or exceed the requirements of broilers, Japanese quails and Bobwhite quails recommended by the National Research Council (NRC) in 1994. Feed intake per cage and individual BWs were recorded every 7 days. When a dead bird was observed, its BW was recorded. Feed consumption was attributed to remaining birds in that cage if the dead bird had lost weight, that is, the bird was supposed to lose its appetite before it died. Provided that the BW of the dead was heavier than its preceding record, its feed intake from last time until the day it died was calculated by its weight gain and the average feed efficiency of other cages in the same treatment. This datum was subtracted from the total feed consumption of that cage. The average weight gain per feed intake of that cage was calculated by the feed intake corrected and the weight gain of the remaining quails. The previous BW records of the dead were not included in statistical analysis. As the average cage BW and intake values were utilised to estimate feed efficiency, the replicates were three for each ME–CP combination treatment.
Ingredient composition and calculated analysis of diets (g/kg as fed; Experiment 1)

ME = metabolisable energy.
†Vitamins per kilogram of diet: retinyl acetate, 4500 IU; cholecalciferol, 1000 ICU; dl-α-tocopheryl acetate, 30 IU; Vitamin K3, 2 mg; Vitamin B1, 3.36 mg; Vitamin B2, 6 mg; Vitamin B6, 4.86 mg; Ca-pantothenate, 54.59 mg; folic acid, 2.04 mg; biotin, 0.3 mg; niacin, 50 mg and Vitamin B12, 0.01 mg.
‡Mineral supplement per kilogram of diet: Cu (CuSO4·5H2O, 25.45% Cu), 5.55 mg; Fe (FeSO4·7H2O, 20.09% Fe), 133.34 mg; Mn (MnSO4·H2O, 32.49% Mn), 67.32 mg; Zn (ZnSO4·7H2O, 22.74% Zn), 55.03 mg and Se (NaSeO3·5H2O, 30.03% Se) 0.15 mg.
Experiment 2
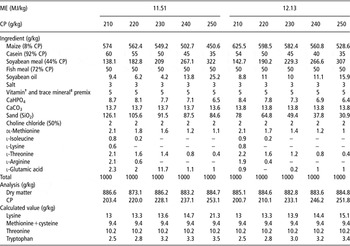
The number of quails and their management in Experiment 2 were identical to those in Experiment 1, but Experiment 2 lasted only 28 days. The factorial arrangement of the diets included 2 ME levels (11.51 and 12.13 MJ/kg) and 5 CP concentrations (210, 220, 230, 240 and 250 g/kg; Table 2). Data from 146 females and 149 males were analysed and these numbers exclude animals that died during the experiment. The weekly individual BWs and feed intake per cage were measured over the entire experimental period.
Ingredient composition and calculated analysis of diets (g/kg as fed; Experiment 2)

ME = metabolisable energy.
†, ‡Identical to those in Experiment 1.
Analyses
The moisture and nitrogen concentrations of the diets were measured by oven-drying and by the Kjeldahl method, according to the Association of Official Analytical Chemists (2000, Methods 953.07 and 984.13). The measured CP contents of the diets were used for CP intake calculation and requirement estimation.
Statistical analysis
First, data were statistically analysed according to the 2 (ME) × 5 (CP) factorial arrangements of treatments using the SAS GLM procedure (2002); differences among groups were determined by utilising Tukey's honestly significant difference test after ANOVA. A level of P < 0.05 was used as the criterion for statistical significance. Next, two different statistical models were used to test whether relationships between doses (dietary CP levels and CP intake) and responses (weight gain and feed efficiency) were fitted to a broken linear pattern, a curvilinear pattern, or both. If the relationship was suitable to the broken linear plateau, the minimum requirement of dietary CP for the best performance was identified according to a one-slope quadratic broken-line model (Morris, Reference Morris1999; Robbins et al., Reference Robbins, Saxton and Southern2006) by SAS (2002). Its equations were:

in which L and R represented the Y and X coordinate, respectively, of the point of inflection, and U was the slope of the oblique regression line before the inflection point. However, if the relationship also satisfied the curvilinear one, the maximum requirement of dietary CP for the best performance, the inflection point of the curve was calculated by conducting quadratic curvilinear regression (Morris, Reference Morris1999) by SAS (2002), and the equation was:

Results
Experiment 1
Since a total of 34 birds died during weeks 1–4, the final number of quails treated with the CP concentrations of 160, 190, 220, 250 and 280 was 23, 24, 30, 30 and 29 in groups receiving 12.13 MJ/kg and 23, 23, 25, 30 and 29 in groups treated with 13.39 MJ/kg, respectively. The growth curve of BBQ from 0 to 8 weeks of age is presented in Figure 1. The growth of most quails receiving CP of more than 220 g/kg in both ME treatment groups started slowly, accelerated and slowed again. After 4 weeks of age, quail gender could be distinguished by appearance. The males slowly increased in BW between 6 and 8 weeks of age, whereas the females put on weight more rapidly in this period and then laid their first eggs around 8 weeks of age (Figure 2). The BWs of the males and females were approximately 49.4 ± 4.4 and 65.5 ± 6.8 g, respectively, at 8 weeks of age. Therefore, quails given diets with only 160 or 190 g/kg CP, regardless of ME concentration, grew more slowly in their first 4 weeks than between 4 and 8 weeks of age, and no female laid an egg before the end of this experiment (Figure 1).
The growth curve of blue-breasted quails from 0 to 8 weeks of age (Experiment 1).

The growth curve of blue-breasted quails of different genders that received dietary protein of more than 22% from 0 to 8 weeks of age (Experiment 1).

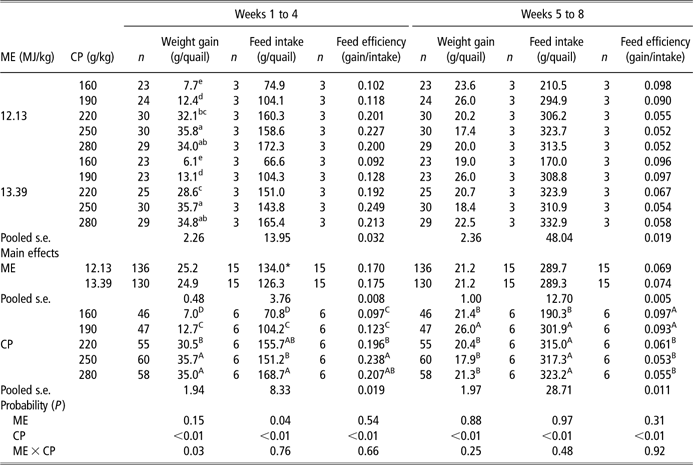
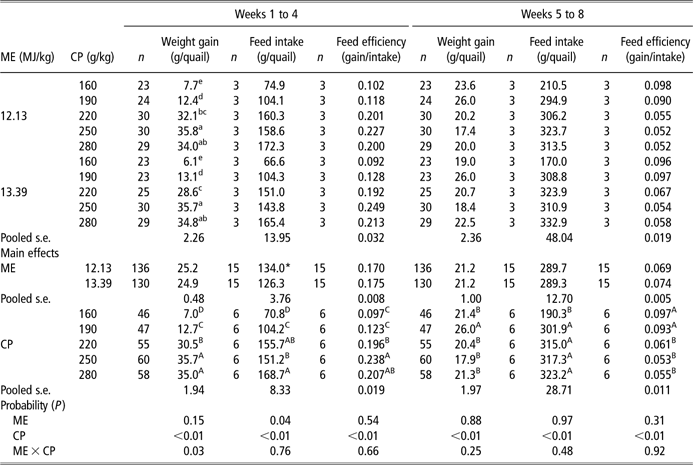
The effects of the different combinations of ME and CP on growth responses for weeks 1 to 4 and weeks 5 to 8 are presented in Table 3; the only interaction existed in weight gain between ME and CP levels for weeks 1 to 4 (P < 0.05). In both ME groups, quails receiving CP of 160 g/kg showed the least weight gains (P < 0.05). Less weight gains (P < 0.05) were observed in quails ingesting CP of 190 g/kg compared with those consuming higher CP concentrations in both ME treatments. No differences (P > 0.05) existed in weight gain between the ME groups in which quails ingested CP of 250 and 280 g/kg, whereas quails consuming CP of 220 g/kg with an ME of 13.39 MJ/kg had smaller weight gain than did those ingesting higher CP concentrations (P < 0.05). Of quails treated with the CP concentration of 220 g/kg, no difference existed between the ME treatments (P > 0.05). Similar weight gains were observed between those consuming CP of 220 g/kg with an ME of 12.13 MJ/kg and those ingesting CP of 280 g/kg in both ME levels.
The effects of the combinations of dietary metabolisable energy and protein on the growth responses of blue-breasted quailsFootnote § for weeks 1 to 4 (Experiment 1)
ME = metabolisable energy.
§ The number of total observations for female and male was 132 and 134, respectively.
a–e Means of ME–CP treatments within a column followed by different superscripts were significantly different (P < 0.05).
A–D Means of CP treatments within a column followed by different superscripts were significantly different (P < 0.05).
* Significantly different from that of the other ME level (P < 0.05).
Of main effects for weeks 1–4, quails treated with an ME of 12.13 MJ/kg consumed more feed than did those receiving another ME level, whereas quails in both ME treatments showed similar feed efficiencies. Although groups given CP of 250 g/kg showed the best-feed efficiency, there was no difference (P > 0.05) between these groups and those fed CP of 280 g/kg. Similar feed efficiencies were observed between quails receiving CP of 220 and 280 g/kg, whereas differences (P < 0.05) existed between those treated with CP of 190, 220 and 250 g/kg. Quails receiving CP of 160 and 190 g/kg showed similar feed efficiencies (P > 0.05). For weeks 5 to 8, no difference (P > 0.05) in weight gain, feed intake and feed efficiency was seen, regardless of ME levels, and no interaction existed between ME and CP levels. Quails receiving CP of 190 g/kg had the greatest weight gains (P < 0.05); however, no difference (P > 0.05) existed between the other groups. Groups receiving 160 g/kg ate less feed (P < 0.05) compared with others whose intake was similar. Quails consuming 160 and 190 g/kg showed similar feed efficiencies (P > 0.05), but better (P < 0.05) than others whose feed efficiencies were similar.
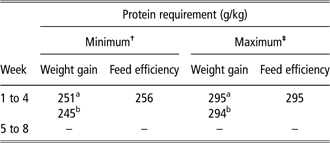
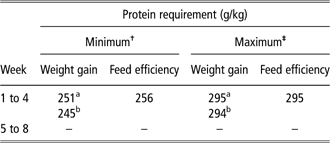
The CP requirements estimated by the one-slope quadratic broken-line model (minimum) and quadratic curvilinear regression (maximum) according to weight gain or feed efficiency for weeks 1 to 4 and 5 to 8 are shown in Table 4. For the highest weight gain in weeks 1 to 4, the minimum CP requirement was estimated to be 251 g/kg with an ME of 12.13 MJ/kg and 245 g/kg with an ME of 13.39 MJ/kg. For the best feed efficiency, the minimum CP requirement was calculated to be 256 g/kg for weeks 1 to 4. The maximum CP requirements estimated by quadratic curvilinear regression for weeks 1 to 4 were 295 g/kg with an ME of 12.13 MJ/kg and 294 g/kg with an ME of 13.39 MJ/kg for the highest weight gain, and 295 g/kg for the best feed efficiency. No estimate could be made for weeks 5 to 8 due to the variability of the data.
The requirements of crude protein for blue-breasted quails for weeks 1 to 4 and 5 to 8 (Experiment 1)
ME = metabolisable energy.
aDietary ME: 12.13 MJ/kg.
bDietary ME: 13.39 MJ/kg.
†Computed by a 1-slope quadratic broken-line model.
‡Computed by quadratic curvilinear regression.
Experiment 2
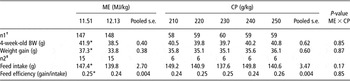
Since a total of five birds died during the experiment, the final number of quails treated with the CP concentrations of 210, 220, 230, 240 and 250 was 28, 29, 30, 30 and 30 in groups receiving 11.51 MJ/kg and 30, 30, 30, 29 and 29 in groups treated with 12.13 MJ/kg, respectively. The effects of the different combinations of ME and CP on growth performance are presented in Table 5. There were no interactions (P > 0.05) between ME and CP levels in any of the four indices. Significance also did not exist in any of the four indices (P > 0.05) between dietary CP treatments. Quails given diets with 11.51 MJ/kg exhibited better final BWs, weight gains, feed intake and feed efficiency than did those that received 12.13 MJ/kg (P < 0.05).
The effects of combinations of dietary metabolisable energy and protein on the growth responses of blue-breasted quailsFootnote § for weeks 1 to 4 (Experiment 2)

ME = metabolisable energy.
§ The number of total observations for female and male was 146 and 149, respectively.
† Sample size for BW and weight gain.
‡ Sample size for feed intake and feed efficiency.
* Significantly different from that of the other ME level (P < 0.05).
Discussion
For animals to achieve their full growth potential, it is necessary to provide them with sufficient nutrients. As nutrient requirements change with age, it is important to distinguish requirements at different growth stages (NRC, 1994). In this study, the fastest growth (g/day) of quails receiving dietary protein more than 220 g/kg occurred in week 2, followed by weeks 3 and 4; 5; 1; 6 and 8; and 7 (i.e. a slow initial growth rate was followed by an accelerated growth phase, and the growth rates then slowed; Figure 1). The increase in BW in females in week 8 was due to the rapid development of the ovaries and oviducts in preparation for the beginning of laying (Figure 2). Bernstein (Reference Bernstein1973) observed that BBQ growth was slow from 4 to 9 days of age, proceeded almost linearly until 4 to 5 weeks of age, and then decelerated. Pis and Luśnia (Reference Pis and Luśnia2005) showed the changes in BBQ growth using Gompertz curves. Slow initial growth followed by fast development was also observed in their study; growth began to slow after 25 days of age. These reported growth trends were confirmed in this study. In addition, a difference in mature BWs between males and females was noted by Prinzinger et al. (Reference Prinzinger, Misovic and Schleucher1993), Pearson (Reference Pearson1994), Pis and Luśnia (Reference Pis and Luśnia2005), and this study. As changes in linear growth occurred between 4 and 5 weeks of age, the growth stage was divided into two periods: weeks 1 to 4 and 5 to 8.
Although CP requirements could be estimated for each week from data collected weekly, it would be time and labour consuming to mix a different diet for each week. Furthermore, in practice, a single dietary CP concentration is normally recommended for several weeks. For example, a CP concentration of approximately 250 g/kg in starter diets for Japanese quails was reported (Weber and Reid, Reference Weber and Reid1967; Vogt, Reference Vogt1967; Lepore and Marks, Reference Lepore and Marks1971), and a concentration of 200 g/kg CP was considered suitable for females from 3 to 6 weeks of age (Vogt, Reference Vogt1967; Groop and Zucker, Reference Groop and Zucker1969). However, NRC (1994) recommended only 1 dietary CP concentration, 240 g/kg, for the whole growing period. In Experiment 1, individual CP requirements were very similar in the first 4 weeks so that the CP requirement was recalculated for weeks 1 to 4. As interaction existed in weight gain between ME and CP levels, the CP requirements were estimated on the basis of the respective ME. The requirements estimated by the one-slope quadratic broken-line model represented the minimum doses needed to achieve the best response, that is, it is not necessary to provide more than 245 g/kg CP when an ME of 13.39 MJ/kg is provided to quails from 0 to 4 weeks of age. With regard to the higher CP requirements computed by quadratic curvilinear regression and representing the maximum doses required to obtain the best response, Vedenov and Pesti (Reference Vedenov and Pesti2008) pointed out that the minimum requirement would be chosen if it was important to avoid wasting dietary CP, whereas use of the maximum requirement would ensure that quails receive sufficient dietary CP. In this study, the minimum requirement results of the weight gain and feed efficiency indices were similar; this similarity was also observed in Japanese quails (Weber and Reid, Reference Weber and Reid1967), Bobwhite quails (Wilson et al., Reference Wilson, Douglas and Nesbeth1977) and broilers (Sebastian et al., Reference Sebastian, Touchburn, Chavez and Lague1997). As BWs approached mature values after week 5, the weekly weight gains of quails fed dietary CP of more than 220 g/kg slowed down. Furthermore, in most cases, weekly weight gains were even smaller than in those receiving 160 or 190 g/kg CP. Thus, CP requirements for weeks 5 to 8 could not be computed by either the broken-line or the quadratic model.
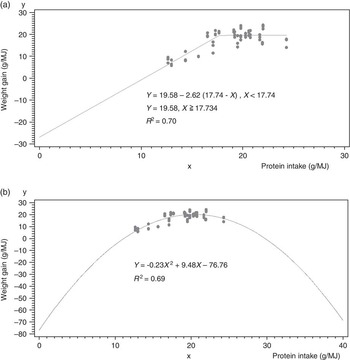
In Experiment 2, requirements on the basis of ME concentrations of 11.51 and 12.13 MJ/kg were estimated for birds from 0 to 4 weeks of age. The best weight gain and feed efficiency were achieved when the dietary CP level was more than 210 g/kg. By combining data from Experiments 1 and 2, both minimum and maximum protein intakes for the best growth performance were estimated by the one-slope quadratic broken-line model and quadratic curvilinear regression, respectively (Figure 3). These were 17.74 and 20.22 g/MJ and corresponded to dietary CP levels of 204 and 233 g/kg when the ME concentration was 11.51 MJ/kg. The main reason for the large scatter observed in the data points presented in Figure 3 is not due to the different ratios of males and females in the different cages, because Gompertz growth curves fitted for males and females were very close before 4 weeks of age in the report by Pis and Luśnia (Reference Pis and Luśnia2005) and a similar situation in real growth curves was observed in this study (Figure 2). After calculation of the coefficient of variation for each treatment in Experiments 1 and 2, the resultant large scatter is probably attributable to less uniformity in quail growth from 0 to 4 weeks of age in the same treatment. Although the means of BWs for 30 quails between treatments were very similar in the beginning, the range of the coefficient of variation for treatments was 8.9% to 12.0%, and a more severe phenomenon of 5.9% to 24.3% was observed in the end. As the BBQ is a new experimental animal model, unlike the many pure breeds and lines of experimental rats or mice, less uniformity in growth should be overcome by breeding in the future.
The regressions of the weight gain of blue-breasted quails on dietary protein levels by broken-line (a) and quadratic (b) models for 0 to 28 days of age. Average cage values for BW and feed intake were used for regression between weight gain and CP intake so that total observations were 60.

In Experiment 2, the quails given diets containing 11.51 MJ/kg performed better in terms of both weight gain and feed efficiency (P < 0.05) than did those receiving 12.13 MJ/kg. In Experiment 1, significance did not exist in both of the indices (P > 0.05) between the dietary treatments of 12.13 and 13.39 MJ/kg. Therefore, it can be concluded a dietary ME concentration of 11.51 MJ/kg is more appropriate for BBQ from 0 to 4 weeks of age.
In summary, it is not necessary to provide BBQ with very high CP diets, such as turkey starter feed, that contain approximately 300 g/kg CP (Bernstein, Reference Bernstein1971); they can achieve good performance with dietary CP of more than 204 g/kg on the basis of an ME of 11.51 MJ/kg for weeks 1 to 4.
Acknowledgements
The authors wish to thank Mr. Jeng-Chi Huang for his kindly help to take care of BBQ breeders and hatch eggs.