1. Introduction
Pulsed liquid jets are found in a wide range of situations. In nature, squids and jellyfish propel themselves with the help of liquid jets (Biewener Reference Biewener2003; Alexander Reference Alexander2006). In industry, pulsed jets are relevant in irrigation, ink-jet printing, internal combustion engines and medical devices, among others (Mitragotri Reference Mitragotri2006; Eggers & Villermaux Reference Eggers and Villermaux2008; Giannadakis, Gavaises & Arcoumanis Reference Giannadakis, Gavaises and Arcoumanis2008). The current knowledge on pulsed and continuous jets is summarized in reviews, e.g. from Bogy (Reference Bogy1979), Lin & Reitz (Reference Lin and Reitz1998), Eggers & Villermaux (Reference Eggers and Villermaux2008).
Recently, pulsed or transient microjets have received significant attention for their potential to operate as a needle-free injection device. Several mechanisms to accelerate small liquid volumes have been reported: Fletcher & Palanker (Reference Fletcher and Palanker2001), Fletcher et al. (Reference Fletcher, Palanker, Huie, Miller, Marmor and Blumenkranz2002) created a pulsed liquid microjet exiting a nozzle of
 $30~{\rm\mu}\text{m}$
in diameter formed from a borosilicate glass pipette. The microjet was formed by the displaced volume of a vapour bubble created from an electric discharge. They reported jet velocities of
 $60{-}90~\text{m}~\text{s}^{-1}$
induced by discharges of approximately 1 kV. The jets penetrated into a liquid medium and may be used as a cutting tool for microscopic incisions. Jagadeesh et al. (Reference Jagadeesh, Prakash, Rakesh, Allam, Krishna, Eswarappa and Chakravortty2011) produced jets from micro shock waves which can penetrate into soft tissue with the aim of a needleless drug delivery system. Han, Hah & Yoh (Reference Han, Hah and Yoh2011), Tagawa et al. (Reference Tagawa, Oudalov, Visser, Peters, Van der Meer, Sun, Prosperetti and Lohse2012, Reference Tagawa, Oudalov, El Ghalbzouri, Sun and Lohse2013) have presented results with their laser-based technique to generate high-speed jets; the jets reported by Han et al. (Reference Han, Hah and Yoh2011) reach speeds of up to
 $230~\text{m}~\text{s}^{-1}$
while the jets reported by Tagawa et al. (Reference Tagawa, Oudalov, Visser, Peters, Van der Meer, Sun, Prosperetti and Lohse2012) may reach up to
 $850~\text{m}~\text{s}^{-1}$
. Another experimental technique reported to create jets is by means of a shock-wave-induced cavitation bubble (Karri et al.
Reference Karri, Gonzalez-A, Loke, O’Shea, Klaseboer, Khoo and Ohl2012a
). This technique utilizes the nearly hemispherical expansion and collapse of the cavitation bubble to accelerate liquid through a small hole in a plate. In this specific geometry, the interaction of two jets leads to a liquid sheet which fragments into a fine spray. In a recent study Karri et al. (Reference Karri, Ohl, Klaseboer, Ohl and Khoo2012b
) utilized spark-generated millimetre size bubbles to study in detail the mechanism of jet formation through holes of radius in the range 0.5–12 mm. Schramm & Mitragotri (Reference Schramm and Mitragotri2002), Stachowiak et al. (Reference Stachowiak, Von Muhlen, Li, Jalilian, Parekh and Fletcher2007, Reference Stachowiak, Li, Arora, Mitragotri and Fletcher2009) have investigated methods to create fast microjets for needleless injection. Also, Arora et al. (Reference Arora, Hakim, Baxter, Rathnasingham, Srinivasan, Fletcher and Mitragotri2007) have shown that pulsed microjets do not penetrate deep into tissue. This is important as deep penetration is believed to cause pain and bruising. On the other hand, even though the volume delivered is small (2–15 nl) their in vivo experiments with rats demonstrate that pulsed microjets are capable of delivering therapeutic doses of insulin across the skin.
As the exit velocity of the jet increases, the jets become more unstable. Grant & Middleman (Reference Grant and Middleman1966) first conducted a systematic experimental study that they presented on an
 $L$
versus
 $U$
curve, where
 $L$
is the jet breakup length and
 $U$
the average exit velocity of the jet. They compared their experimental data with the analytical model for viscous jets previously suggested by Weber (see Grant & Middleman Reference Grant and Middleman1966) and made corrections, albeit empirical, to the model. They were able to show that their modified model improves the accuracy of predicting the breakup length of low-speed jets (up to
 $30~\text{m}~\text{s}^{-1}$
). Later, Reitz & Bracco (Reference Reitz and Bracco1986) carried out a linear stability analysis in which surface tension, viscous forces, and liquid inertia were taken into account; their theory describes well the breakup mechanism of low-speed jets but not those of the faster jets.
Small-scale jets have been the subject of considerable study in recent years. Lew, Klaseboer & Khoo (Reference Lew, Klaseboer and Khoo2007), Dijkink & Ohl (Reference Dijkink and Ohl2008) utilized the naturally occurring jetting of a collapsing cavitation bubble near a rigid boundary. Therefore, the boundary was perforated and the jet led to a net flow through the wall. The aim is to convert the spherical converging flow from a collapsing cavitation bubble into a directed jet. The converging flow from a collapsing hemispherical bubble also accelerates the flow towards the centre of the bubble. If the bubble is a hemisphere and the boundary is perforated at the jet impact point some of the radial inward flow will transform into a high-speed jet. This concept was tested in previous work using shock-wave-induced bubbles (Karri et al. Reference Karri, Gonzalez-A, Loke, O’Shea, Klaseboer, Khoo and Ohl2012a ) and thermally induced cavitation (Karri et al. Reference Karri, Ohl, Klaseboer, Ohl and Khoo2012b ). The present work uses almost perfectly hemispherical bubbles while simplifying the bubble creation mechanism by using an electrical breakdown at the plate surface, i.e. removing the need of a shock wave device or focused pulsed laser. The volume of the bubble is up to 100 times larger, leading to a considerable increase in the final jet velocity showing a new mechanism of spray formation. Also, the imaging has been improved to capture minute features of the microscopic high-speed process.
The objective of this study is to observe and discuss the fast jetting from hemispherical expanding and collapsing cavitation bubbles. We further aim to spark the interest of the reader in this device, which although simple allows the generation of remarkably fast flows. It offers interesting applications in atomization and needle-free drug delivery. The paper is organized in the following manner: § 2 describes the experimental setup and methodology; § 3 presents the bubble dynamics and the primary and slower jets created during expansion, and the fast jets created during the bubble’s collapse. As applications of fast jets may demand more viscous liquids we report on the effect of viscosity in § 4. The importance of some dimensionless parameters relevant to this study and energy considerations are discussed in § 5. Finally, the capability of our device to penetrate into a skin phantom is evaluated.
2. Experimental setup
2.1. Microjetting device
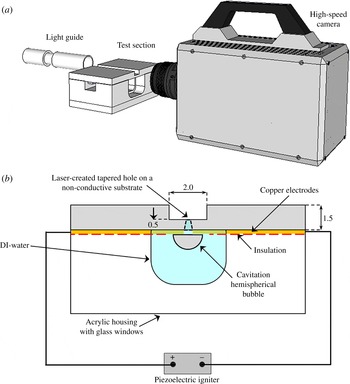
The experimental setup to create and study the high-speed jet is shown in figure 1(a,b). The bubbles are generated from a breakdown caused by high electric fields. The breakdown threshold of distilled water is of the order of
 $70~\text{MV}~\text{m}^{-1}$
(Lide Reference Lide2004). This field strength can be conveniently achieved with microelectrodes and a piezoelectric igniter (commonly found in electric lighters). The electrodes are etched on a copper plated printed circuit board (PCB, 1.5 mm overall thickness, but milled down to 0.5 mm near and on the opposite side of the electrodes); the thickness of the wires is approximately
 $100~{\rm\mu}\text{m}$
and their tips are separated by approximately
 $130~{\rm\mu}\text{m}$
. The variations are due to the etching process and in the range of
 $\pm 20~{\rm\mu}\text{m}$
. The hole is located precisely between the two electrodes and it is laser drilled into the thinned PCB plate. The epoxy material is drilled with a Q-switch and ns-pulsed Nd:YAG laser (New wave research, wavelength 532 nm, pulse duration 6 ns, 40 mJ pulse energy). This leads to a tapered hole (approximately 7°, see figure 1
b); the diameter on the electrode side is approximately
 $130~{\rm\mu}\text{m}$
while the diameter at the opposite side ranges between 13 and
 $20~{\rm\mu}\text{m}$
.
2.2. Imaging
The electrode side is submerged into the liquid, while the opposite site remains dry. Care has to be taken that the current does not leak through the liquid; therefore, the electrodes are insulated with nail polish except for a small area near their gap, as shown in figure 1(b). By pressing the igniter a spark is generated within the liquid and quickly a vapour bubble expands with its centre located just below the hole. The bubble and jet dynamics is imaged with a macro lens (Nikor,
 $f$
60 mm and a 30 mm extension tube) connected to a high-speed camera (Photron SA1.1) and the scene is illuminated with a bright fibre-coupled light source (metal halide bulb lamp, Sumita LS-M250). The camera is triggered from an oscilloscope, LeCroy HRO 64zi, 2 GHz maximum sampling rate.
By placing the PCB on a transparent acrylic box we can capture the bubble dynamics and the fast jets exiting the hole simultaneously. The box with a width of 8 mm and a length of 10 mm serves as a reservoir for deionized water and the silicone oils with viscosities of 10 cSt (MegaChem, Singapore), 50 cSt and 100 cSt (Dow Corning, USA) tested. For recording up to 360 000 frames per second (f.p.s.) the jet and the bubble dynamics can be observed simultaneously using a large
 $f$
-number; while for higher framing rates the field of view becomes limited and only the jet can be captured with sufficient detail.
Schematic diagram of the experimental setup (not drawn to scale): (a) imaging system; (b) perspective of the high-speed camera, PCB and electrodes mounted on the acrylic.

2.3. Current measurements
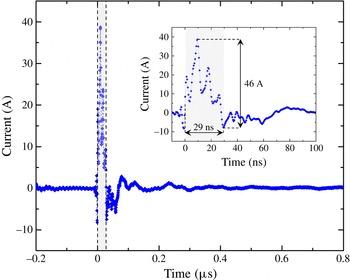
The piezoelectric device induces a large current between the electrodes within a few nanoseconds, thus we measured the rise time of the discharge between the electrodes as reported by Tellini & Giannetti (Reference Tellini and Giannetti1998). Figure 2 displays a typical piezoelectric signal recorded by the oscilloscope; the sampling rate is 2.0 GHz; the time measured from the time the rising edge triggers the acquisition process until the signal has decayed and starts to recover, is approximately 29 ns. In these first 29 ns, a potential difference of 2.3 kV was measured; since we used a
 $50~{\rm\Omega}$
resistor, the current generated, 46 A, is high enough to locally boil the liquid and produce the cavitation bubble. The subsequent peaks are likely to be the result of resonances in the electric system which vanish
 ${\sim}300~\text{ns}$
after the initial discharge.
A typical piezoelectric igniter signal that triggers the cavitation event. The graph shows the sub-microsecond timescale of the electric breakdown of 46 A, peak to peak in
 ${\sim}29~\text{ns}$
. The shaded region is shown in more detail in the inset of the figure.

3. Experimental results in water
3.1. Overview
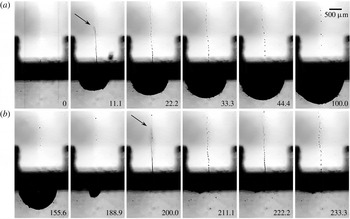
Bubble dynamics and the jets produced due to: (a) bubble expansion, (b) bubble collapse. The length of the bar in the upper right corner of the image is
 $500~{\rm\mu}\text{m}$
, time is in
 ${\rm\mu}\text{s}$
.

Once the igniter is pressed the camera is triggered and records the rapid events, all occurring within approximately
 $200~{\rm\mu}\text{s}$
. Figure 3 presents such a typical experiment recorded at 90 000 f.p.s. from which selected frames are shown. At time
 $t=0$
the current is applied, then the bubble expands in the liquid, i.e. below the dark stripe in the frames of figure 3. The bubble reaches its maximum size, its maximum vertical radius
 $R_{y}=1.0~\text{mm}$
, at
 $t=100~{\rm\mu}\text{s}$
, then it collapses at around
 $190~{\rm\mu}\text{s}$
. No after-bounces are observed indicating a mostly vaporous bubble. The shape of the bubble is hemispherical for most of the time and gets mildly deformed just prior to attaining its minimum size. Both the bubble expansion and the collapse lead to fast jets into the air above the dark stripe; the jets are indicated with arrows. The first and slower jet (
 $t=11~{\rm\mu}\text{s}$
) is driven by the expanding bubble to an average speed of
 $130~\text{m}~\text{s}^{-1}$
. The jet breaks up into droplets and has vanished when the second and faster jet exits the hole at time
 $t=200~{\rm\mu}\text{s}$
. Its averaged velocity is
 $270\pm 5~\text{m}~\text{s}^{-1}$
which is close to the speed of sound in air! The tip position for the velocity estimate is determined from a background subtracted frame; the measurement error is the result of a few pixels uncertainty in the tip position. The second jet is clearly driven by the collapse and shows a markedly blurred tip indicating fragmentation into a fine spray not resolved here. The pixel resolution of
 $14~{\rm\mu}\text{m}$
sets an upper limit of
 $28~{\rm\mu}\text{m}$
for the diameter of both jets at their base.
3.2. Jetting details
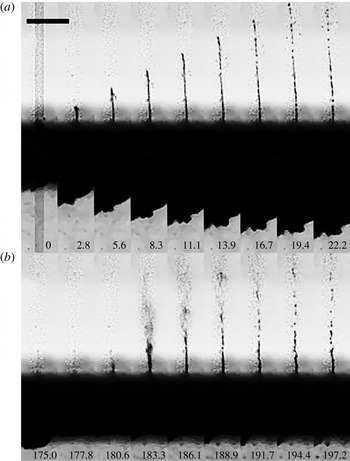
The dynamics of (a) the primary jet, and (b) secondary jet, recorded at 360 000 f.p.s. The length of the bar in the upper left corner of the image is
 $500~{\rm\mu}\text{m}$
, time is in
 ${\rm\mu}\text{s}$
.

We now look into more detail of the jet dynamics with a high temporal resolution. Figure 4 is recorded at a higher frame rate of 360 000 f.p.s. and shows the first jet in figure 4(a) and the second jet in figure 4(b). Note the time in microseconds on the bottom of the frames. Only the central part of the bubble below the plate is visible. In figure 4(a), the tip of the first jet exhibits a constant velocity of
 $80~\text{m}~\text{s}^{-1}$
until
 $t=11.1~{\rm\mu}\text{s}$
. A breakup is observed at
 $t=13.9~{\rm\mu}\text{s}$
, that is when the bubble expansion has noticeably decelerated. This time is close to the growth time of the most amplified Rayleigh mode of a stationary
 $10~{\rm\mu}\text{m}$
diameter water column of approximately
 $11~{\rm\mu}\text{s}$
, see Eggers & Villermaux (Reference Eggers and Villermaux2008, (equation 59)). Thus the jet breakup is probably governed by capillary pinching (Lin & Reitz Reference Lin and Reitz1998). In particular the shape of the pinch-off seems unaffected by the shear layer, which agrees with the prediction for a low Weber number jet, i.e. the
 $We_{a}={\it\rho}_{a}r_{h}V_{j}^{2}/{\it\sigma}$
is approximately 1;
 $We_{a}$
is the Weber number based on air density
 ${\it\rho}_{a}$
, hole radius
 $r_{h}$
, jet exit velocity
 $V_{j}$
and liquid surface tension
 ${\it\sigma}$
. Thus capillary instability is dominating (Eggers & Villermaux Reference Eggers and Villermaux2008, equation 129). Note that the jets mentioned in these references are all steady whereas in this work they are transient. The initial velocity of the jet is sustained for a short period of time, as shown in figure 4; that allows us to estimate qualitatively the shape of the jet leaving the orifice.
The bubble wall velocity decreases from the second frame in figure 4(a) while the jet velocity remains constant. This suggests that momentum is imparted to the liquid inside the hole. Only later is the linear momentum of the jet reduced by viscous drag and gravity. As the bubble expansion decelerates less fluid is supplied into the jet and therefore the jet thins. From mass conservation, we estimate that only approximately 25 % of the liquid within the hole is ejected as a first jet. As the bubble reaches maximum expansion no more liquid exits the hole, as shown in figure 3, from the fifth frame onwards.
Figure 4(b) displays the much different and faster shape of the second jet. In the first frame at
 $t=175.0~{\rm\mu}\text{s}$
the bubble at the bottom of the plate is approaching its minimum volume. In the next frame the bubble remains cannot be discerned from the background, thus liquid is now flowing into the hole. The exit velocity of the jet determined from the following two frames is
 $376~\text{m}~\text{s}^{-1}$
, i.e. 9 % faster than the speed of sound (at
 $20\,^{\circ }\text{C}$
and 1 bar atmospheric pressure). The height of the jet at
 $t=183.3~{\rm\mu}\text{s}$
is 1.2 mm, and the upper part is a spray of tiny drops that cannot be resolved with the imaging system while the lower part retains a cylindrical shape. The lower liquid column starts to fragment at
 $t=188.9~{\rm\mu}\text{s}$
similar to that of the first jet. The spray on the tip cannot be explained with the Rayleigh–Plateau instability. The jet depicted in figure 4(b) at
 $t=183.3~{\rm\mu}\text{s}$
shows some similarity to the second wind regime described by Lin & Reitz (Reference Lin and Reitz1998), a fragmented tip followed by an intact liquid column; yet, the jet in the current work is transient while Lin & Reitz (Reference Lin and Reitz1998) discuss steady jets.
3.3. Jet velocity
The driving mechanism for the two jets is rather different. While the first jet is accelerated due to the high pressure during phase change of the liquid, the second and faster jet is caused by the converging and accelerating fluid during bubble collapse. It is expected that the resulting speeds are different. For the experiment the camera is triggered on the discharge current which is measured with a high-bandwidth current clamp. Recordings are taken at 360 000 f.p.s. The spatial and temporal resolution limits the uncertainty in the speed of the jet tip to
 $\pm 10~\text{m}~\text{s}^{-1}$
while the blurred view at the plate causes a larger spatial error of the vertical radius,
 $R_{y}$
, of
 $\pm 55~{\rm\mu}\text{m}$
.
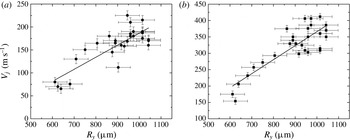
We find clear dependence of the speeds of both jets as function of the vertical bubble size. Figures 5(a) and 5(b) show the increase of the speed for the first and second jet, respectively. Both have a minimum speed given by the smallest bubble we can produce with a radius of 0.6 mm; the highest speed is found for the largest bubbles with a radius of 1.05 mm. The first jet, figure 5(a), starts at
 $60~\text{m}~\text{s}^{-1}$
; with increasing size we find a rather larger scatter and it reaches up to
 $225~\text{m}~\text{s}^{-1}$
. In contrast, the second jet, figure 5(b), increases approximately linearly from
 $200~\text{m}~\text{s}^{-1}$
to
 $300~\text{m}~\text{s}^{-1}$
and then shows a more scattered pattern with up to a supersonic speed of
 $400~\text{m}~\text{s}^{-1}$
. The variability of the electric breakdown is causing the observed variation in bubble sizes, and thus mechanical energies of the bubble. Here, we try to limit this variability by using a single device for all the data presented in figure 5; no clear dependence of the bubble radius on discharge current is found.
The exit velocity of the jets as a function of the vertical bubble radius
 $R_{y}$
: (a) first jets; (b) second jets.

3.4. The shape of the first and second jets
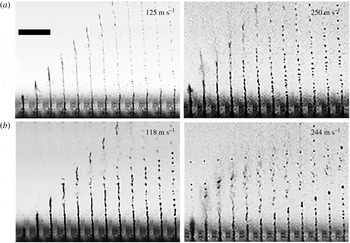
Next, we compare the shape of the first and second jet using framing rates of 450 000 f.p.s. for similar exit speeds. Figures 6(a) and 6(b) show consecutive frames of the first and second jet, respectively, approximately 120 and
 $250~\text{m}~\text{s}^{-1}$
. The time between adjacent frames is
 $2.2~{\rm\mu}\text{s}$
. At these high speeds we find a disintegration of the jet tip which is distinct from the Rayleigh–Plateau instability. Although the second jet at
 $244~\text{m}~\text{s}^{-1}$
seems rather similar to the first one, it does not have a smooth cylindrical surface when it exits the hole. It already leaves the plate in the form of a mist; later, the tip is followed by a wavy cylindrical liquid mass. In contrast, the first jet at a similar velocity, figure 6(a)
 $250~\text{m}~\text{s}^{-1}$
, fragments into a mist at its tip with a smooth base. Hydrodynamic cavitation may lead to the fragmentation of the jet. The differences are discussed below.
The slower first and second jets at
 $125~\text{m}~\text{s}^{-1}$
and
 $118~\text{m}~\text{s}^{-1}$
respectively, show a weaker disturbance at their tip and a similar droplet breakup in the later frames.
Comparison of first and second jets of water for two different exit speeds: (a) first jets; (b) second jets. The length of the bar in the upper left corner of the image is
 $500~{\rm\mu}\text{m}$
, the interframe time is
 $2.2~{\rm\mu}\text{s}$
.

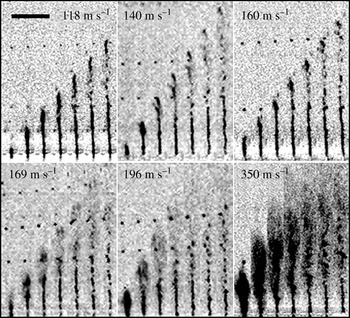
Second jets of water of increasing velocity. The bar in the upper left corner of the image is
 $500~{\rm\mu}\text{m}$
in length, the interframe time is
 $2~{\rm\mu}\text{s}$
.

The frames in figure 7 depict the dynamics of the second jet sorted according to their maximum velocities. The images in each frame are spaced
 $2~{\rm\mu}\text{s}$
in time. The velocity is indicated at the top of each frame, increasing from left to right and top to bottom. At the lowest velocities,
 $V_{j}\leqslant 118~\text{m}~\text{s}^{-1}$
the jet exits the hole with a rather stable shape, still the jet tip fragments within
 $8~{\rm\mu}\text{s}$
after exiting the hole. In the velocity range
 $140\leqslant V_{j}<169~\text{m}~\text{s}^{-1}$
the jet tip is slightly thicker than its base and the jet is developing from a column shape to a spray. Above
 $169~\text{m}~\text{s}^{-1}$
the tip leaves the hole already as spray and its base diameter increases with velocity. Very pronounced spraying is observed at
 $350~\text{m}~\text{s}^{-1}$
; unfortunately, the imaging resolution does not allow a discussion of the droplet size, yet it is evident that more of the liquid is atomized at this high velocity.
A possible explanation for the transition from a laminar jet to a spray is the nucleation of cavitation within the microchannel. In order to clarify if cavitation occurs after the bubble collapse the device was completely submerged under water and a high-speed video recorded, see figure 8. Here, the main cavitation bubble collapses around
 $t=146.7~{\rm\mu}\text{s}$
; at
 $t=153.3~{\rm\mu}\text{s}$
a vapour bubble emanates from the hole. This cylindrical bubble increases in length over the next two frames and collapses at
 $t=173.4~{\rm\mu}\text{s}$
. We can observe from these images that cavitation is not limited to the side with the electrodes.
Bubble collapse with both sides immersed in water. A vapour cavity forms, after the collapse of the main bubble, on the opposite side which collapses around
 $t=173.4~{\rm\mu}\text{s}$
. The length of bar at the upper left side of the image is
 $500~{\rm\mu}\text{m}$
, time is in
 ${\rm\mu}\text{s}$
.

4. Jets in viscous liquids
For practical purposes and for a better understanding of the fluid mechanics a study of the effect of viscosity on the jet exit velocity was performed. It is expected that the shear stress in the hole may reduce and even limit the jet speeds. In the following experiments, transparent Newtonian silicone oils with a viscosity of 10, 50, and 100 cSt were tested. To present the data in a meaningful way we compare the first jet with the second jet of similar exit speeds for the three above mentioned viscosities.
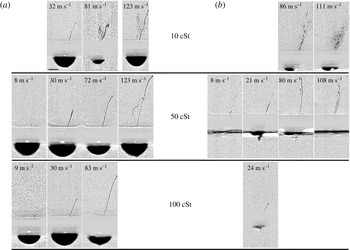
Jets of similar velocity induced by the expansion of the cavitation bubble in silicone oils: (a) first jets, average bubble size is
 $R_{y}=613\pm 55~{\rm\mu}\text{m}$
; (b) second jets, average bubble size is
 $R_{y}=606\pm 36~{\rm\mu}\text{m}$
; the length of the bar in the lower left corner of the first frame at the top is
 $500~{\rm\mu}\text{m}$
.

Figure 9(a) depicts the first jetting, while figure 9(b) shows the second jet, i.e. during the bubble collapse. These cases are sorted into four velocity ranges from left to right with increasing maximum velocity of the jet tip. We chose comparable velocities (if available) for the first and second jet, figures 9(a) and (b).
A second device was fabricated for this study. Here the laser drilling lead to a slightly slanted hole; therefore, the jet exits under some angle to the vertical; the speeds are measured along the jet direction. Four ranges of velocities are studied. For the first jet, figure 9(a), we have selected the image depicting the most extended intact jet, i.e. before breakup, while for figure 9(b), the jet is depicted just after minimum bubble volume.
We start with the first jets shown in figure 9(a). At the lowest viscosity the jets observed are always faster than the smallest velocity range of
 $8~\text{m}~\text{s}^{-1}$
and therefore omitted, while at highest viscosity no first jets faster than
 $83~\text{m}~\text{s}^{-1}$
were found. Jets of similar velocity are more stable at higher viscosities, e.g. we find an unstable jet at 10 cSt with a velocity of
 $81~\text{m}~\text{s}^{-1}$
while at the same velocity it is stable at 100 cSt.
Figure 9(b) depicts the second jets created by the collapse of the cavitation bubble. The jets of 10 cSt are unstable at both 86 and
 $111~\text{m}~\text{s}^{-1}$
. Also, they fragment into smaller droplets as the velocity increases. At
 $80~\text{m}~\text{s}^{-1}$
the jet of 50 cSt is unstable: it is no longer a smooth thin column of liquid and at
 $108~\text{m}~\text{s}^{-1}$
the instability of the jet is more pronounced. At a viscosity of 100 cSt a second jet is rarely observed and we present one of the few cases with a velocity of
 $24~\text{m}~\text{s}^{-1}$
in figure 9(b) bottom image. Interestingly, in a more viscous fluid the second jets as portrayed in figure 9(b) have a lower velocity than the first jet. This can be explained by the fact that the flow focusing during the relatively slow bubble shrinkage is hindered by viscous stresses. In contrast the rapid expansion may be lesser affected because boundary layers need time to develop. To substantiate this explanation, we estimate the boundary layer thickness for the highest velocity of
 $u=100~\text{m}~\text{s}^{-1}$
at the highest viscosity of
 ${\it\nu}=10^{\text{-4}}~\text{m}^{2}~\text{s}^{-1}$
. The timescale is given by the length,
 $x=0.5~\text{mm}$
, of the channel and the velocity. Thus the boundary layer grows to
 ${\rm\Delta}y\approx ({\it\nu}x/u)^{0.5}\approx 20~{\rm\mu}\text{m}$
which is smaller than the downstream radius of the channel of
 $65~{\rm\mu}\text{m}$
. In other words, the flow of the first jet is not hindered as much as in a Poiseuille-type flow.
The second jet is driven by the flow focusing from the collapsing bubble. In the viscous oils the collapse will be hindered by the normal viscous stresses at the bubble interface and by the boundary layers developing at the plate. Besides, the electric breakdown in a hydrocarbon fluid (silicon oil) forms non-condensable gas that upon collapse cushions the inward flow.
The shape of cavitation bubbles of similar size at maximum expansion nucleated in liquids of different viscosities. The length of the bar at the upper right corner of the image is
 $500~{\rm\mu}\text{m}$
. (a) Water,
 $R_{eq}=840~{\rm\mu}\text{m}$
; (b) silicone oil, 10 cSt,
 $R_{eq}=740~{\rm\mu}\text{m}$
; (c) silicone oil 50 cSt,
 $R_{eq}=710~{\rm\mu}\text{m}$
; (d) silicone oil 100 cSt,
 $R_{eq}=780~{\rm\mu}\text{m}$
.

To gain better insight we discuss the effect of the different silicone oils on the bubble shape and compare them with the low-viscosity water case. Figure 10 depicts the shape of the bubble at maximum expansion with increasing viscosity from left to right. Interestingly, while figure 10(a) demonstrates that the cavitation bubble created in water expands and displays an almost hemispherical shape at maximum expansion, the cavities nucleated in the more viscous liquids depart from the hemispherical shape. Figure 10(b–d) portrays the lifting of the edge of the bubble which increases with increasing viscosity, i.e. 10, 50 and 100 cSt silicone oil, respectively. This deformation may be caused by the boundary layer in the liquid film between the bubble and the substrate. This boundary layer is separating from the substrate because of the adverse pressure gradient which develops during the deceleration of the bubble wall. From viscous diffusion it is expected that the height of the boundary layer
 ${\it\delta}$
increases with
 $\sqrt{{\it\nu}}$
which seems approximately the case in figure 10(b–d). A similar boundary layer separation has been found for boiling bubbles on heated substrates (Van Ouwerkerk Reference Van Ouwerkerk1971, Reference Van Ouwerkerk1972).
For comparison of the volume dynamics with a viscous Rayleigh–Plesset equation we extract the equivalent radius,
 $R_{eq}$
, of a hemisphere with the same volume as the cavity (Gonzalez-Avila et al.
Reference Gonzalez-Avila, Khoo, Klaseboer and Ohl2011).
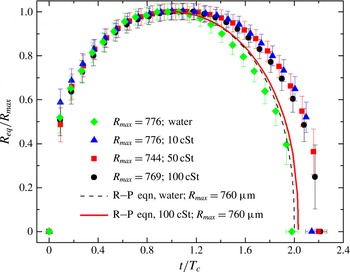
Bubble dynamics in the different liquids tested and plotted normalized with
 $R_{max}$
and the Rayleigh collapse time,
 $T_{c}$
; the dashed and solid curves depict the solution to the Rayleigh–Plesset equation for water and 100 cSt silicone oil respectively.

Figure 11 displays the size of the bubble,
 $R_{eq}(t)$
, normalized by the bubble’s maximum size,
 $R_{max}$
, as a function of time,
 $t$
, for the four different liquids tested; the experimental curves suggest that despite reaching a similar maximum size the value of the collapse time tends to increase for the cavities produced in a more viscous environment. The bubble dynamics is compared with the Rayleigh–Plesset equation (Brennen Reference Brennen1995):
 $$\begin{eqnarray}R\ddot{R}+\frac{3}{2}{\dot{R}}^{2}=-\frac{P_{\infty }}{{\it\rho}_{l}}-\frac{4{\it\nu}_{l}{\dot{R}}}{R},\end{eqnarray}$$
where
 $P_{\infty }$
is the pressure in the liquid far away from the bubble,
 ${\it\rho}_{l}$
is the density of the liquid, and
 ${\it\nu}$
is the kinematic viscosity. The initial conditions are
 ${\dot{R}}(t=0)=0$
and
 $R(t=0)=R_{max}$
and the Rayleigh collapse time is given by
 $$\begin{eqnarray}T_{c}=0.915R_{max}\sqrt{\frac{{\it\rho}_{l}}{P_{\infty }}}.\end{eqnarray}$$
Two solutions of the Rayleigh–Plesset equation are plotted in figure 11. The dashed line represents the Rayleigh–Plesset solution for water and the continuous line that for 100 cSt silicone oil.
The radial bubble dynamics shows a symmetric expansion–collapse curve of the expected duration of
 $2T_{c}$
, which is nicely reproduced with the Rayleigh–Plesset equation, dashed line in figure 11. In the silicon oils we find a non-symmetric expansion–collapse cycle with a slowing down of the bubble dynamics during the collapse. The model (solid line in figure 11) predicts an increase of the collapse time of about 3 % while the experiments show an increase of 22 % for the most viscous oils. A possible explanation is that the boundary layer separation forms a liquid volume near the substrate which does not contribute to the spherically convergent flow during collapse thereby prolonging the collapse duration.
5. Dimensionless parameters
5.1. Importance of Weber number
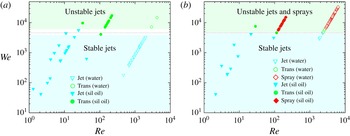
Weber number versus Reynolds number: (a) first jets; (b) second jets. The open symbols are the tests performed with water and the filled symbols are the silicone oil tests. All the jets become unstable at
 $We\sim 4600$
.

Figure 12 plots Weber number (
 $We={\it\rho}_{l}hV_{j}^{2}/{\it\sigma}$
) versus Reynolds number (
 $Re=hV_{j}/{\it\nu}$
);
 $h$
is the nozzle exit diameter. The open symbols are the tests performed with water while the filled symbols represent silicone oil experiments. For the first jet, figure 12(a), as well as for the second jet, figure 12(b), transitional spray is found for the range of
 $We=4600\pm 800$
; figure 12(a) shows a thin clear area that corresponds to
 $We=4600\pm 800$
. For this
 $We$
the jet is no longer a smooth liquid column; moreover, as
 $We$
increases the jet shows no-intact breakup length (i.e. it fragments at the nozzle exit), thus it leaves the nozzle as a spray; also, we observe an increase in the width of the jet at the exit of the nozzle. As pointed out by Lin & Reitz (Reference Lin and Reitz1998), beyond the first-wind regime different results have been reported with regard to the breakup length; these discrepancies appear to be associated with internal flow patterns induced by flow separation and cavitation. A long breakup length is exhibited by jets with detached flows while very short breakup lengths are found in cavitating nozzles; diesel injectors, where cavitation is likely to be present, show no-intact breakup length as the fluid exiting the nozzle is atomized when it leaves the injector (Chaves et al.
Reference Chaves, Knapp, Kubitzek, Obermeier and Schneider1995).
Interestingly, our experimental results show that although the process of jetting for the first and second jets is rather different, in both cases the transition occurs at a similar Weber number. Cavitation inside the microchannel may contribute to the spray formation. Similar geometries and velocities for pulsed jets are found at injection valves for fuels (Payri et al.
Reference Payri, Bermudez, Payri and Salvador2004). There, cavitation is prominently occurring and causing the transition from a laminar jet to a spray when the cavitation bubble reaching the nozzle exit expands. Cavitation may be present in both first and second jets; nonetheless, its presence is due to different mechanisms: for the first jet, a velocity of approximately
 $100~\text{m}~\text{s}^{-1}$
is reached within less than
 $3~{\rm\mu}\text{s}$
, thus the acceleration of the liquid is more than
 $3\times 10^{7}~\text{m}~\text{s}^{-2}$
. Therefore, enormous shear is generated at the channel walls and we can expect shear-induced cavitation (Joseph Reference Joseph1998). Another possibility could be the reflection of a shock wave from the liquid–gas interface within the channel, similar to the experiments reported by Ando, Liu & Ohl (Reference Ando, Liu and Ohl2006). Here too, a shock wave is generated following the electric breakdown which has been observed below the plate using strobe photography (not shown here). Upon reflection of this shock wave strong tension at the liquid–gas interface within the funnel may cause cavitation. With respect to the second jet, as portrayed in figure 8, cavitation can travel through the microchannel; as it reaches the nozzle exit it expands due to the lower ambient pressure. Figure 7 depicts that for jet exit velocities above
 $196~\text{m}~\text{s}^{-1}$
the width of the jet increases. The observation of the increase of the cone angle has been reported and attributed to cavitation previously by Chaves et al. (Reference Chaves, Knapp, Kubitzek, Obermeier and Schneider1995), Ganippa et al. (Reference Ganippa, Bark, Andersson and Chomiak2004) and Payri et al. (Reference Payri, Bermudez, Payri and Salvador2004). However, other mechanisms may also lead to jet instability such as nozzle internal flow, jet velocity profile and turbulence at the exit of the nozzle (Lin & Reitz Reference Lin and Reitz1998). In addition to that, the interface between a liquid jet and the surrounding gas is naturally unstable (Kelvin–Helmholtz instability), thus for large relative velocities droplets are stripped from the jet due to aerodynamic forces at the gas–liquid interface (Reitz & Bracco Reference Reitz and Bracco1982; Eggers & Villermaux Reference Eggers and Villermaux2008; van Hoeve et al.
Reference van Hoeve, Gekle, Snoeijer, Versluis, Brenner and Lohse2010).
5.2. Energy considerations
Vogel et al. (Reference Vogel, Noack, Nahen, Theisen, Busch, Parlitz, Hammer, Noojin, Rockwell and Birngruber1999) report that up to 23 % of the laser energy can be converted into bubble energy for ns-laser pulses. Optimum focusing of the laser would allow generating a 1.4 mm radius bubble with a 5 mJ laser pulse. In our experiments the electric energy,
 $E_{e}$
, assuming a constant breakdown voltage is given by
 $$\begin{eqnarray}\displaystyle E_{e}=\int _{t_{0}}^{t_{f}}I(t)\text{d}t\,V_{e}. & & \displaystyle\end{eqnarray}$$
We only integrate from
 $t_{0}=0$
to
 $t_{f}=29~\text{ns}$
, see figure 2. The subsequent small-amplitude oscillations are likely to be caused by oscillations from inductances and capacitances of the cabling and the piezoelectric device.
 $V_{e}$
is estimated from the dielectric strength coefficient of
 $70~\text{MV}~\text{m}^{-1}$
for water and
 $15~\text{MV}~\text{m}^{-1}$
for silicone oil using the measured distance between the electrodes of
 $130~{\rm\mu}\text{m}$
. The bubble maximum radius allows us to determine the potential energy stored in the liquid,
 $E_{b}$
, as
 $$\begin{eqnarray}\displaystyle E_{b}={\textstyle \frac{2}{3}}{\rm\pi}(P_{stat}-P_{v})R_{y}^{3}. & & \displaystyle\end{eqnarray}$$
The kinetic energy of the jet is very crudely estimated as
 $$\begin{eqnarray}E_{j}=mV_{j}^{2}/2,\end{eqnarray}$$
assuming that the liquid in the jet moves at a constant velocity.
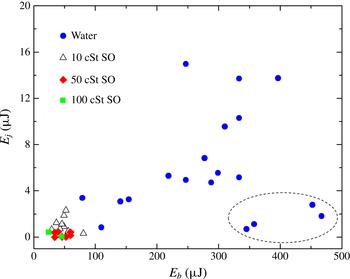
Jet kinetic energy,
 $E_{j}$
, versus the cavitation bubble energy,
 $E_{b}$
.

Applying these estimates for the energy, we obtain figure 13; note that this figure shows fewer data points than figure 12 because the tests conducted at the higher frame rates only captured the jet emerging from the hole, thus no bubble size information is available. For the tests conducted in water (see also figure 5), since the bubble grows as a hemispherical cap, the
 $E_{b}$
values presented in figure 13 provide a good estimate. However, for the more viscous liquids the
 $R_{y}$
value is over-estimated, thus the
 $E_{b}$
values presented for the silicone oil tests represent an upper bound of the bubble energy.
For water and low-viscosity silicone oil we see a good correlation of the jet energy,
 $E_{j}$
, with the liquid energy,
 $E_{b}$
. Interestingly, some of the larger bubbles create rather slow jets, as portrayed by the data points inside the dotted ellipse of figure 13; this may occur if these bubbles are created off-centre and then upon collapse the converging flow is not effectively driven through the hole. Only two jets were observed for the tests of the 100 cSt silicone oil and it can be seen that their kinetic energy is lower than that of the tests of 10 and 50 cSt oil. The efficiency scales with the square of the velocity, thus the conversion of the energy of the cavitation bubble to the kinetic energy of the jet is lower for the tests of higher viscosity. We found that the ratio of jet kinetic energy,
 $E_{j}$
, to bubble energy,
 $E_{b}$
, is 2.2 % for the tests of 10 cSt oil and 0.4 % for the tests of 50 cSt oil. For the water tests this ratio is 2.3 %. The conversion efficiency of our device is still considerably lower than the one found for strongly focused laser pulses (Vogel et al.
Reference Vogel, Noack, Nahen, Theisen, Busch, Parlitz, Hammer, Noojin, Rockwell and Birngruber1999); less tight focusing strongly reduced the efficiency to only 10 %. Also, Fletcher & Palanker (Reference Fletcher and Palanker2001) report that
 ${\sim}$
10 % of the electric energy is used to create the cavitation bubble, thus their device is four-fold more efficient than ours.
6. Jetting into agarose
6.1. Liquid penetration into agarose
Here, we report on the capability of the device to produce jets that can penetrate into an elastic medium, for application to needle-free transport of liquids, i.e. medication. The ability to fracture and penetrate elastic surfaces is of importance to deliver drugs transdermally. Agarose gel (1 % by weight in water) is a common phantom (Arora et al. Reference Arora, Hakim, Baxter, Rathnasingham, Srinivasan, Fletcher and Mitragotri2007; Nayar et al. Reference Nayar, Weiland, Nelson and Hodge2012) for human skin and is transparent, which allows visualization of the injection process.
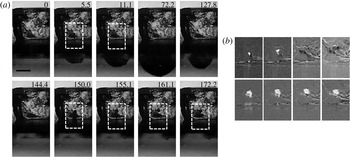
(a) The penetration of the first jet (top row) and second jet (bottom row) into 1 % agarose. The dotted white rectangle indicates the position of injection, the length of the black bar is
 $500~{\rm\mu}\text{m}$
. (b) Enhanced and magnified view of the injection. The frames are background subtracted; the injected volume is visible as a white blob. The top four images of (b) correspond to the rightmost top four images from left to right of (a). Also, the bottom four images of (b) correspond to the rightmost bottom four images from left to right of (a).

Figure 14 is from a typical experimental run revealing the injection dynamics. In this test a small block of agarose of approximate size
 $2~\text{mm}\times 2~\text{mm}\times 2~\text{mm}$
is placed on top of the hole before the jet is actuated. Figure 14(a) is a bright-field image sequence of the injection process. In the top row, second and third frame, a small liquid blob within the sample is visible. For contrast enhancement the marked rectangles from figure 14(a) are background subtracted and displayed in figure 14(b). The top row of figure 14(b) reveals the structural damage within the sample as a white region. Interestingly, the contrast ceases, which we speculate is from recovering of the structure; after
 $72~{\rm\mu}\text{s}$
the initial blob is not visible anymore.
The bottom row of figure 14(a) shows the injection of liquid after the bubble collapse, i.e. due to the second jet at
 $t>144~{\rm\mu}\text{s}$
. At
 $t=150~{\rm\mu}\text{s}$
the width of the liquid penetrating into the agarose is thicker than the original jet, thus the liquid stops penetrating at a depth of
 ${\sim}280~{\rm\mu}\text{m}$
but the fluid that is still incoming expands the lateral walls of the agarose sample. The volume injected remains visible in the successive frames. This permanent injection is probably a two-stage process: the primary jet opens up a fracture plane along which the second jet can invade the sample. The contrasted area, see bottom row of figure 14(b), reveals that more liquid is injected from the second jet while the penetration depth for both jets is similar.
6.2. Comparison with other needle-free injection techniques
Schramm & Mitragotri (Reference Schramm and Mitragotri2002) have studied the penetration of a jet into porcine and human skin; the jet can penetrate into the skin provided it can overcome the failure mechanics of skin. They also considered two types of criteria for skin failure. One criterion measures the jet impact to a critical local stress while a second examines the energy density to a critical energy density of failure. Later, Schramm-Baxter & Mitragotri (Reference Schramm-Baxter and Mitragotri2004) reported that the exit power of the jet is sufficient to describe how both jet penetration and lateral dispersion depend on jet velocity and nozzle diameter.
Following their approach we have an exit jet power, assuming constant velocity across the orifice, of
 $$\begin{eqnarray}\displaystyle P_{j}={\textstyle \frac{1}{8}}{\rm\pi}{\it\rho}_{l}h^{2}V_{^{j}}^{3}. & & \displaystyle\end{eqnarray}$$
For their lowest power tested, i.e. 1 W, the distance from the skin surface to the maximum width of dispersion was
 $200~{\rm\mu}\text{m}$
. Interestingly, the first jets reported here have an exit power of 66 mW, but they can penetrate into the agarose sample. One explanation may be the difference in material properties: polyacrilamide used by Schramm-Baxter & Mitragotri (Reference Schramm-Baxter and Mitragotri2004) has a Young’s modulus of 380 kPa. Pailler-Mattei, Bec & Zahouani (Reference Pailler-Mattei, Bec and Zahouani2008) report a Young’s modulus of human skin in the range
 $11~\text{kPa}\leqslant E\leqslant 28~\text{kPa}$
, for a penetration depth of 1–5 mm; their measurements show that the Young’s modulus values measured tend to increase with penetration depth. Ahearne et al. (Reference Ahearne, Yang, El Haj, Then and Liu2005) report for a similar agar concentration of 1.25 % a value of approximately 17 kPa, thus in the range relevant for skin. Obviously, in a softer sample it is easier to overcome both the critical local stress and the critical energy density; however, Tagawa et al. (Reference Tagawa, Oudalov, El Ghalbzouri, Sun and Lohse2013) report successful penetration with an exit power of the jet of only 23 mW (for
 $30~{\rm\mu}\text{m}$
jet diameter at
 $40~\text{m}~\text{s}^{-1}$
) into human skin and gelatin. Both the jets reported by Tagawa et al. (Reference Tagawa, Oudalov, El Ghalbzouri, Sun and Lohse2013) and from our experiments are considerably thinner than the ones from Schramm-Baxter & Mitragotri (Reference Schramm-Baxter and Mitragotri2004); thus besides the jetting power the critical stress may be relevant for penetration, too.
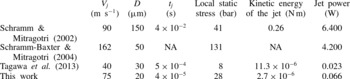
Comparison of recent experimental work done on high-speed microjets.

Table 1 summarizes the jet velocities and diameters used by different groups to compare the local static stress, jet kinetic energy, and jet power. The local static stress is
 ${\it\rho}_{l}V_{j}^{2}/2$
and the kinetic energy of the jet is
 $KE=({\rm\pi}/8){\it\rho}_{l}h^{2}V_{j}^{3}t_{j}$
, where
 $t_{j}$
is the interaction time of the jet with the surface. The velocity and diameter considered for the first three studies are those that correspond to the minimum values at which penetration was observed. Table 1 illustrates that the kinetic energy of the jets reported here are up to five orders of magnitude smaller while the jet power is two orders of magnitude smaller. The static stresses of our jets are comparable to those of Schramm & Mitragotri (Reference Schramm and Mitragotri2002). It is likely to be this large static load which overcomes the yield strength of the material. Similarly, the jets reported by Tagawa et al. (Reference Tagawa, Oudalov, El Ghalbzouri, Sun and Lohse2013) at
 $40~\text{m}~\text{s}^{-1}$
and
 $30~{\rm\mu}\text{m}$
have a power of
 ${\sim}1/3$
that of our jets and are able to penetrate into gelatin in a manner similar to that shown in figure 14.
Our method to create microjets has some similarity to several techniques presented in recent years which we will compare next. Fletcher & Palanker (Reference Fletcher and Palanker2001) and Fletcher et al. (Reference Fletcher, Palanker, Huie, Miller, Marmor and Blumenkranz2002) report microjets created by an electric discharge capable of delivering only 50–200 pl; however, their aim was to inject drugs into small blood vessels of only
 ${\sim}60~{\rm\mu}\text{m}$
. The laser-induced jets reported by Tagawa et al. (Reference Tagawa, Oudalov, Visser, Peters, Van der Meer, Sun, Prosperetti and Lohse2012, Reference Tagawa, Oudalov, El Ghalbzouri, Sun and Lohse2013) can inject much more liquid; they report a volume of approximately 10 nl delivered, of which
 ${\sim}$
90 % is injected into gelatin (5 wt%). This is facilitated by the deep penetration depth of up to 5 mm. They report a minimum velocity for penetration of approximately
 $80~\text{m}~\text{s}^{-1}$
for a jet diameter of approximately
 $30~{\rm\mu}\text{m}$
; similar values can be obtained with our jet, yet we expect an upper limit as the jets become unstable above
 $150~\text{m}~\text{s}^{-1}$
. Also, the volume delivered with our jets is similar, referring to figure 14(b), the fourth frame from the left, lower row, we estimate from the size of the white region of
 ${\sim}110~{\rm\mu}\text{m}$
in diameter a volume of
 ${\sim}$
6 nl injected into agarose.
Although the jet creation mechanism of Tagawa et al. (Reference Tagawa, Oudalov, Visser, Peters, Van der Meer, Sun, Prosperetti and Lohse2012, Reference Tagawa, Oudalov, El Ghalbzouri, Sun and Lohse2013) is very different, the physics of injection is similar. They use a single thin jet that at high speeds causes skin failure, and then the thicker portion of the jet following the tip makes use of the gap to penetrate into. In the present study the first jet is crucial to produce the rupture of the surrogate skin (as seen in figure 14 a) so that the second jet can penetrate more effectively. It is likely that once the surface is ruptured later jets can penetrate easily; for instance triggering the device multiple times may allow delivering doses that correspond to realistic therapeutic volumes, see Arora et al. (Reference Arora, Hakim, Baxter, Rathnasingham, Srinivasan, Fletcher and Mitragotri2007).
The jet injection depth of Tagawa et al. (Reference Tagawa, Oudalov, El Ghalbzouri, Sun and Lohse2013) can be as large as 5 mm while the present device penetrates rather shallowly into the gel, approximately
 $450~{\rm\mu}\text{m}$
, see figure 14(b). Arora et al. (Reference Arora, Hakim, Baxter, Rathnasingham, Srinivasan, Fletcher and Mitragotri2007) have hypothesized that pain and bruising may be the consequence of deep penetration of jets that interact with tissue and blood capillaries; in order to reduce pain they limited the penetration depth of their jets to
 ${\sim}$
200–
 $400~{\rm\mu}\text{m}$
of the skin. This is because the density of blood capillaries and nerves is lower in the upper (100–
 $200~{\rm\mu}\text{m}$
) layer of the skin. Arora et al. (Reference Arora, Hakim, Baxter, Rathnasingham, Srinivasan, Fletcher and Mitragotri2007) report that jets of diameter 50–
 $100~{\rm\mu}\text{m}$
,
 $V_{j}>100~\text{m}~\text{s}^{-1}$
gave volume delivered per shot of 2–15 nl and a penetration depth of 200–
 $400~{\rm\mu}\text{m}$
. Notice that these parameters are comparable to the parameters of our jets.
To summarize, we compare in table 2 the parameters from the three previous works with the present study. For the jet velocity we estimate a lower bound for which penetration occurred since the speed of the jet cannot be reliably estimated from figure 14.
Comparison of transdermal drug delivery experiments using pulsed jets with the present study.

Of the studies mentioned above only Fletcher & Palanker (Reference Fletcher and Palanker2001) report that for higher jet velocities the jets were accompanied by hydrodynamic cavitation at the nozzle exit and those jets observed were not suitable for medication delivery.
7. Conclusions
We have studied the dynamics of spark-generated microjets induced by the expansion and collapse of hemispherical cavitation bubbles. It is the spherical convergence which drives the second jet to a speed of several hundred metres per second, while the first jet is driven by the expanding bubble. For
 $We\sim 4600$
both the first and second jets become unstable and transition into sprays. This critical
 $We$
is not sensitive to liquid type or viscosity value tested. A possible mechanism for the spraying transition is cavitation created inside the channel. Approximately 2–5 % of the electric energy is converted into bubble energy from which approximately 0.5–3 % ends up as kinetic energy of the second jet.
Viscosity affects the jetting dynamics through viscous normal stresses at the bubble wall slowing down the bubble dynamics and through viscous drag in the channel reducing the speed within. Still, we find jets at more than
 $100~\text{m}~\text{s}^{-1}$
in 50 cSt silicone oils. Finally, we have shown that despite their small size it is possible for the jets to penetrate approximately
 $450~{\rm\mu}\text{m}$
into an elastic material of similar elastic modulus to that of human skin.
The device delivers a very small volume of liquid each time it is actuated. This amount may not be enough to provide sufficient medication for therapeutic treatment. Nonetheless, it can be modified to achieve this goal; for instance, it can be pulsed multiple times and multiple holes can be added. In addition to that, a better control of the current applied and adequate insulation of the electrodes, to ensure the integrity of the fluid, can turn the device presented here into a potential needle-free drug delivery system. For higher velocities, atomization applications may be an option, too. Besides the applications, the device allows the study of fundamental aspects of very fast transient jets while being simple to build and very cheap. At its heart is the spherical convergent flow from a single hemispherical cavitation bubble which during collapse accelerates flows to speeds of more than
 $400~\text{m}~\text{s}^{-1}$
.