





1. Introduction
The coherent structures present in zero pressure gradient (ZPG) turbulent boundary layers have been studied extensively in the past decades and many statistical and structural properties of the flow are well known, as documented in the extensive review by Wallace (Reference Wallace2012). Coherent structures are an intrinsic feature of turbulent boundary layers, e.g. the streaky near-wall flow structures visualized by Kline et al. (Reference Kline, Reynolds, Schraub and Runstadler1967) that scale with inner/viscous units or large scale motions (LSM) associated with turbulent bulges that reside in the outer region and are on average only  $1\text {--}2\delta$ in length (Kovasznay, Kibens & Blackwelder Reference Kovasznay, Kibens and Blackwelder1970; Balakumar & Adrian Reference Balakumar and Adrian2007). In addition, high- and low-momentum large-scale coherent motions residing in the log-law layer called superstructures have been of particular focus in the last two decades, e.g. Adrian, Meinhart & Tomkins (Reference Adrian, Meinhart and Tomkins2000), Ganapathisubramani et al. (Reference Ganapathisubramani, Hutchins, Hambleton, Longmire and Marusic2005), Hutchins & Marusic (Reference Hutchins and Marusic2007a), Monty et al. (Reference Monty, Hutchins, NG, Marusic and Chong2009), Buchmann et al. (Reference Buchmann, Kücükosman, Ehrenfried and Kähler2016), de Silva et al. (Reference de Silva, Kevin, Baidya, Hutchins and Marusic2018). An interesting property of the superstructures is their extension in the streamwise direction, which is on average several boundary layer thicknesses long. These superstructures, much like near-wall streaks, have been shown to meander strongly in the spanwise direction (Hutchins et al. Reference Hutchins, Monty, Ganapathisubramani, Ng and Marusic2011). In addition, it has been demonstrated that these structures can carry a relatively large portion of the layer's turbulent kinetic energy, and in effect these superstructures are considered as the main contribution to the formation of a plateau/peak in the streamwise velocity fluctuations in the log-law layer which appears at high Reynolds numbers (Fernholz & Finley Reference Fernholz and Finley1996; Monty et al. Reference Monty, Hutchins, NG, Marusic and Chong2009; Samie et al. Reference Samie, Marusic, Hutchins, Fu, Fan, Hultmark and Smits2018). Furthermore, an interaction between superstructures and the near-wall dynamics has been demonstrated (Hutchins & Marusic Reference Hutchins and Marusic2007b; Ganapathisubramani et al. Reference Ganapathisubramani, Hutchins, Monty, Chung and Marusic2012; Bross, Fuchs & Kähler Reference Bross, Fuchs and Kähler2019). Superstructures have also been associated with the low-frequency unsteadiness of the separation bubble downstream of certain shock wave boundary layer interactions (Beresh, Clemens & Dolling Reference Beresh, Clemens and Dolling2002; Ganapathisubramani, Clemens & Dolling Reference Ganapathisubramani, Clemens and Dolling2007; Baidya et al. Reference Baidya, Scharnowski, Bross and Kähler2020), making their impact important for perturbed flows as well. Therefore, the investigation of these superstructures is essential for understanding the overall dynamics of turbulent boundary layers. However, compressibility effects on the coherent structures are by far less studied, mostly due to the many technical challenges these types of flow present.
While compressible wall bounded flows have been intensely studied for many years, the majority of experimental research has focused on the development of scaling models for mean flow properties (Bradshaw Reference Bradshaw1977; Fernholz & Finley Reference Fernholz and Finley1980). However, one of the first direct comparisons of compressible and incompressible turbulent boundary layers that included an analysis of the spatial organization of the flow was done by Smits et al. (Reference Smits, Spina, Alving, Smith, Fernando and Donovan1989) using the correlated signals from a traversed hot-wire for  $Ma = 0.1$ and 2.9. They concluded that the spanwise spacing of correlated streamwise features remains unchanged for the subsonic and supersonic cases, but the streamwise length of the correlated mass-flux fluctuations
 $(\rho u)^{\prime }$ were twice as big for the subsonic case when compared to the supersonic case. Furthermore, a survey done by Smits & Dussauge (Reference Smits and Dussauge2006) of available supersonic measurements, which mostly used hot-wire probes, concluded that for increasing Mach number and Reynolds number, the streamwise length scales decrease significantly while the spanwise length scales remain unaffected by both Reynolds number and Mach number.
The analysis of the flow structure organization with single hot-wires critically relies on the validity of Taylor's frozen turbulence hypothesis (Taylor Reference Taylor1938), which allows a transformation of a turbulent time signal into the spatial domain if an appropriate convection velocity is selected. In contrast, particle image velocimetry (PIV) can be directly used, without any assumptions, to quantitatively study the spatial organization of velocity fields in a given flow. In the work of Ganapathisubramani, Clemens & Dolling (Reference Ganapathisubramani, Clemens and Dolling2006), elongated streamwise coherent structures in a turbulent boundary layer at  $Ma = 2.0$ and
 $Re_{\theta } = 35\,000$ (
 $Re_{\tau } = 5600$) were visualized by using planar PIV in streamwise-spanwise planes (wall-parallel at
 $z/\delta = 0.16$ and 0.45), where an underlying similarity to incompressible structures was observed. However, two-point correlations of streamwise velocity fluctuations revealed that the streamwise length scales for the
 $Ma = 2.0$ turbulent boundary layer were four times larger than incompressible cases reported in the literature, and the spanwise length scale were somewhat larger as well although they were stated to be in good agreement with the subsonic data. The increase in streamwise length scales with Mach number is actually opposite to the conclusion made from the survey of hot-wire measurements in Smits & Dussauge (Reference Smits and Dussauge2006); however they attributed this to a Reynolds number effect or due to the difference between
 $(\rho u)^{\prime }$ and
 $u^{\prime }$ correlations.
Three-dimensional or volumetric PIV methods are also useful for measuring the anisotropic organization of a flow simultaneously in all directions. However, these approaches often have smaller relative spatial resolution and fields of view when compared to two-dimensional PIV (2-D-PIV) measurements. Nevertheless, Elsinga et al. (Reference Elsinga, Adrian, van Oudheusden and Scarano2010) used tomographic-PIV to investigate structures in a turbulent boundary layer at  $Ma = 2.0$ and
 $Re_{\theta } = 34\,000$. Using the volumetric data they measured the three-dimensional topology of elongated structures in the log-layer. They showed that the typical width of low-speed regions varied between
 $0.25\delta$ and
 $0.4\delta$ and spanwise spacing between
 $0.5\delta$ and
 $1\delta$ depending on the wall-normal height.
An important feature of compressible turbulent boundary layers is the variation of thermodynamic flow properties in addition to the velocity across the layer. The effect of compressibility (for Mach numbers below the hypersonic regime) is hypothesized to not influence the turbulent time and length scales (Morkovin Reference Morkovin1962), and the thermodynamic properties such as density can be accounted for by their mean variation across the layer. This hypothesis, born out of a semi-empirical approach, has been used extensively in theliterature to compare supersonic mean velocity and fluctuation results to an extensive catalogue of incompressible boundary layer data (Fernholz & Finley Reference Fernholz and Finley1980; Smits & Dussauge Reference Smits and Dussauge2006). However, in order to study all the effects of velocity, density, temperature and pressure fluctuations on turbulent structure organization, highly resolved direct numerical simulations (DNS) are required to examine all variables. While DNS of turbulent boundary layers have fine spatial resolution, these simulations often come at a cost of relatively small spatial simulation domains, relatively short simulation times and relatively small Reynolds numbers, which in the case of a turbulent boundary layer limits the amount of scale separation between the inner and outer scales. Nevertheless, an analysis of turbulent flow structures in a  $Ma = 2.0$ turbulent boundary layer at
 $Re_{\tau } = 1120$ or
 $Re_{\delta _2} = 3900$ can be found in DNS by Pirozzoli & Bernardini (Reference Pirozzoli and Bernardini2011). Therein, it was shown that the streamwise length scales do not change when compared to the incompressible case, while the spanwise velocity length scales are slightly larger for the computed supersonic flow when compared to experimental incompressible data. Interestingly, these results are in contrast to the aforementioned experimental studies, albeit in different ways.
Large-scale coherent motions were also identified in a Mach 3 turbulent boundary layer DNS up to  $Re_{\theta }< 2600$ by Ringuette, Wu & Martín (Reference Ringuette, Wu and Martín2008). Alternating high- and low-speed structures were visualized in the log-law layer with an average spanwise structure width of
 $0.4\delta$ based on
 $(\rho u)^{\prime }$ correlations. They also looked at the streamwise extent of low-speed structures at a wall-normal location of
 $z/\delta = 0.2$ by transforming the simulated time domain into space with Taylor's frozen turbulence hypothesis and identified low-speed structures up to
 $100\delta$ in length in instantaneous
 $u$-velocity fields. These results were then compared to the incompressible turbulent boundary layer hot-wire measurements of Hutchins & Marusic (Reference Hutchins and Marusic2007a). It was found that the superstructures for both the incompressible and compressible cases were similar, despite the order of magnitude difference in Reynolds number. While the extent of instantaneous structures could not be truly compared because the effective spatial domain of the hot-wire measurements was around
 $20\delta$, Ringuette et al. (Reference Ringuette, Wu and Martín2008) report that the spanwise spacing of the structures for both cases is approximately
 $0.5\delta$.
The structural properties reported in the aforementioned numerical and experimental investigations are not consistent, and a consensus on the reason for the observed differences has not been reached. It is likely however that some of the lack of consensus is due to the fact that past experiments were performed in different facilities having differing boundary and flow conditions (which is also the case for DNS) and measurement techniques, which possibly contributes to the lack of consistency in terms of the characteristics of superstructures. Therefore, the main motivation for the current study is to experimentally investigate the structural topology and statistical properties turbulent superstructures at subsonic, transonic and supersonic Mach numbers in the same test facility by means of state-of-art PIV techniques. The analysis presented herein focuses on the characterization of the streamwise and spanwise length scales of superstructures in the log-law layer over a Mach number range of  $0.3 \leq Ma \leq 3.0$.
2. Experimental systems and methods
2.1. Wind tunnel facility
The Trisonic Wind Tunnel Munich (TWM) is a blow-down type wind tunnel with a  $300\ \textrm {mm} \times 675\ \textrm {mm}$ (
 $w\times h$) test section. A two-throat system consisting of an adjustable Laval nozzle upstream of the test section and an adjustable diffuser downstream of the test section allows for a stable operating Mach number range from 0.3 to 3.0. The stagnation pressure is controlled by a pressure regulation valve and is adjustable between
 $p_0 = 1.2$ bar and
 $5.0$ bar. This allows the Reynolds number to be set independently of the Mach number. The corresponding Reynolds number (
 $Re_x$) range is
 $(4\text {--}78)\times 10^6\ \textrm {m}^{-1}$, which depends on the Mach number. The stagnation pressure
 $p_0$ and temperature
 $T_0$ are recorded by two sensors in the settling chamber. The facility has two storage tanks that can be pressurized up to 20 bar above ambient pressure, with each tank holding a volume of
 $178\ \textrm {m}^3$ of dry air. This amount of air is sufficient for run times in the order of 100 s for the cases discussed below. The wind tunnel's test section is enclosed by a plenum chamber and also has the ability to apply boundary layer suction at both the vertical and the horizontal walls independently. A detailed description of the freestream velocity and pressure fluctuations in the TWM can be found in Scharnowski, Bross & Kähler (Reference Scharnowski, Bross and Kähler2019).
A flat plate boundary layer model was mounted in the test section of the TWM for this investigation. A sketch of the model and coordinate system is shown in figure 1. The overall length of the model in the streamwise direction is 1.70 m, resulting in a turbulent boundary layer thickness of 13–27 mm at a location 1.26 m downstream of the leading edge. A cavity was milled out on the bottom side of the plate where a resistance based temperature sensor was installed in order to estimate the wall temperature  $T_{w}$. The fluid properties in the freestream are calculated using the isentropic expansion equations and are denoted with the subscript
 $e$, e.g. the edge temperature
 $T_e$. Since the temperature of the wall is known and the static pressure at the edge is the same at the wall (
 $p_e=p_{w}$),
 $\rho _{w}$ can be calculated from the ideal gas law. The viscosity at the wall and the edge is estimated from the Sutherland Model, which is shown in (2.1) (Sutherland Reference Sutherland1883).
 \begin{equation} \frac{\mu_{w}}{\mu_{{ref}}}=\frac{T_{{ref}}+S}{T_{w}+S}\left(\frac{T_{w}}{T_{{ref}}}\right)^{3/2} \end{equation}
Flat plate boundary layer model used in the Trisonic Wind Tunnel Munich (TWM). Planar PIV measurement planes’ locations and orientations are indicated and labelled. The coordinates  $(x,y,z)$ correspond to streamwise, spanwise and wall-normal directions respectively.

This model is applicable for dry air for a temperature range between 100 K and 1900 K where  $S = 110.3\ \textrm {K}$ (Ames Research Staff 1953). A reference temperature
 $T_{{ref}} = 273\ \textrm {K}$ and viscosity
 $\mu _{{ref}} = 1.716 \times 10^{-5}\ (\textrm {kg}\,\textrm {ms}^{-1})$ was used. The fluid properties in the settling chamber and the test section are outlined in table 1 for the range of Mach numbers and Reynolds numbers considered in this investigation.
Fluid properties at the edge ( $e$) and surface of the flat plate or wall (w).

2.2. Turbulent boundary layer transition
Transitional devices affixed near the leading edge of aerodynamic surfaces are commonly used to ensure laminar/turbulent transition or to fix the transition location. These types of devices are often used to thicken the boundary layer, which is often desirable for measurements in high speed flows when the boundary layer thickness is very thin. However, these devices can produce unwanted flow features such as longitudinal vortices or a blockage that can influence coherent flow structures in turbulent incompressible boundary layers and condition the results of a measurement if an inadequate transition or perturbation is selected (Elsinga & Westerweel Reference Elsinga and Westerweel2012; Hutchins Reference Hutchins2012; Marusic et al. Reference Marusic, Chauhan, Kulandaivelu and Hutchins2015; Sanmiguel Vila et al. Reference Sanmiguel Vila, Vinuesa, Discetti, Ianiro, Schlatter and Örlü2017). Furthermore, it was shown (Bross, Scharnowski & Kähler Reference Bross, Scharnowski and Kähler2018) that even very conservative tripping devices with a height one half the laminar boundary layer thickness can produce a long wake that persists along the surface of the plate for a supersonic turbulent boundary layer, and it must be expected that they influence the near-wall flow features. Therefore, to avoid non-canonical flow perturbations, tripping devices were not applied to the leading edge of the flat plate boundary layer model used in this investigation.
To estimate the location of the natural (un-tripped) transition location for the subsonic and supersonic cases, oil film techniques were applied. A film of an oil mixture, consisting of petroleum oil, linseed oil, oleic acid and  $\textrm {TiO}_2$ particles, was applied to the plate in a homogeneous manner by using a industrial paint sprayer device before each wind tunnel run. The aluminium plate surface was anodized black, which allowed for better contrast with the white
 $\textrm {TiO}_2$ particles. The oil film streaks then were captured with two side-by-side sCMOS cameras, creating a field of view spanning the entire test section width. The plate was illuminated with a white LED diffuse light source to create sufficient contrast and homogeneous illumination.
In addition, the flat plate model was designed with a sharp leading edge so that for the supersonic cases the strength of the shock is minimized by forcing an attached shock at the leading edge. For the subsonic case shown in figure 2(a) the sharp leading edge produces a small laminar separation which re-attaches approximately 6–7 mm downstream of the leading edge. An elliptically shaped leading edge can be used to avoid flow separation and reduce or eliminate unsteady loading on the plate or move the turbulence transition location downstream. However, for the investigation of a turbulent boundary layer developing over a long flat plate, the separation bubble at the leading edge for subsonic conditions can be considered as a type of transition element where the transition occurs in the shear layer at or near the bubble interface (Hain, Kähler & Radespiel Reference Hain, Kähler and Radespiel2009). Therefore, it can be expected that when the flow reattaches, a fully turbulent flow exists that includes a broad spectrum of turbulent scales and does not contain artificially generated coherent flow motions as typically found in the wake of transition devices. For the supersonic case shown in figure 2(b), the natural – i.e. unforced – transition location can be estimated by observing the transition wedge pattern near the leading edge. Transition wedges can only be observed where the flow is still laminar. Therefore, the transition location appears to be between 10 and 30 mm downstream of the leading edge for the subsonic and supersonic cases, respectively, which is very far upstream of the measurement location ( $50\text {--}90\delta _{99}$ depending on the Mach number) so that enough boundary layer thickness turn-overs exist for the flow to develop.
Oil film visualization (a)  $Ma = 0.3$ and
 $p_0 = 1.5$ and (b)
 $Ma = 2.0$ and
 $p_0 = 2.2$ in the leading edge region of the flat plate boundary layer model. The leading edge and spanwise boundaries of the plate are outlined with a white dashed line where
 $(x,y) = (0\ \textrm {mm},0\ \textrm {mm})$ is located at the leading edge and spanwise mid-point of the flat plate. Insert in (a) shows an enlarged more detailed view of the leading edge region for the subsonic case.

2.3. Side wall and corner effects
In order to characterize the effect of the side-wall boundary layer development and corner vortices, stereo-PIV (SPIV) measurements were performed in the cross-stream plane ( $yz$-plane) approximately 1.3 m downstream of the leading edge of the flat plate shown in figure 1. The spanwise location of the measurement plane was adjusted such that both the side-wall of the wind tunnel and the flow extending approximately 100 mm towards the centre of the tunnel were visible. The results of this measurement for a supersonic and supersonic case are shown in figures 3(a) and 3(b).
Instantaneous streamwise velocity  $u$ field normalized with
 $U_{\infty }$ in a spanwise (
 $y$) wall-normal (
 $z$) SPIV plane for (a)
 $Ma = 0.3$ and
 $p_0 = 1.5$ and (b) for
 $Ma = 2.0$ and
 $p_0 = 2.2$. (- -) contour lines correspond to lines of constant mean streamwise velocity
 $U$ for
 $U = 0.65$, 0.75, 0.95 and
 $0.99U_{\infty }$. In this plane, positive
 $u$ velocity is directed out of the page and
 $(y, z) = (0\ \textrm {mm}, 0\ \textrm {mm})$ correspond to the wind tunnel side wall and plate surface locations, respectively.

The presence of corner vortices and turbulent structures in the near side-wall and corner regions is evident from the instantaneous velocity fields for both subsonic and supersonic cases shown in figures 3(a) and 3(b). However, the influence of coherent flow motions seems to be limited to less than 60 mm from the side-wall. This is confirmed by the fact that contours of constant mean streamwise velocity corresponding to  $U = 0.65$, 0.75 and
 $0.99U_{\infty }$ appear to converge for all wall-normal heights at spanwise distances greater than 60 mm. As the middle of the flat plate is located at 150 mm from the side wall, it can be concluded that the influences of the side-wall and corner flow are negligible in the centre of the test-section.
2.4. Quantitative flow field measurements via PIV
In order to quantitatively characterize the structural topology and spatial velocity statistical properties of the flow, velocity fields using PIV were obtained in three perpendicular planes as shown in figure 1. Planar 2-D-PIV was used in a streamwise wall-normal plane ( $xz$-plane) and wall-parallel planes (
 $xy$-plane). In addition, SPIV measurements, different to the SPIV measurement setup shown in § 2.3 and centred at the midspan of the plate, were performed in the cross-stream direction (
 $yz$-plane); this provided all three velocity components (
 $u,v,w$).
The flow was seeded with Di-Ethyl-Hexyl-Sebacat (DEHS) tracer particles with a mean diameter of around  $1 \ \mathrm {\mu }\textrm {m}$, as described by Kähler, Sammler & Kompenhans (Reference Kähler, Sammler and Kompenhans2002). The response time of these droplets is approximately
 $2\ \mathrm {\mu }\textrm {s}$ (Ragni et al. Reference Ragni, Schrijer, van Oudheusden and Scarano2011). A beam emanating from a Quantel Evergreen 200 Nd:YAG double pulsed laser was formed into a
 $500\ \mathrm {\mu }\textrm {m}$ thick light sheet in order to illuminate the tracer particles in the aforementioned measurement planes.
The PIV measurements analysed herein were obtained using classical double frame imaging, see Raffel et al. (Reference Raffel, Willert, Scarano, Kähler, Wereley and Kompenhans2018) for a detailed description of this measurement technique. Pairs of images are recorded separated by a short time delay  $\Delta t$, and then sets of these double frame recordings are acquired in a sequence at a frequency of 15 Hz using specially suited sCMOS cameras. Approximately 1000 double frame recordings were acquired for each measurement case and nine different
 $\Delta t$ between
 $0.2\ \mathrm {\mu }\textrm {s}$ and
 $4\ \mathrm {\mu }\textrm {s}$ were used. The selection of the proper
 $\Delta t$ depended on both the optical magnification and the flow speed. In this case, the selected
 $\Delta t$ corresponded to a mean particle image shift between
 $\Delta x\approx 2$ pixels and 10 pixels close the wall and in the freestream, respectively. For all of the measurements, Makro-Planar Zeiss camera objectives were used to ensure excellent imaging quality. The PIV recordings were evaluated using state-of-the-art PIV software including multi-pass image deformation and Gaussian window weighting. The final interrogation window size was varied between
 $16\times 16$ pixels and
 $24\times 24$ pixels depending on the measurement plane, see table 2. The selection of the window size essentially fixes the spatial resolution of the measurement – i.e. the smallest possible length scale or structure that can be resolved corresponds to the size of the window as length scales smaller than the window size will be spatially low-pass filtered. However, since large-scale structures are the focus of this investigation, the spatial resolution of the presented measurements is sufficient; more details can be found in § 4. A
 $50\,\%$ window overlap was used, which made the final vector spacing half of the window size used for the particle image correlation.
Imaging parameters for particle image velocimetry (PIV) measurements.

For each of the planes measured, a different camera and light sheet orientation was used. The streamwise wall-normal plane ( $xz$-direction) was imaged by two sCMOS cameras which were mounted side by side in the
 $x$-direction such that they had overlapping fields of view (FOV) that observed the laser sheet perpendicularly. The recorded camera images were then stitched together resulting in a final field of view of
 $500\ \textrm {mm} \times 50\ \textrm {mm}$ (in
 $x$ and
 $z$, respectively) and scaling factor of
 $37.0\ \mathrm {\mu }\textrm {m}\,\textrm {pixels}^{-1}$. For this plane, the magnification, calculated by dividing the pixel pitch of the camera (
 $6.5\ \mathrm {\mu }\textrm {m}\,\textrm {px}^{-1}$) by the scaling factor, was
 $M = 0.18$. The wall-parallel plane (
 $xy$-direction) was imaged using one sCMOS camera that was mounted on top of the wind tunnel to view a wall-parallel aligned light sheet perpendicularly. In order to observe a relatively large FOV in the streamwise and spanwise directions, a short focal length camera objective was used, which resulted in a FOV of
 $180\ \textrm {mm}\times 140\ \textrm {mm}$ (in
 $x$ and
 $y$, respectively) with a scaling factor of
 $67.5\ \mathrm {\mu }\textrm {m}\,\textrm {pixels}^{-1}$ and magnification of
 $M = 0.10$. Finally, a higher resolution measurement was done in the cross-stream plane (
 $yz$-direction) where SPIV was used to measure all three perpendicular velocity components. The SPIV setup consisted of two sCMOS cameras mounted on the same side of the wind tunnel but aligned on either side of the cross-stream oriented light sheet. In this case the resulting FOV was
 $70\ \textrm {mm}\times 45\ \textrm {mm}$ (in
 $y$ and
 $z$, respectively) with a scaling factor of
 $26.1\ \mathrm {\mu }\textrm {m}\,\textrm {pixels}^{-1}$ and a magnification of
 $M = 0.42$. For the SPIV plane, all the Mach and Reynolds numbers listed in table 1 were measured, while for the wall-parallel plane, only
 $Ma = 0.3$
 $p_0 = 1.5$,
 $Ma = 0.8$
 $p_0 = 1.5$,
 $Ma = 2.0$
 $p_0 = 2.2$ and
 $Ma = 3.0$
 $p_0 = 4.5$, and were considered. Finally, for the streamwise wall-normal plane, only
 $Ma = 0.3$
 $p_0 = 1.5$ and
 $Ma = 2.0$
 $p_0 = 2.2$ were considered.
3. Mean flow field
In order to compare compressible and incompressible flows, the velocity fields measured with PIV must be corrected/scaled so that the mean variation of temperature and density across the boundary layer are taken into account. Therefore, it is essential for the structural analysis that the mean velocity field is properly scaled. In this section, the methods for scaling compressible flows so that they can be compared to incompressible results are outlined. The governing scaling equations for the mean flow in turbulent incompressible turbulent boundary layers often involve a classification of different regions of the layer, such as a linear near-wall region, a logarithmic layer or the wake region, e.g. Coles (Reference Coles1956). However, classical incompressible velocity scaling is not applicable for compressible cases where the thermodynamic properties of the flow change across the layer because the mean streamwise velocity scaled with inner units ( $\bar {u}^+ = \bar {u}/u_{\tau }$) diverges from the log-law with increasing Mach number. In order to more adequately compare compressible and incompressible experimental or numerical results, an extension of the scaling laws to the compressible regime can be made using the Van Driest effective velocity given by the following differential equation:
 $\textrm {d}u_{vd} = (\bar {\rho }/\rho _{w})^{1/2}\,\textrm {d}\bar {u}$ (Van Driest Reference Van Driest1951). Using a semi-empirical approach, the Van Driest velocity can be written in the form shown in (3.1).
 \begin{equation} u_{vd}=\frac{u_e}{B}\sin^{-1}{\left(\frac{2B^2(\bar{u}/u_e)-A}{\sqrt{A^2+4B^2}}\right)}, \end{equation}
where the constants  $A$ and
 $B$ are as follows:
 \begin{equation} A=\left(1+r\frac{\gamma-1}{2}{{Ma}}^2_e\right)\frac{T_e}{T_{w}}-1 ,\quad B^2=r\frac{\gamma-1}{2}{{Ma}}^2_e\frac{T_e}{T_{w}}, \end{equation}
 $r\approx 0.9$ (recovery factor typical for turbulent boundary layers) and the specific heat ratio is
 $\gamma = 1.4$ for air in the temperature and pressure ranges occurring for the flow cases considered herein. Using inner scaling, the compressible version of the log-law layer can be expressed in a similar way as the incompressible log-law layer as shown in (3.3) (Bradshaw Reference Bradshaw1977; Fernholz & Finley Reference Fernholz and Finley1980; Smits & Dussauge Reference Smits and Dussauge2006).
 \begin{equation} u_{vd}^+=\frac{u_{vd}}{u_{\tau}}=\frac{1}{\kappa}\log\left(\frac{u_{\tau} z}{\nu_{w}}\right)+C^*+\frac{2\varPi}{\kappa}\sin^2\left(\frac{\rm \pi}{2}\frac{z}{\delta_c} \right). \end{equation}
The mean streamwise velocity profile shown in figure 4(a) was computed by transforming  $\bar {u}$ with (3.1) for the range of Mach and Reynolds numbers investigated. For these profiles the mean velocity data was taken from the centre-line of the
 $yz$-plane in the SPIV measurement. The wall position was determined by visual inspection of the wall location from the PIV images, and then the profiles were systematically shifted in sub-pixel increments in order to obtain a good least-squares fit to (3.3). The mean flow parameters calculated from this fitting procedure are provided in table 3. The resulting Van Driest transformed mean streamwise velocity profiles in figure 4(a) demonstrate a nice collapse in the log-law layer for all the Mach numbers investigated.
(a) Van Driest transformed,  $u_{vd}^+$, mean profiles vs. inner scaled wall-normal distance
 $z^+$ for
 $0.3 \leq Ma \leq 3.0$ evaluated from the cross-stream SPIV measurement. Also shown is the
 $u^+ = z^+$ indicated by the solid line and the dashed line represents
 $u^+ = \textrm {log}(z^+)/0.41 + 5.6$. (b) Skin friction
 $C_{f_i}=F_c C_f$ estimate transformed with Van Driest II vs. transformed momentum thickness Reynolds number
 $Re_{\delta _2}$.

Mean boundary layer parameters. Friction based Reynolds number  $Re_{\tau }$ is evaluated at the wall. The skin friction coefficient
 $C_f=(2 u_{\tau }^2\rho _{w})/(\rho _e u_{e}^2)$ is transformed to
 $C_{f_i}=F_c C_f$, where
 $F_c$ is given in (3.4).

The friction velocity determined from aforementioned fitting procedure can be used to estimate the skin friction coefficient using the relation  $C_f=(2 u_{\tau }^2\rho _{w})/(\rho _e u_{e}^2)$. However, in order to compare the skin friction coefficient for sub- and supersonic flows, a transformation of the form
 $C_{f_i}=F_c C_f$ is necessary. A variety of transformation functions (
 $F_c$) exist, but the so-called Van Driest II (Van Driest Reference Van Driest1956) version, which has been shown to fit well to experimental data over a large range of Reynolds numbers (Hopkins & Inouye Reference Hopkins and Inouye1971; Bradshaw Reference Bradshaw1977), is widely used. Therefore, we implement the Van Driest II formulation found in Hopkins & Inouye (Reference Hopkins and Inouye1971),
 $C_{f_i}=F_c C_f$ where,
 \begin{equation} F_c=\frac{\varPsi}{\left(\arcsin{\alpha}+\arcsin{\beta}\right)^2}, \end{equation}
where  $\varPsi =(({\gamma -1})/{2})rM_{e}^2=0.2rM_{e}^2$ and,
 \begin{equation} \left. \begin{gathered} \alpha=\frac{\left(2A^2-B\right)}{\left(4A^2+B^2\right)^{1/2}}\quad \mathrm{and}\quad \beta=\frac{B}{\left(4A^2+B^2\right)^{1/2}},\\ A=\left(\frac{\varPsi}{T_{w}/T_e}\right)^{1/2}\quad \mathrm{and}\quad B=\frac{\left(1+\varPsi-T_{w}/T_e\right)}{T_{w}/T_e}. \end{gathered} \right\} \end{equation}
The Van Driest II transformed skin friction coefficients  $C_{f_i}$ for all the measured cases are plotted as a function of transformed momentum thickness Reynolds number
 $Re_{\delta _2}$ (see (3.8c)) in figure 4(b). The solid and dashed lines plotted in figure 4(b) are two widely used semi-empirical skin friction coefficient correlations, namely the Kármán–Schoenherr (Schoenherr Reference Schoenherr1932; von Kármán Reference von Kármán1934; Hopkins & Inouye Reference Hopkins and Inouye1971) and a power-law based fit
 $C_{f_i}= 0.024Re_{\delta _2}^{-1/4}$ from Smits, Matheson & Joubert (Reference Smits, Matheson and Joubert1983). In general, the transformed
 $C_{f_i}$ follows the semi-theoretical skin friction correlations; however for increasing Reynolds number, the
 $C_{f_i}$ values lie closer to the Kármán–Schoenherr correlation, which is in agreement with the findings of Hopkins & Inouye (Reference Hopkins and Inouye1971) for high Reynolds number data. The
 $0.024Re_{\delta _2}^{-1/4}$ fit is perhaps more suitable for low-Reynolds number data as it was deduced from data at
 $Re_{\theta } < 3000$ in Smits et al. (Reference Smits, Matheson and Joubert1983). It must be stated that the
 $C_{f_i}$ values reported here are the result of an indirect method that fits the log-law layer to determine
 $u_{\tau }$ values for each case. However, despite the many assumptions and possible fitting errors contained in this indirect method, the results shown in figure 4(b) provide some validation that the
 $C_{f_i}$ estimation is in reasonable agreement with well established semi-empirical relations, and therefore determining the skin friction with this indirect method is at least sufficient for scaling purposes.
In addition to the mean flow, the scaling of fluctuations in compressible turbulence must be also carefully considered. In compressible turbulent flows,velocity, temperature and pressure/density all fluctuate, which can be characterized as vorticity, entropy and acoustic variations, respectively (Kovasznay Reference Kovasznay1953). As long as the Mach number is not too large, i.e. the local effects of compressibility are small, the acoustic/pressure and entropy/temperature fluctuations can be considered negligible. Using this idea, Morkovin hypothesized that for sub-hypersonic Mach numbers the compressibility effects on the adiabatic turbulent boundary layer dynamics are small, and therefore the boundary layer structure should be the similar to the incompressible case (Morkovin Reference Morkovin1962). Furthermore, Morkovin's hypothesis infers that the turbulent length and time scales are not influenced by compressibility and the shear and normal stress distributions can be scaled with  $\bar {\rho }/(\rho _{w}u_{\tau }^2)$, which is otherwise known as Morkovin scaling (Bradshaw Reference Bradshaw1977; Smits & Dussauge Reference Smits and Dussauge2006).
The Morkovin scaled Reynolds stress profiles for the range of Mach and Reynolds numbers are provided in figure 5(a). In general, there is a good collapse of the profiles across all Mach numbers and Reynolds numbers, which supports Morkovin's hypothesis. For the region  $z/{\delta _{99}}>0.5$ all stress components are slightly elevated for the supersonic cases when compared to the subsonic Mach numbers. However, for the majority of the log-law region the Morkovin scaled profiles are in relatively good agreement, indicating that the mean values of streamwise turbulent fluctuations in the regions where superstructures reside are comparable for all the measurement test cases.
(a) Morkovin scaled Reynolds stress profiles vs. outer scaled wall-normal distance ( $z/\delta _{99}$) for
 $0.3 \leq Ma \leq 3.0$ computed from the cross-stream SPIV measurement. (b) Mean flow density
 $\bar {\rho }$ normalized with fluid density at the wall
 $\rho _{w}$. The mean flow density
 $\bar {\rho }$ in
 $z$-direction is calculated from the Walz transformation of the mean streamwise velocity profile
 $\bar {u}$.

However, when compared to a variety of profiles available in the aforementioned literature review, the magnitude of the wall-normal stress component in figure 5(a) is lower than previously reported. In these studies, the Morkovin scaled turbulent fluctuation r.m.s. or intensity approaches 1 in the log-law layer while the wall-normal Morkovin scaled r.m.s. fluctuations trend towards  $(\sqrt {\bar {\rho }/\rho _{w}}/u_{\tau })\sqrt {\langle w^{\prime ^2}\rangle }\approx 0.8$ for the current data set. The attenuation of the mean fluctuations could be associated with the spatial filter of the SPIV measurement technique used for this study. This method is perhaps not the most suitable for obtaining higher order statistics or resolving small fluctuations due to the technique's higher sensitivity to vibrations and optical aberrations (Sciacchitano Reference Sciacchitano2019). However, the bias in the fluctuation intensity magnitude seems to be rather consistent across the measured cases, and since the post-processing methods for all cases were identical, the profiles presented in figure 5(a) can be considered as a fair comparison across all the cases. Furthermore, the purpose of the measurements was to characterize the average spatial distribution of
 $\delta$ scaled structures and it is not expected that any bias in the turbulent intensity fluctuation magnitude influences the spatial structure patterns in the following sections. This is further supported by the good agreement between the spanwise structure spacing calculated in §§ 4.2 and 4.3 from SPIV and standard planar-PIV measurements.
The Reynolds stress results presented herein support the validity of Morkovin scaling for the comparison of supersonic and subsonic data, particularly in the log-law layer. However, this scaling is only generally valid for  $Ma < 5$ or when the fluctuating Mach number is below 0.3 (Smits & Dussauge Reference Smits and Dussauge2006). This scaling does not necessary hold for all regions in the boundary layer, as pointed out in a recent DNS study of a Mach 2 turbulent boundary layer (Wenzel et al. Reference Wenzel, Selent, Kloker and Rist2018) where the validity of the Van Driest and Morkovin scaling was systematically investigated. They demonstrated that both the Van Driest and Morkovin scaled profiles are slightly influenced by Mach number in the near-wall and wake regions.
In order to use the Morkovin scaling in the analysis in § 4, the mean density profile across the boundary layer must be known. To obtain the density profile the Walz transformation (Walz Reference Walz1966) shown in (3.6) was used to calculate the temperature profile based on the mean streamwise velocity profile.
 \begin{equation} \frac{T}{T_e}=\frac{T_{w}}{T_e}+\frac{T_r-T_{w}}{T_e}\left(\frac{\bar{u}}{u_e}\right)-r\frac{\left(\gamma - 1\right)}{2}{{Ma}}^2_e\left(\frac{\bar{u}}{u_e}\right)^2. \end{equation}
The recovery temperature  $T_r$ (an adiabatic wall would mean
 $T_r = T_{w}$) is defined as
 \begin{equation} T_r=T_e\left(1+r\frac{\left(\gamma - 1\right)}{2}{{Ma}}^2_e\right). \end{equation}
The mean temperature profile was then used to calculate the mean density profile using the ideal gas law. The mean density profile normalized with the wall density for different Mach numbers is shown in the figure 5(b). For  $Ma = 0.3$ there seems to be no change in the density across the boundary layer;however for
 $Ma = 0.8$ a small variation in the mean density profile across the layer is already visible and for
 $Ma = 2.0$ and 3.0 the variation is much stronger.
For incompressible turbulent boundary layers, the friction based Reynolds number  $Re_{\tau }$ can be viewed as the ratio of large scales (
 $\delta$) to the small viscous or inner scales. However, for compressible turbulent boundary layers
 $Re_{\tau }$ is localized and depends on the wall-normal location. Notably,
 $Re_{\tau }$ at the wall becomes small for
 $Ma = 2.0$ and 3.0 despite having large
 $u_{\tau }$ due to the increasing kinematic viscosity at the wall. Therefore, the
 $Re_{\tau }$ reported in table 3 was only evaluated at the wall. A more suitable Reynolds number often used for compressible turbulent boundary layers is based on the momentum thickness is
 $Re_{\delta _2} = \rho _e u_e \theta ^*/\mu _{w}$ where momentum thickness
 $\theta ^*$ is shown in (3.8a–c) and (3.9a,b). The displacement thickness
 $\delta ^*$ is also given in (3.9a,b). The incompressible friction based Reynolds numbers
 $Re_{\tau }$ and
 $Re_{\theta }$, and the compressible
 $Re_{\delta _2}$ shown in (3.8a–c) are summarized in table 3 for all Mach numbers. As expected for the subsonic Mach numbers particularly for
 $Ma = 0.3$ and 0.5 there is not much difference between
 $Re_{\theta }$ and
 $Re_{\delta _2}$. However, starting with
 $Ma = 0.8$ the difference between these values is visible and becomes more dramatic with increasing Mach number.
 \begin{gather} Re_{\tau} = u_{\tau} \delta_{99}/\nu_{w};\quad Re_{\theta} = u_{\infty} \theta^*/\nu_e;\quad Re_{\delta_2} = \rho_e u_{\infty} \theta^*/\mu_{w}, \end{gather}
 \begin{gather} \theta^* = \int_{0}^{\delta_{99}} \frac{\bar{\rho}}{\rho_e}\frac{\bar{u}}{u_{\infty}}\left(1-\frac{\bar{u}}{u_{\infty}}\right)\,\textrm{d}z;\quad \delta^* = \int_{0}^{\delta_{99}} \left(1-\frac{\bar{\rho}}{\rho_e}\frac{\bar{u}}{u_{\infty}}\right)\,\textrm{d}z. \end{gather}
The analysis in this section provides the framework for the scaling of compressible (sub-hypersonic) turbulent boundary layers measured herein using the classical approaches found in the literature. The proper scaling of the velocity fields measured with PIV is essential so that the sub- and supersonic cases can be compared with each other in the statistical analysis of structures in the following section.
4. Structural analysis
In the following section the structural properties of the turbulent boundary layers are analysed using multi-point correlations and spatial spectral methods in each of the three perpendicular measurement planes with the aim of characterizing the large-scale superstructures in the streamwise, spanwise and wall-normal directions over the range of Mach numbers investigated herein.
4.1. Streamwise-wall normal structures
The organization of the turbulent boundary layer in the streamwise-wall-normal ( $xz$) plane is considered first in this section as this is a commonly presented and discussed plane found in turbulent boundary layer literature. Figures 6(a) and 6(b) shows exemplary instantaneous velocity fields at
 $Ma = 0.3$,
 $p_0 = 1.5$ and
 $Ma = 2.0$,
 $p_0 = 2.2$ to illustrate typical structural features of the flow such as uniform momentum zones (UMZs). The streamwise extent of the measurement plane was produced by stitching two cameras aligned side by side with a small overlap in the streamwise field of view. The PIV images from each camera are evaluated separately and then the resulting velocity fields are stitched together in the overlap region.
Instantaneous velocity field  $u/U_f$ in the
 $xz$-plane where
 $U_f = 0.99U_{\infty }$ at (a)
 $Ma = 0.3$,
 $p_0 = 1.5$ and (b)
 $Ma = 2.0$,
 $p_0 = 2.2$. Wall-normal,
 $z$, and streamwise,
 $x$, directions are scaled with
 $\delta _{99}$ which is 24.5 and 14 mm for
 $Ma = 0.3$,
 $p_0 = 1.5$ and
 $Ma = 2.0$,
 $p_0 = 2.2$ respectively. Solid black lines represent the turbulent–non-turbulent interface (TNTI) and solid grey contours lines of constant
 $u/U_f$ represent the borders or edges the uniform momentum zones (UMZs) determined from the relative probability function (p.d.f.) of the instantaneous velocity field
 $u/U_f$ for
 $Ma = 0.3$ and
 $Ma= 2.0$ in (c,d) respectively. The borders or edges of the UMZs, indicated with red-dashed lines, are located at the minima between the peaks present in the p.d.f. of
 $u/U_f$. Only the turbulent flow region, designated by the TNTI, was considered in the p.d.f. calculation.

A simple way of detecting features in the turbulent boundary layer is to look for regions of uniform momentum or so-called uniform momentum zones (UMZs). Detailed investigations about the presence of these regions or zones inside incompressible turbulent boundary layers can be found in Meinhart & Adrian (Reference Meinhart and Adrian1995) and Adrian et al. (Reference Adrian, Meinhart and Tomkins2000). More recently, de Silva, Hutchins & Marusic (Reference de Silva, Hutchins and Marusic2016) identified the presence of three to five UMZs using planar double-frame PIV measurements over a few orders of magnitude variation of high Reynolds numbers. These UMZs have also been described in the context of coherent structures as shown in Laskari et al. (Reference Laskari, de Kat, Hearst and Ganapathisubramani2018) where the temporal coherence of UMZs using time-resolved PIV of an incompressible ZPG turbulent boundary layer was explored. Within that study, the number of UMZs was related to the presence of a low- or high-momentum large-scale structure moving through the measurement plane. Therefore, the detection of UMZs can be used to interpret the instantaneous structure organization within a turbulent boundary layer.
As most of the previous studies have only considered incompressible flows, a brief demonstration of this detection technique applied to both the subsonic and supersonic measurements is provided. In figures 6(a) and 6(b) instantaneous colour contours of the velocity field  $u/U_f$ in the
 $xz$-plane are plotted for the
 $Ma = 0.3$,
 $p_0 = 1.5$ and
 $Ma = 2.0$,
 $p_0 = 2.2$ cases. Overlaid on the colour contours are solid grey contour lines of constant
 $u/U_f$ that represent the edges or borders of the UMZs for these specific instantaneous velocity fields. In addition, the black solid line overlaid on these velocity fields represents the instantaneous turbulent–non-turbulent interface (TNTI), which was detected using the homogeneity criterion developed by Reuther & Kähler (Reference Reuther and Kähler2018).
The borders or edges of the UMZs are determined from the location of minima between the peaks in the relative probability function (p.d.f.) of  $u/U_f$ shown in figures 6(c) and 6(d). The minima locations are indicated by the vertical red dashed lines and correspond to the values of constant
 $u/U_f$ used to draw the solid grey contour lines in figures 6(a) and 6(b). It should be noted that in order to avoid a large peak in the p.d.f. of
 $u/U_f$ near the boundary layer edge, an exclusion of any non-turbulent parts of the flow designated by the TNTI must be carried out before calculating the p.d.f. for each instantaneous flow field. Therefore, it follows that the TNTI forms the outermost edge or border of the UMZs in the turbulent boundary layer.
In the exemplary instantaneous fields shown in figures 6(a) and 6(b), four UMZs were detected for both the subsonic and supersonic cases. While an in-depth statistical analysis of the average number of UMZs was not performed, a survey of the instantaneous velocity fields showed a typical number of UMZs between two and four for both the sub- and supersonic cases, which is consistent with the number reported in the literature for incompressible turbulent boundary layers. In fact a recent study at hypersonic flow conditions detected two to three UMZs in the log-law layer and wake region at  $Ma = 7.5$ (Williams et al. Reference Williams, Sahoo, Baumgartner and Smits2018). Therefore, it can be concluded that the organization of large-scale structures associated with UMZs in the outer flow region remains relatively unchanged for increasing Mach number.
It should be noted that the careful detection of the UMZ edges can depend on the spatial resolution (de Silva et al. Reference de Silva, Philip, Hutchins and Marusic2017) of the measurement, particularly in the wall normal direction. Due to the resolution limitations in all the aforementioned literature, including the results analysed herein, the region below  $z/\delta < 0.1$ was not well resolved. However, it follows from the known coherent structures in the near-wall region, such as meandering streaks, and their dynamics that UMZs must also exist close to the wall. The presence of near-wall UMZs associated with the viscous sublayer and near-wall streaks was demonstrated in Bross et al. (Reference Bross, Fuchs and Kähler2019) in high spatial and temporal resolved near-wall particle tracking measurements of an incompressible turbulent boundary layer. Therefore, the detection of more UMZs in the compressible data discussed herein would be expected if the spatial resolution in the wall-normal direction was higher. However, as the focus of the present study is on the characteristics of large-scale structures in the outer flow region, the spatial resolution of the present measurements is sufficient.
To determine the mean streamwise elongation of the large-scale coherent flow motions from the correlation of streamwise velocity fluctuations,  $u^{\prime }$, a two point spatial correlation analysis was performed. Plotted in figures 7(a) and 7(b) are contours of the correlation coefficient
 $R_{uu}$ at a wall-normal origin location
 $z_0/\delta _{99} = 0.2$, where
 $\xi _x = x_o + \Delta x$ with
 $x_0$ corresponding to the centre of the FOV in the streamwise direction. Overlaid on the colour contours is a straight line through the centre of the correlations with an inclination angle of
 $14^{\circ }$. For both the sub- and supersonic cases, the correlation at
 $z_0/\delta _{99} = 0.2$ appears to have a typical inclination angle of approximately
 $14^{\circ }$. This is consistent with the inclination angle of the large-scale motions which is widely reported for incompressible ZPG flows, between
 $12^{\circ }$ and
 $16^{\circ }$ (Adrian et al. Reference Adrian, Meinhart and Tomkins2000; Marusic & Heuer Reference Marusic and Heuer2007; Baars, Hutchins & Marusic Reference Baars, Hutchins and Marusic2017).
Two-point correlation coefficient  $R_{uu}$, calculated at the wall-normal origin location
 $z_0/\delta _{99} = 0.2$ for (a)
 $Ma = 0.3$,
 $p_0 = 1.5$ and (b)
 $Ma = 2.0$,
 $p_0 = 2.2$. Horizontal axis is
 $\xi _x = x_0 + \Delta x$ where
 $x_0$ is the centre of the field of view. Solid black contour lines range from 0.2 to 1 in 0.1 increments. White dashed line is plotted with
 $14^{\circ }$ inclination angle.

Investigations in compressible flows vary in their results. Rayleigh scattering visualization of density fluctuations from Smith & Smits (Reference Smith and Smits1995) estimate between  $30^{\circ }$ and
 $60^{\circ }$ inclination angle at
 $Ma = 2.5$. Similarly, multi-probe cross-correlation of hot-wire signals in a
 $Ma = 3.0$ turbulent boundary layer report inclinations angles of
 $(u \rho )^{\prime }$ based structures in the same range as Smith & Smits (Reference Smith and Smits1995). In contrast, correlations of
 $u^{\prime }$ from PIV measurements of at
 $Ma = 0.8$ turbulent boundary layers report inclination angles of
 $12^{\circ }$ and
 $13^{\circ }$ (Buchmann et al. Reference Buchmann, Cierpka, Knopp, Schanz, Schröder, Hain and Kähler2014) and DNS at
 $Ma = 3.0$ of
 $17^{\circ }$ and
 $20^{\circ }$ (Ringuette et al. Reference Ringuette, Wu and Martín2008). Pirozzoli & Bernardini (Reference Pirozzoli and Bernardini2011) also report a typical structure angle based on
 $u^{\prime }$ of around
 $14^{\circ }$ in their DNS at
 $Ma = 2.0$. However, Pirozzoli & Bernardini (Reference Pirozzoli and Bernardini2011) also report that the structure angles based on density and temperature fluctuations are typically two times larger than the
 $u^{\prime }$ structures. This explains why the inclination angles measured with Rayleigh scattering (Smith & Smits Reference Smith and Smits1995) and hot-wires (Spina, Donovan & Smits Reference Spina, Donovan and Smits1991) in compressible flows are much larger than the velocity based angle calculation.
Considering the streamwise extent of  $R_{uu}$, the correlation appears to be slightly longer (
 ${\sim }20\,\%$ increase) for the supersonic case in comparison to
 $Ma = 0.3$. However, due to low-level correlation below 0.2 with the surrounding field for
 $Ma = 0.3$, conclusions about the spatial extent of these low correlation values must be made with caution. This low-level correlation could be related to the fact that the nominal freestream turbulence intensity level in this particular blow-down wind tunnel is larger at
 $Ma = 0.3$ than at
 $Ma = 2.0$ (Scharnowski et al. Reference Scharnowski, Bross and Kähler2019). Nevertheless, the contour lines corresponding to
 $R_{uu} = 0.2$ undoubtedly appear slightly larger in the streamwise direction.
To examine the dominant frequencies associated with the coherent flow motions, the spectrogram of pre-multiplied power spectral density (PSD) was calculated for  $Ma = 0.3$ and 2.0 and is plotted in figures 8(a) and 8(b). While the velocity fields measured with PIV in this case are only acquired at 15 Hz, the relatively large field of view allows for the spectral content in a spatial sense to be calculated without the assumption of Taylor's hypothesis of frozen turbulence. The
 $PSD$ was computed from vector fields based on an interrogation window size of
 $\textrm {IW} = 16 \times 16$ pixels with
 $50\,\%$ overlap using the method of Welch (Reference Welch1967). The
 $PSD$ was calculated at each wall normal position using a single Hamming window corresponding to FOV length in the streamwise distance for 1000 statistically independent velocity fields. The spectra for each time step were then averaged together to produce the final
 $PSD$ spectrograms.
Pre-multiplied streamwise velocity spectrogram  $(\bar {\rho }/\rho _{w}) k_x \varPhi _{uu}/u_{\tau }^2$ for (a)
 $Ma = 0.3$,
 $p_0 = 1.5$ and (b)
 $Ma = 2.0$,
 $p_0 = 2.2$ as a function of streamwise wave length,
 $\lambda _x$ and wall-normal direction,
 $z$ scaled with
 $\delta _{99}$. Solid contour lines correspond to
 $(\bar {\rho }/\rho _{w}) k_x \varPhi _{uu}/u_{\tau }^2 = 1.1$, 1.2 and 1.3. The vertical and horizontal axis limits are the same in (a) as in (b).

The highest resolvable frequency is limited by the vector spacing of the velocity fields and effectively sets the spatial resolution of the measurement. Therefore, the wavelength of the largest resolvable frequency corresponds to the distance between two interrogation windows. With an IW of size  $16\ \textrm {px} \times 16\ \textrm {px}$ the minimum resolvable wavelength corresponds to
 $\lambda = 0.6\ \textrm {mm}$. Likewise, the maximum resolvable wavelength corresponds to the FOV size. However, the
 $PSD$ is actually over sampled due to overlapping interrogation windows, which then corresponds to minimum resolvable wavelengths of 0.3 mm. However, it is important to note that the
 $PSD$ for spatial frequencies higher than (2/IW) does not satisfy the Nyquist criterion and are within the noise floor. Thus, the resolved wavelength range is from 0.6 mm to 175 mm in the streamwise direction, which is sufficient to resolve the features of the large-scale structures.
In these plots the largest values of normalized pre-multiplied velocity spectra,  $(\bar {\rho }/\rho _{w}) k_x \varPhi _{uu}/u_{\tau }^2$, appear in a concentrated region with a maximum at a streamwise wavelength of
 $\lambda _x/\delta _{99}\approx 4.1$ and 5 for Mach 0.3 and 2.0, respectively, which corresponds to about a
 $20\,\%$ increase. While measurements closer to the wall were not possible in these experiments, this peak in the spatial spectral plots is indicative of the secondary peak (Fernholz & Finley Reference Fernholz and Finley1996; Monty et al. Reference Monty, Hutchins, NG, Marusic and Chong2009; Samie et al. Reference Samie, Marusic, Hutchins, Fu, Fan, Hultmark and Smits2018) in the streamwise velocity fluctuations. Since this peak is associated with the meandering superstructures in the log-law layer, it can be concluded that the superstructures are associated with slightly longer (by approximately
 ${\sim }20\,\%$) streamwise energetic wavelengths for
 $Ma = 2.0$ as compared to
 $Ma = 0.3$.
4.2. Cross-flow structures
In order to visualize and analyse the organization of coherent flow structures in the spanwise direction at different wall normal heights, SPIV measurements were performed in a cross-stream plane for all Mach numbers listed in table 1. Exemplary instantaneous velocity fields are shown in figures 9(a) and 9(b) to illustrate the slope and spanwise spacing of the large-scale structures. In the following, the characteristic spatial distribution of coherent structures in the spanwise direction via multi-point statistics and spatial spectral calculations are presented.
Instantaneous velocity field  $u/U_f$ in the
 $yz$-plane or SPIV plane, where
 $U_f = 0.99U_{\infty }$ at (a)
 $Ma = 0.3$,
 $p_0 = 1.5$ and (b)
 $Ma = 2.0$,
 $p_0 = 2.2$. Wall-normal,
 $z$, and spanwise,
 $y$, directions are scaled with
 $\delta _{99}$, which is 24.5 and 14 mm for
 $Ma = 0.3$,
 $p_0 = 1.5$ and
 $Ma = 2.0$,
 $p_0 = 2.2$, respectively.

To quantify the average spacing of superstructures in the spanwise direction, two-point correlations of the streamwise velocity fluctuations in the spanwise direction for the range of Mach and Reynolds numbers was done. Shown in figures 10(a) and 10(b) are slices of the correlation coefficient  $R_{uu}$ at
 $z_0/\delta _{99} = 0.2$ and 0.5. In these figures, the spanwise shift is represented as
 $\xi _y$, where
 $\xi _y = y_o + \Delta y$ with
 $y_0$ corresponding to the centre of the FOV in the spanwise direction.
Two-point correlation coefficient  $R_{uu}$ slice across the spanwise direction at (a)
 $z_0/\delta _{99} = 0.2$ and (b)
 $z_0/\delta _{99} = 0.5$ for
 $0.3 \leq Ma \leq 3.0$. Plotted on the horizontal axis
 $\xi _y = y_0 + \Delta y$ where
 $y_0$ is the centre of the field of view in the spanwise direction and
 $\xi _y$ is scaled with
 $\delta _{99}$. Grey solid line represents incompressible reference
 $R_{uu}$ from DNS computations at
 $Re_{\tau } \approx 2000$ or
 $Re_{\theta } \approx 6500$ (Sillero, Jiménez & Moser Reference Sillero, Jiménez and Moser2013) of a ZPG turbulent boundary layer.

The slices of  $R_{uu}$ at
 $z_0/\delta _{99} = 0.2$ interestingly reveal that there is a clear division between the correlations for
 $Ma < 1$ and the ones for
 $Ma > 1$. For
 $Ma < 1$ the distance between minimum correlation values is approximately
 $0.8\delta _{99}$, including the correlation result from a turbulent boundary layer incompressible DNS reference at
 $Re_{\tau } \approx 2000$ (Sillero et al. Reference Sillero, Jiménez and Moser2013). In contrast, for
 $Ma > 1$ the distance between minima is approximately
 $1.1\delta _{99}$, which is almost a
 $40\,\%$ increase from the subsonic cases. This implies that the spacing and or the width of superstructures increases rather discretely when the flow passes the sound barrier. Interestingly, this spacing increase appears to be independent of Mach number in the sense that no trend with Mach number is present except for the fact that the Mach number is either sub- or supersonic. Furthermore, the correlation is unaffected by Reynolds number since the correlations collapse for
 $Ma = 0.8$
 $p_0 = 1.5$ and
 $p_0 = 3.0$ where
 $Re_{\delta _2}$ changes by a factor of two. The same collapse for the supersonic Reynolds number variation is also visible for
 $Ma = 2.0$
 $p_0 = 2.2$ and
 $p_0 = 4.5$. A lack of the variation in the spanwise correlation length scales with Reynolds number was also confirmed in experimental investigations of incompressible turbulent boundary layers over several decades of Reynolds numbers in Hutchins & Marusic (Reference Hutchins and Marusic2007a). If a slice of the correlation is taken at
 $z_0/\delta _{99} = 0.5$ as shown in figure 10(b), the discrete increase in spacing from
 $Ma < 1$ to
 $Ma > 1$ is still visible although width of correlations has increased when compared to the spacing at
 $z_0/\delta _{99} = 0.2$. In addition, the width increase of
 $R_{uu}$ from subsonic to supersonic is only
 ${\sim }20\,\%$ at this wall location.
The apparent discrepancy between the subsonic and supersonic correlation results cannot be explained by the relative change in scaled spatial resolution due to the change in boundary layer thickness, as shown in figure 11. For all Mach numbers the same physical spatial resolution, which is fixed by the size of the IW, was used. With an  $\textrm {IW} = 24 \times 24$ pixels the smallest resolvable spatial scale for
 $Ma = 0.8$
 $p_0 = 1.5$ is
 $0.018\delta _{99}$ and
 $0.035\delta _{99}$ for
 $Ma = 2.0$
 $p_0 = 2.2$. To show that this variation in relative spatial resolution does not influence the correlation results,
 $R_{uu}$ was calculated for different window size for
 $Ma = 0.8$
 $p_0 = 1.5$ and
 $Ma = 2.0$
 $p_0 = 2.2$ and is plotted in figure 11. For both the subsonic and supersonic cases a variation of IW size does not result in a change of the location of the correlation peaks, which indicates that the spatial resolution of the presented measurement is sufficient to resolve the spacing of the superstructures in the spanwise direction when scaled with
 $\delta _{99}$.
Two-point correlation coefficient  $R_{uu}$ slice across the spanwise direction at
 $z_0/\delta _{99} = 0.2$ of
 $Ma = 0.8$,
 $p_0 = 1.5$ and
 $Ma = 2.0$,
 $p_0 = 2.2$ for different minimum spatial resolutions based on the PIV interrogation window (IW) size. Plotted on the horizontal axis
 $\xi _y = y_0 + \Delta y$ where
 $y_0$ is the centre of the field of view in the spanwise direction and
 $\xi _y$ is scaled with
 $\delta _{99}$.

To demonstrate that the apparent bi-modal behaviour of structure spacing for the sub- and supersonic cases shown in figures 10(a) and 10(b) is influenced by the scaling, the same slices of R $_{uu}$ are plotted in figures 12(a) and 12(b) except that
 $\xi _y$ is scaled with the displacement thickness
 $\delta ^*$. Since the displacement thickness calculation in (3.1) depends on the mean density variation across the layer, a Mach number dependent variation in the
 $\delta ^*$ scaled structure spacing, shown in figures 12(a) and 12(b), would be expected. Since
 $\delta ^*$ increases with Mach number, see table 3, the structure spacing also decreases when scaled with
 $\delta ^*$. The bi-modal behaviour is still visible in the sense that there is a large jump in the structure spacing when the sound barrier is crossed to
 $Ma = 2$, but the spacing then continues to decrease up to
 $Ma = 3$. In any case, both the
 $\delta _{99}$ and
 $\delta ^*$ scaling indicate that relative size or spacing of superstructures varies with Mach number. Since the majority of superstructure scales reported in the literature use
 $\delta _{99}$, the following analysis will also use
 $\delta _{99}$ for scaling.
Two-point correlation coefficient  $R_{uu}$ slice across the spanwise direction at (a)
 $z_0/\delta _{99} = 0.2$ and (b)
 $z_0/\delta _{99} = 0.5$ for
 $0.3 \leq Ma \leq 3.0$. Plotted on the horizontal axis
 $\xi _y = y_0 + \Delta y$ where
 $y_0$ is the centre of the field of view in the spanwise direction and
 $\xi _y$ is scaled with the displacement thickness
 $\delta ^*$ (see (3.1)).

To confirm these findings at different wall normal distances, the spectra of the streamwise velocity pre-multiplied with the spanwise wave number as a function of spanwise wave lengths and wall normal distance for  $Ma = 0.3$,
 $p_0 = 1.5$ and
 $Ma = 2.0$,
 $p_0 = 2.2$ are plotted in figures 13(a) and 13(b). The
 $PSD$ was computed from vector fields based on an interrogation window size of
 $\textrm {IW} = 24 \times 24$ pixels with
 $50\,\%$ overlap using in a similar way as in the previous section. The
 $PSD$ was calculated for each wall-normal position along the entire extent of the streamwise distance for 1000 statistically independent velocity fields. The resolvable spanwise (
 $\lambda _y$) wavelength range calculated in the PSD spectrogram is from 0.5 mm to 81 mm.
Pre-multiplied streamwise velocity spectrogram  $(\bar {\rho }/\rho _{w}) k_y \varPhi _{uu}/u_{\tau }^2$ for (a)
 $Ma = 0.3$,
 $p_0 = 1.5$ and (b)
 $Ma = 2.0$,
 $p_0 = 2.2$ as a function of spanwise wavelength,
 $\lambda _y$, and wall-normal direction,
 $z$, scaled with
 $\delta _{99}$. The vertical and horizontal axis limits are the same in (a) as in (b).

The spectrograms plotted in figures 13(a) and 13(b) show both the wall-normal location and the spanwise wavelengths of spectral energy of streamwise velocity fluctuations in the cross-flow plane. The most energetic wavelengths for  $Ma = 0.3$ vary between
 $\lambda _y = 0.7$ and
 $0.9\delta _{99}$, increasing slightly with wall-normal distance. Correspondingly, the most energetic wavelengths for
 $Ma = 2.0$ vary between
 $\lambda _y = 0.9$ and
 $1.2\delta _{99}$ with wall-normal distance. If these wavelengths are viewed as representative of the average spacing between two low- or high-momentum superstructures, the spectral results are consistent with the observations from the
 $R_{uu}$ slices in figures 10(a) and 10(b). Therefore, it can be concluded that compressibility has a clear influence on the spanwise spacing scaled with
 $\delta _{99}$ of superstructures identified based on velocity fluctuations.
4.3. Elongated structures in a wall parallel plane
To confirm directly that long high- and low-momentum meandering superstructures exist in the log-law region for the subsonic and supersonic cases investigated herein, PIV measurements in a wall-parallel plane ( $xy$) were performed. Two exemplary instantaneous fields of the fluctuating streamwise velocity normalized with the local mean velocity (
 $u^{\prime }/\bar {u}$) are plotted in figures 14(a) and 14(b) for
 $Ma = 0.3$
 $p_0 = 1.5$ and
 $Ma = 2.0$
 $p_0 = 2.2$, respectively. The wall-parallel measurements were accomplished by aligning a laser light sheet parallel to the wall. Since the boundary layer thickness changes with Mach number, see table 3, the location of the measurement plane with respect to
 $z/\delta _{99}$ also changes with Mach number. Hence, the measurement plane was located at approximately
 $z/\delta _{99} = 0.1$ for the subsonic cases and at
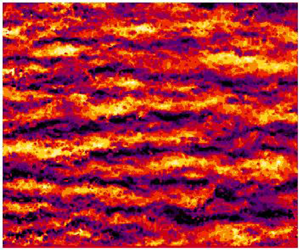
 $z/\delta _{99} = 0.2$ for the supersonic cases. However, since both of these planes are located in the log-law layer, the presence of meandering superstructures in both the subsonic and supersonic cases is directly visible. Qualitatively, it can be seen that instantaneous high- and low-momentum structures can persist up to several boundary layer thicknesses and have a spanwise spacing of around one boundary layer thickness.
Instantaneous streamwise velocity fluctuation fields in the  $xy$ plane for (a)
 $Ma = 0.3$,
 $p_0 = 1.5$ and (b)
 $Ma = 2.0$,
 $p_0 = 2.2$. The measurement plane is located at
 $z/\delta _{99} = 0.1$ and 0.2 for
 $Ma = 0.3$ and 2.0, respectively.

In the previous section, it was shown that the spatial correlations and spectral wavelengths associated with the spanwise spacing of the superstructures distinctly changes with Mach number. To confirm this finding in the wall-parallel plane, a spectral analysis of the streamwise velocity fluctuations in the spanwise direction was performed. Similar to the previous sections, a  $PSD$ was calculated for each streamwise location along the entire spanwise distance of the FOV and then averaged together to produce the plot shown in figure 15(a). In this plot, the peak in the spectra is located just below
 $\lambda _y/\delta _{99} = 1$ for both subsonic cases and slightly above
 $\lambda _y/\delta _{99} = 1$ for the supersonic cases. While the location of the wall-parallel measurement plane was at slightly different
 $z/\delta _{99}$ locations for the subsonic and supersonic cases due to the changing boundary layer thickness, the finding that the structure spacing is larger for supersonic as compared to subsonic is consistent with the finding in the previous section, i.e. see figures 13(a) and 13(b).
(a) Pre-multiplied streamwise velocity spectra  $(\bar {\rho }/\rho _{w}) k_y \varPhi _{uu}/u_{\tau }^2$ for
 $0.3 \leq Ma \leq 3.0$ vs. spanwise wavelength,
 $\lambda _y$ scaled with
 $\delta _{99}$. (b) Standard deviation
 $\sigma$ and mean
 $\mu$ of a normal distribution fit of the spanwise wavelengths
 $\lambda _y$ from (a) for each Mach number. Spectra calculated from wall-parallel planar PIV measurements.

For incompressible flows it has been shown that the amount or intensity of spanwise meandering of individual superstructures increases with wall-normal height (Kevin, Monty & Hutchins Reference Kevin, Monty and Hutchins2019). Since the measurements shown in figure 15(a) are located at slightly different  $z/\delta _{99}$ locations, a quantitative analysis of the meandering magnitude might be influenced by wall-normal measurement location rather than the Mach number variation. However, for the wall-normal locations 0.1 and 0.2
 $\delta _{99}$ the meandering intensity variation is rather small (Kevin et al. Reference Kevin, Monty and Hutchins2019).
Instead of detecting individual structures and calculating their spanwise meandering frequency, the meandering influence on the spanwise length scale distribution for each Mach number can be deduced from a closer look at the spanwise spectra plotted in figure 15(a). The  $PSD$ is calculated for all streamwise locations in the spanwise direction and ensemble averaged over all velocity fields. Therefore, the resulting average spectra plotted in figure 15(a) contains all the measurable frequencies/wavelengths of the
 $u^{\prime }$ fluctuations in the spanwise direction. Since a distinct energetic peak of
 $\lambda _y$ is visible for all Mach numbers, it can be concluded that there is only one structure (
 $\delta$ scaled) spacing or width present for each case. The distribution of the scales to the left and right of the maximum can then be related to the meandering nature of the superstructures. A more narrow distribution of spanwise wavelengths would mean that the structures meander less than if a wider distribution were present.
To look at this point more carefully, a normal distribution was fitted to the spanwise wavelengths,  $\lambda _y$, in figure 15(a). The standard deviation (
 $\sigma$) and mean (
 $\mu$) of this fit for each Mach number in figure 15(a) are shown in figure 15(b). In addition to the peak
 $\lambda _y$ value (
 $\mu$) the width at 1
 $\sigma$ is also larger for the supersonic cases. This would then imply that the meandering of the superstructures is also influenced by Mach number. However, the distinct shift in the spanwise wavelength of the most energetic fluctuations or
 $\mu$ from the fit also indicates that the average superstructure spacing or width is larger for the supersonic cases when scaled with
 $\delta _{99}$.
5. Discussion and conclusions
In this work, ZPG turbulent boundary layers developing on a flat plate over a range of  $0.3 \leq Ma \leq 3.0$ are measured with planar 2-D and stereo-PIV with the aim to study the characteristics of large-scale coherent structures otherwise known as superstructures. It is important to note that the comparison of subsonic, transonic and supersonic turbulent boundary layers is done in the same wind tunnel facility, where the flow quality is well documented for the range of Mach numbers considered (Scharnowski et al. Reference Scharnowski, Bross and Kähler2019).
It was first shown that the organization of the flow field in the streamwise wall-normal direction remains qualitatively similar for sub- and supersonic cases. Elongated structures in the log-law layer with an inclination angle of  ${\sim }14^{\circ }$ in the instantaneous and mean correlation of streamwise velocity fluctuations were observed for both
 $Ma = 0.3$ and 2.0. In addition, 2–4 instantaneous UMZs in the log-law layer and wake region were detected for both cases, suggesting that the organization and layering of coherent motions are unchanged by Mach number.
In order to scale the mean velocity and fluctuations so that the mean variation of the density and temperature across the boundary layer are accounted for, a demonstration of the Van Driest and Morkovin scaling approaches were presented. The proper scaling was essential for the statistical analysis so that the sub- and supersonic flows can be compared. It was then demonstrated by using multi-point statistical and spatial spectral methods applied to the data that compressibility has an effect on the spacing and spatial extent of superstructures in the streamwise and spanwise directions when scaled with  $\delta _{99}$. It was shown that superstructures in the sub- and supersonic boundary layers appear qualitatively similar to the incompressible cases found in the literature. However, the length, relative to the boundary layer thickness, of the streamwise energetic wavelengths associated with superstructures was shown to increase around
 $20\,\%$ from the subsonic to the supersonic case, which is in contrast to the decrease in streamwise mass flux
 $(\rho u)^{\prime }$ correlation length with increasing Mach number reported in Smith & Smits (Reference Smith and Smits1995). Furthermore, while a slight increase in the streamwise correlation with increasing Mach number was shown herein, it was by far not as large of an increase (four times) as observed in Ganapathisubramani et al. (Reference Ganapathisubramani, Clemens and Dolling2006), which was also based on PIV measurements. The incompressible data compared in Ganapathisubramani et al. (Reference Ganapathisubramani, Clemens and Dolling2006) was an order of magnitude lower Reynolds number than the supersonic case, and therefore the large increase in the reported streamwise length scale could be partially explained by Reynolds number effects. For the comparison of streamwise length scales presented in this paper the
 $Re_{\delta _2}$ values for Mach 0.3 and 2.0 are almost identical.
Finally, the spanwise distribution of the superstructures were analysed and a distinct increase relative to the boundary layer thickness in the spanwise spacing of superstructures was observed for cases where  $Ma > 1$ compared to the cases where
 $Ma < 1$. This was based on the two-point correlation and spectral calculations of the streamwise velocity fluctuations in the spanwise direction. A slight increase in spanwise spacing from subsonic to supersonic Mach number – around
 $15\,\%$ at
 $z/\delta = 0.5$ – was also noted in the DNS results of Pirozzoli & Bernardini (Reference Pirozzoli and Bernardini2011), which is similar to the results presented herein where the increase in spanwise spacing from subsonic to supersonic at
 $z/\delta _{99} = 0.5$ was
 ${\sim }20\,\%$. However, the aforementioned experimental investigations from the literature, either hot-wire or PIV, do not report a variation in the spanwise spacing with Mach number. The PIV measurements of Ganapathisubramani et al. (Reference Ganapathisubramani, Clemens and Dolling2006) actually show an increase in spanwise length scales when compared to an incompressible case at
 $z/\delta = 0.5$ but not at the
 $z/\delta = 0.1$ location, and the reported increase, much like the streamwise length scales, is much larger than both the results from DNS and the experiments presented herein.
There is not a definitive consensus on why there is a lack of agreement in the experimental results reported here and in the literature with regards to compressible flow structure length and spacing. However, a combination of different measurement techniques and facilities is likely a contributor, e.g. analysis of mass-flux  $(\rho u)^{\prime }$ and temperature fluctuations from hot-wire experiments versus only
 $u^{\prime }$ fluctuations recorded with PIV. The differences in PIV and hot-wire data might be simply explained by the fact that different quantities are measured. Furthermore, spatial scales from hot-wire measurements often rely on the validity of Taylor's frozen turbulence hypotheses whereas PIV offers the ability to measure the velocity distribution directly in a spatial domain. The applicability of hot-wires in compressible flow also depends on accurate calibrations, and the sensor itself must be robust enough to withstand the often harsh experimental conditions. However, recent developments in nano-scaled anemometer devices specially designed for compressible flows (Kokmanian et al. Reference Kokmanian, Scharnowski, Bross, Duvvuri, Fu, Kähler and Hultmark2019) could be used to explore the turbulent dynamics of boundary layers in the future.
A downside of all these experimental techniques is that the instantaneous thermodynamic properties cannot be measured simultaneously or independently from the velocity field. While this is possible in DNS, numerical simulations are limited at the moment to relatively low Reynolds numbers or to relatively small spatial and temporal domains making the convergence of statistics for large-scale structures difficult to achieve.
It is difficult to explain without speculating why other PIV results differ from the current data set results. For the measurements discussed herein, the comparisons between Mach numbers were performed in the same wind tunnel facility on the same boundary layer plate with the same measurement configurations. The wind tunnel operation and freestream properties are well documented in Scharnowski et al. (Reference Scharnowski, Bross and Kähler2019), and the corner vortices and leading edge transition details are also known. However the high Reynolds number range and other experimental features, e.g. the cold edge temperature for the supersonic case and the varying turbulence intensity in the freestream with Mach number, can make it challenging to compare to DNS.
Nevertheless, the experimental result presented herein does agree in part with the structural analysis in the available DNS. Therefore, it can be concluded that compressibility has a clear effect on boundary layer features and that the scaling of superstructures based on the boundary layer thickness results in longer and wider superstructures for supersonic turbulent boundary layers when compared to their subsonic counterparts. This result can be viewed as a challenge to Morkovin's assertion in 1962 ‘that the essential dynamics of these supersonic shear flows will follow the incompressible pattern’. However, assessing the complete physical details of these flows requires an independent measurement of all the fluctuating properties, i.e. velocity, density and temperature, in and around the flow structures, which is very challenging experimentally.
Funding
This work is supported by the Priority Programme SPP 1881 Turbulent Superstructures funded by the Deutsche Forschungsgemeinschaft project numbers KA1808/21-1 and KA1808/21-2.
Declaration of interests
The authors report no conflict of interest.




