1. Introduction
Vortex-induced vibration (VIV) of elastically mounted spheres is a crucial research area with applications in underwater mines, marine buoys and towed objects (Behara, Borazjani & Sotiropoulos Reference Behara, Borazjani and Sotiropoulos2011; Behara & Sotiropoulos Reference Behara and Sotiropoulos2016). Experimental studies on tethered spheres have revealed large-amplitude VIV responses similar to cylinders, identifying four vibration modes (I–IV) within the reduced velocity range of
 $5 \leq U^{\ast } \leq 10$
(Govardhan & Williamson Reference Govardhan and Williamson1997, Reference Govardhan and Williamson2005; Williamson & Ghovardhan Reference Williamson and Ghovardhan1997; Jauvtis, Govardhan & Williamson Reference Jauvtis, Govardhan and Williamson2001). Modes I and II exhibited synchronised oscillation frequencies with the shedding frequency and the system’s natural frequency (van Hout, Katz & Greenblatt Reference van Hout, Katz and Greenblatt2013; Krakovich, Eshbal & van Hout Reference Krakovich, Eshbal and van Hout2013). Unlike the abrupt transitions in cylinder responses, the sphere’s response smoothly shifted from mode I to mode II, with a consistent
 $90^{\circ }$
phase difference between the vortex force and sphere displacement (Govardhan & Williamson Reference Govardhan and Williamson2005). This transition involved a change in vortex shedding timing relative to the sphere’s motion, aligning with the observed vortex phase shift.
Jauvtis et al. (Reference Jauvtis, Govardhan and Williamson2001) identified multiple modes of VIV for a tethered sphere in wind tunnel experiments, including modes I, II, III and IV across a wide range of mass ratios (
 $m^{\ast }=0.1{-}1000$
) and reduced velocity
 $U^{\ast }=0{-}300$
. Modes I and II, occurring at
 $U^{\ast } \approx 5{-}10$
, showed lock-in, where the vortex shedding frequency synchronised with the sphere’s natural frequency (Govardhan & Williamson Reference Govardhan and Williamson2005). Modes III and IV occurred at higher
 $U^{\ast }$
, with mode III (
 $U^{\ast } \approx 20{-}40$
) showing periodic vibrations, while mode IV (
 $U^{\ast } \gt 100$
) exhibited aperiodic, large-amplitude vibrations. Mode III’s shedding frequency was higher than the vibration frequency, while mode IV lacked synchronisation with vortex shedding. Numerical studies on VIV of spheres have yielded significant findings. At Reynolds number,
 $Re=500$
, Pregnalato (Reference Pregnalato2003) found modes II–IV for
 $m^{\ast }=0.082$
and 0.8, with mode II occurring at
 $U^{\ast } \approx 5{-}10$
for
 $m^{\ast }=0.8$
. However, mode IV was absent at
 $m^{\ast }=0.082$
, suggesting a critical mass ratio. Meanwhile, Lee, Hourigan & Thompson (Reference Lee, Hourigan and Thompson2013) investigated a neutrally buoyant sphere (
 $m^{\ast }=1$
) across
 $50 \le Re \lessapprox 12\,000$
and identified seven distinct wake regimes.
Behara et al. (Reference Behara, Borazjani and Sotiropoulos2011), for the first time, conducted numerical simulation of the VIV of a sphere with 3 degrees of freedom (3-DOFs) at
 $Re=300$
,
 $m^{\ast }=2$
and
 $U^{\ast }=4{-}9$
. They observed hairpin and spiral vortices in the lock-in regime for two branches. At the beginning of the lock-in regime, corresponding to the spiral mode branch, they observed hysteresis in the response amplitude. Conversely, the hairpin mode exhibited lower-amplitude vibrations for increasing
 $U^{\ast }$
until the synchronisation regime began. Subsequently, Behara & Sotiropoulos (Reference Behara and Sotiropoulos2016) extended their simulations to higher ranges of
 $Re$
and
 $U^{\ast }$
. They reported a transition from spiral to hairpin shedding mode around
 $Re=500{-}600$
, accompanied by a change in the sphere trajectory from circular to elliptical orbits. Rajamuni, Thompson & Hourigan (Reference Rajamuni, Thompson and Hourigan2018a
) numerically investigated the transverse VIV of a sphere for
 $Re=300$
and
 $800$
at
 $m^{\ast }=1.5$
. They observed highly periodic large-amplitude VIV responses, designated as branch A, within
 $5.5\le U^{\ast }\le 10$
for
 $Re=300$
, which widened to the range
 $4.5\le U^{\ast }\le 13$
at
 $Re=800$
. Later, Rajamuni, Thompson & Hourigan (Reference Rajamuni, Thompson and Hourigan2020) simulated the VIV of a tethered sphere for
 $Re=500$
,
 $1200$
and
 $2000$
at
 $3\le U^{\ast }\le 32$
. They reported an aperiodic mode IV response in each case for higher
 $U^{\ast }$
, suggesting that such a response appears at lower
 $U^{\ast }$
for low-inertia systems and vice versa for high-inertia systems. For a 3-DOF VIV of a sphere, numerical results of Rajamuni, Thompson & Hourigan (Reference Rajamuni, Thompson and Hourigan2019) showed that, with 3-DOF movement, the sphere starts vibrating linearly in synchronisation with vortex shedding, then shifts to a circular orbit with a helical wake. Lower Reynolds numbers delay this transition, with the vibration smaller in 3-DOFs (0.6 diameters) than in 1-DOF-only motion (0.8 diameters).
The flow around a rotating sphere is strongly influenced by its direction of rotation (Magnus Reference Magnus1853; Rubinow & Keller Reference Rubinow and Keller1961; Robins Reference Robins1972). Studies (Kurose & Komori Reference Kurose and Komori1999; Niazmand & Renksizbukut Reference Niazmand and Renksizbukut2003) found that both lift and drag increase with
 $\Omega (=D\alpha /2U_{\infty })$
at higher Reynolds numbers. Here,
 $D$
is the sphere diameter,
 $U_{\infty }$
is the streaming velocity and
 $\alpha$
is the angular speed of the sphere. Three-dimensional simulations by Kim & Choi (Reference Kim and Choi2002) revealed a ‘frozen’ state of vortical structures at dimensionless rotation
 $\Omega =0.5$
and
 $Re=300$
for a streamwise rotating sphere. Kim (Reference Kim2009) later found that the critical speed for shear-layer instability is lower at
 $Re=300$
than at
 $Re=250$
. Lorite-Díez & Jiménez-González (Reference Lorite-Díez and Jiménez-González2020) further studied streamwise rotating spheres
 $(\Omega =0\,{-}\,3, Re\leq 1000)$
, showing a transition from periodic to chaotic flow regimes. Recent studies have explored the effect of transverse rotation on wake transitions around a sphere up to
 $\Omega \leq 4$
(Giacobello, Ooi & Balachandar Reference Giacobello, Ooi and Balachandar2009; Kim Reference Kim2009; Sierra-Ausín et al. Reference Sierra-Ausín, Lorite-Díez, Jiménez-González, Citro and Fabre2022). Kim (Reference Kim2009) observed shear-layer instability at
 $\Omega = 1.2$
for
 $Re=250$
and at
 $\Omega = 1\,{-}\,1.2$
for
 $Re = 300$
. Research on transverse rotation identified shear-layer instability and new flow regimes, including the separatrix regime (Dobson, Ooi & Poon Reference Dobson, Ooi and Poon2014), stable foci flow regime (Poon et al. Reference Poon, Ooi, Giacobello, Iaccarino and Chung2014) and varying wake regimes at high Reynolds numbers (Skarysz et al. Reference Skarysz, Rokicki, Goujon-Durand and Wesfreid2018).
In a recent study by Seyed-Aghazadeh & Modarres-Sadeghi (Reference Seyed-Aghazadeh and Modarres-Sadeghi2015) on VIV of a transversely rotating elastically mounted cylinder at
 $0\leq \Omega \leq 2.6$
and
 $Re=350{-}1000$
, it was found that increasing rotation rates significantly narrowed the synchronisation range, with oscillations ceasing altogether at
 $\Omega =2.4$
. The vortex shedding pattern transitioned from ‘2S’ (two vortices per cycle) for
 $\Omega \leq 1.4$
to ‘P’ shedding (one pair of vortices per cycle) for
 $1.4 \leq \Omega \leq 1.8$
, with shedding continuing at higher rotation rates compared with a non-oscillating cylinder. Bourguet & Jacono (Reference Bourguet and Jacono2014) performed two-dimensional (2-D) and 3-D numerical simulations of VIV for a circular cylinder under forced rotation at
 $Re=100$
and
 $\Omega \in [0, 4]$
. They observed that the cylinder could oscillate freely up to
 $\Omega \approx 4$
, with vibration amplitudes reaching 1.9 diameters – 3 times greater than those of a non-rotating cylinder. The peak amplitude increased with reduced velocity, reaching its maximum at
 $\Omega =3.75$
. The range for synchronised vibrations expanded to
 $\Omega =3.5$
before contracting, with vibrations ceasing entirely at
 $\Omega =4$
. Additionally, two new vortex shedding patterns were identified at high rotation rates: ‘T + S’ (a triplet plus a single vortex per cycle) and ‘U’ (characterised by transverse undulations of spanwise vorticity layers without vortex detachment).
Unlike the flow past a freely vibrating or rotating sphere, very few studies have investigated the effect of forced rotation on the VIV response of an elastically mounted sphere. Sareen et al. (Reference Sareen, Zhao, Sheridan, Hourigan and Thompson2018) performed experiments on 1-DOF VIV of a transversely rotating sphere over
 $5000\lt Re\lt 30\,000$
,
 $3\le U^{\ast }\le 18$
and
 $0\le \Omega \le 7.5$
. The sphere’s response yielded a bell-shaped curve showing vibration modes I and II for
 $\Omega \le 1$
with a narrower synchronisation regime for increasing
 $\Omega$
. They found a gradual reduction of VIV with
 $\Omega$
and observed complete suppression for
 $\Omega \ge 6$
, where the wake deflected towards the advancing side of the sphere with the formation of large-scale flow structures. Rajamuni et al. (Reference Rajamuni, Thompson and Hourigan2018b
) carried out numerical simulations to investigate the influence of imposed transverse rotation on the VIV of a sphere restricted to translate only in the cross-stream direction (1-DOF) for
 $Re=300$
,
 $3.5\le U^{\ast }\le 11$
and
 $0\le \Omega \le 2.5$
. They observed highly periodic VIV for the rotation rates (
 $\Omega \lt 0.4$
, and
 $0.4\le \Omega \le 1.3$
), where a rigidly mounted rotating sphere showed the suppression of vortex shedding (at
 $Re=300$
). Their simulations demonstrated complete suppression of VIV for
 $\Omega \le 1.3$
and reasoned to attributed to the Magnus effect that eventually introduces symmetry breaking of the wake. The synchronisation range was found to be narrowed and moved mostly towards lower values of
 $U^{\ast }$
with increasing
 $\Omega$
.
While some studies focus solely on the impact of transverse rotation on VIV in 1-DOF system, the combined effects of streamwise and transverse rotation on 3-DOF VIV responses remain largely unexplored. Therefore, in this research, we have performed 3-D numerical simulations for a streamwise and transversely rotating sphere undergoing VIV at
 $Re=500$
for
 $2\le U^{\ast }\le 12$
and
 $m^{\ast }=2$
, using representative high and low rotation rates of
 $\Omega _{x,z}=0.2$
and 1. The detailed 3-D flow structures past the sphere obtained from our simulations harness the advantages of computational methods, yielding results that may be more difficult to achieve experimentally. Accordingly, the key research questions that have not been adequately addressed in the literature are as follows: (i) How do streamwise and transverse rotations affect the VIV response of a sphere in a 3-DOF system and its synchronisation? (ii) What vortex shedding modes occur in the downstream wake at different
 $\Omega _{x,z}$
, and how does local rotation influence vortex trajectories across axial planes? (iii) How does rotation influence the phase dynamics of fluid forces during VIV? (iv) What drives the rotational coupling of the sphere with wake transition behaviours? (v) What space–time dynamics is linked to streamwise and transverse rotations in this
 $U^{\ast }$
regime, and how do force coefficients behave with
 $\Omega _{x,z}$
?
2. Physical system and mathematical model
2.1. Physical system
As shown schematically in figure 1, the physical system involves an elastically mounted rotating sphere placed in a uniform left-to-right flow in an unbounded domain. The sphere can vibrate in all three spatial directions in response to the flow-induced forces following the damped oscillator dynamics. We have chosen the 3-D coordinate system with the origin at the centre of the sphere. The flow is along the
 $x$
direction, while the
 $y$
and
 $z$
directions represent the cross-stream and transverse directions, respectively. The sphere is considered a rigid body and can rotate about
 $x\hbox{-}$
axis during streamwise rotation, whereas about the
 $z\hbox{-}$
axis during transverse rotation. The primary control parameters of our study are the Reynolds number
 $Re=U_{\infty }D/\nu$
, where
 $\nu$
is the fluid kinematic viscosity, and dimensionless streamwise
 $ (\Omega _{x}=D\alpha _{x}/2U_{\infty } )$
and transverse
 $ (\Omega _{z}=D\alpha _{z}/2U_{\infty } )$
rotational speeds of the sphere. Here,
 $\alpha _{x}$
and
 $\alpha _{z}$
denote the sphere’s angular velocities in the
 $x$
and
 $z$
directions, respectively. In our research, at a fixed
 $Re=500$
(Poon et al. Reference Poon, Ooi, Giacobello, Iaccarino and Chung2014), we have chosen sample situations for high and low rotational speeds
 $\Omega _{x, z}=0.2, 1$
, and compared with the results for a non-rotating sphere
 $(\Omega =0)$
undergoing VIV.
2.2. Mathematical description
The constant property, unsteady, incompressible Navier–Stokes equations govern the fluid motion and may be expressed in the dimensionless form as
 \begin{align} \frac{\partial u_i}{\partial x_i} &= 0\end{align}
 \begin{align} \frac{\partial u_i}{\partial t} + \frac{\partial (u_i u_j)}{\partial x_{\!j}} &= -\frac{\partial p}{\partial x_i} + \frac{1}{Re} \frac{\partial^2 u_i}{\partial x_{\!j} \partial x_{\!j}} \end{align}
Here,
 $u_i= ( u,\,v,\,w )$
are the dimensionless velocity components in the
 $x-(u)$
,
 $y-(v)$
,
 $z-(w)$
directions,
 $p$
is the dimensionless pressure and
 $t$
is the dimensionless time. Note that we have used
 $D$
and
 $U_\infty$
as the reference length and velocity scales for making the conservation equations dimensionless, whereas the pressure is normalised with
 $\rho U_{\infty }^2$
. The sphere of mass
 $m$
, stiffness
 $k$
, damping coefficient
 $c$
and natural frequency
 $f_n$
is elastically mounted and is assumed to behave as a spring–mass–damper system with three linear DOFs in an expense of fluid of density
 $\rho$
. The motion of the sphere is governed by Newton’s second-order damped oscillator, written in dimensionless form as
 \begin{equation} \ddot {h}+\frac {4\pi \zeta }{{U^\ast }}\dot {h}+\left (\frac {2\pi }{{U^\ast }}\right )^2 h=\frac {{C_i}}{2 m^\ast }, \;\;h = \begin{Bmatrix} x\\y\\z \end{Bmatrix}. \end{equation}
Here,
 $m^\ast =6\,m/\pi \rho D^3$
is the dimensionless mass of the sphere, defined as the ratio of the sphere’s mass to the mass of the displaced fluid. We have set the damping ratio
 $\zeta =0$
to allow maximum oscillation of the sphere during VIV. The parameter
 $C_i$
represents the dimensionless fluid forces in the
 $x$
,
 $y$
and
 $z$
directions. The reduced velocity,
 $U^\ast =U_\infty /{{{f}_n}D}$
, is defined as the inverse of the non-dimensional natural frequency of the sphere,
 $f_{n}=(1/2\pi )\sqrt {k/m}$
. In our analysis, we have selected a long range of the reduced velocity,
 $2 \le U^\ast \le 12$
at a fairly low mass ratio
 $m^{\ast }=2$
, in search of varied response of the sphere.
A schematic diagram of an elastically mounted rotating sphere in a uniform flow. The sphere is free to move in all three spatial directions. The dimensionless rotational speed of the sphere along the streamwise and transverse directions are given as
 $\Omega _{x}$
and
 $\Omega _{z}$
, respectively.

The sphere is placed in a domain that extends
 $32D, 16D$
and
 $ 16D$
in the streamwise, transverse and cross-stream directions. We have specified a uniform velocity
 $(u, v, w)=(1,0,0)$
boundary condition at the inlet. In contrast, a convective boundary condition
 $\partial u_i/\partial x=0$
is prescribed in the exit plane to minimise the upstream feedback and easy passage of the vortices. The boundary conditions in the shear-free vertical side boundaries read
 $\partial (u,v)/\partial z=0,w=0$
, whereas on the horizontal boundaries
 $\partial (u,w)/\partial y=0,v=0$
. A zero normal pressure gradient boundary condition is imposed at all the boundaries except for the exit plane, where the ambient pressure boundary condition at
 $p=0$
is set. We have computed all the cases from a no-flow state and permitted them to settle into a dynamic steady phase. After that, we run nearly thirty shedding cycles to compute the force coefficients and time-average fields shown in our study. We define the drag, lift and spanwise force coefficients as
 $C_{x,y,z}=F_{x,y,z}/(({1}/{2})\rho U_{\infty }^{2}\,D^2)$
, where
 $C_x$
,
 $C_y$
and
 $C_z$
are the drag, lift and spanwise force components acting on the sphere.
2.3. Numerical set-up
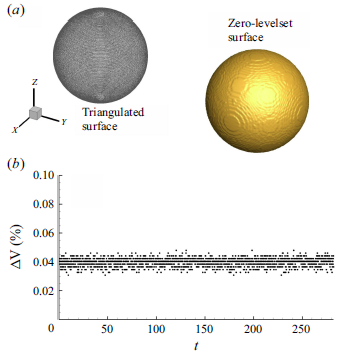
We have solved the fluid–structure coupled systems of governing equations (2.1)–(2.3) using a non-staggered finite volume technique. A diffuse interface immersed boundary method (Pan & Shen Reference Pan and Shen2009; De Reference De2016, Reference De2018) is used to resolve the complex boundaries. Please refer to Appendix A for further details. Nearly 82 000 triangular elements are used for the surface triangulation of the sphere, which we found to predict the sphere volume to nearly
 $1\,\%$
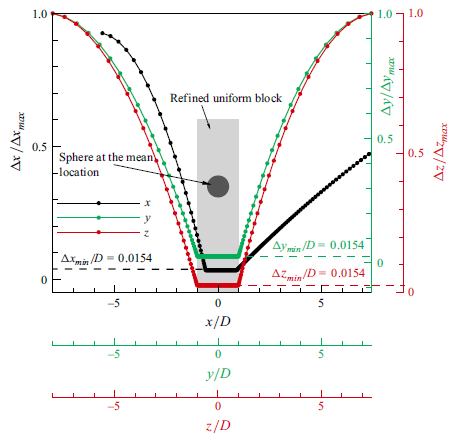
accuracy. We have employed non-uniform Cartesian mesh with uniform grids in a volume that envelops the sphere during transient simulations. The mesh structure for this moving boundary Fliud-structure interaction (FSI) is provided in Appendix B. A dimensionless time step
 $\Delta t=10^{-3}$
is used for computing all the cases that yield a maximum Courant number
 $Cu_{max }=0.12$
for
 $\Omega _{x}=1, U^{\ast }=5$
, which we found to be a reasonable trade-off between the speed and stability of the time-marching scheme. On an 850 Teraflops SMP cluster, the simulation time for all selected cases was around 40 000 core hours. The detailed mesh sensitivity analysis of the present study is given in Appendix C. Furthermore, we have also compared our numerical results with the available literature data, which are detailed in Appendix D.
3. Results
3.1. Rotation-induced structural response
Similar to the non-rotating case, the cross-stream (
 $y$
) and transverse (
 $z$
) directions are perceived to have the same character for axial rotation (
 $\Omega _x \gt 0)$
of the sphere. The response amplitudes are defined as
 \begin{align} A^{\ast }_y=\sqrt {2}y_{rms}/D,\,\,\,A^{\ast }_z=\sqrt {2}z_{rms}/D, \end{align}
where
 $y_{rms}$
and
 $z_{rms}$
are the root mean squares of the sphere displacement. Figure 2 presents the structural response of a non-rotating sphere along with the 1-DOF VIV data of Rajamuni et al. (Reference Rajamuni, Thompson and Hourigan2018b
) at
 $Re=300$
and the 1-DOF and 3-DOF VIV data of Rajamuni et al. (Reference Rajamuni, Thompson and Hourigan2019) at
 $Re=2000$
. The effects of streamwise and transverse rotation on the response amplitude for varying
 $U^{\ast }$
are compared with the non-rotating case in figures 3 and 4, while figure 5 presents the normalised frequency response
 $(f/f_{n})$
of the sphere over the reduced velocity range
 $2\le U^{\ast }\le 12$
for two rotation rates. We have also appended the
 $f/f_{n}-U^{\ast }$
data of Behara et al. (Reference Behara, Borazjani and Sotiropoulos2011) and Rajamuni et al. (Reference Rajamuni, Thompson and Hourigan2018b
) for the non-rotating case for comparison. The response frequency is the dominant frequency obtained by applying a fast Fourier transform to the
 $y(t)-t$
signals.
The structural response plot for non-rotating sphere
 $(\Omega =0)$
. The variation of the dimensionless maximum cross-stream amplitude
 $A_{y}^{\ast }$
and transverse amplitude
 $A_{z}^{\ast }$
with
 $U^{\ast }$
, compared with non-rotating sphere data from Rajamuni et al. (Reference Rajamuni, Thompson and Hourigan2018b
) at
 $Re=300$
and Rajamuni et al. (Reference Rajamuni, Thompson and Hourigan2019) for
 $Re=2000$
.

The structural response plot for the streamwise rotating sphere. The variation of the dimensionless maximum cross-stream amplitude
 $A_{y}^{\ast }$
and transverse amplitude
 $A_{z}^{\ast }$
with
 $U^{\ast }$
for different
 $\Omega _{x}$
. Response of a non-rotating sphere is also shown.

The structural response curve for the transversely rotating sphere. The variation of the dimensionless maximum cross-stream amplitude
 $A_{y}^{\ast }$
and transverse amplitude
 $A_{z}^{\ast }$
with
 $U^{\ast }$
for different
 $\Omega _{z}$
. The non-rotating sphere response is also shown.

The response of the sphere representing the dependence of the frequency ratio
 $f/f_{n}$
on
 $U^{\ast }$
for streamwise and transverse rotation rates. The non-rotating sphere response is shown, and the present results are compared with Behara et al. (Reference Behara, Borazjani and Sotiropoulos2011)and Rajamuni et al. (Reference Rajamuni, Thompson and Hourigan2018b
) for
 $Re=300$
.

3.1.1. Vortex-induced vibration of a non-rotating sphere
The present study shows gross agreement with the 1-DOF study for the non-rotating case of Rajamuni et al. (Reference Rajamuni, Thompson and Hourigan2018b
). A large-amplitude vibration,
 $A^{\ast }\approx 0.36D$
, observed in the streamwise rotating cases within the moderate range
 $5\le U^{\ast }\le 10$
(refer to the red curves plotted in figure 3), is also present in the non-rotating case. As was expected, oscillation characteristics in the
 $y$
and
 $z$
directions are the same, leading to identical
 $A^{\ast }_y-U^{\ast }$
and
 $A^{\ast }_z-U^{\ast }$
behaviour. Thus, statistically, two transverse directions receive an equal share of wake oscillation. The effect of the Reynolds number on VIV for a non-rotating sphere is clearly illustrated in figure 2 through the comparison data from Rajamuni et al. (Reference Rajamuni, Thompson and Hourigan2018b
, Reference Rajamuni, Thompson and Hourigan2019). As
 $Re$
increases, the response amplitude of the sphere grows for both 1-DOF and 3-DOF VIV cases. The highest vibration amplitude occurs in the 1-DOF scenario at
 $Re=2000$
. In contrast, the 3-DOF system shows a more moderate response, with lower amplitudes than the 1-DOF case, suggesting that additional DOFs reduce the overall oscillation magnitude. Rajamuni et al. (Reference Rajamuni, Thompson and Hourigan2019) noted that, in the 3-DOF VIV scenario, the sphere’s vibration amplitude decreased as it shifted from a linear path to a circular orbit at
 $Re=2000$
, a trend reflected in the current results shown in figure 2. However, at
 $Re=300$
, Behara et al. (Reference Behara, Borazjani and Sotiropoulos2011) observed smaller-amplitude vibrations when the sphere moved in a circular orbit compared with when it moved along a linear path. The frequency response of the non-rotating sphere is synchronised
 $(f/f_{n}\approx 1)$
, where the sphere is found to exhibit a sustained high-amplitude VIV over the extent of the lock-in regime. This behaviour is similar to the response data of Behara et al. (Reference Behara, Borazjani and Sotiropoulos2011) and Rajamuni et al. (Reference Rajamuni, Thompson and Hourigan2018b
), although, their frequency ratio shows a sudden jump at the beginning of the synchronisation regime.
3.1.2. Vortex-induced vibration of a streamwise rotating sphere
We observe that the response amplitudes in the cross-stream and transverse directions are comparable. We see that, at the moderate streamwise rotation rate
 $(\Omega _{x}=0.2)$
, the sphere shows VIV response from
 $U^{\ast }\ge 5$
. The response amplitude
 $ (A_{y,z}^{\ast } )$
overwhelms that of a non-rotating sphere beyond
 $U^{\ast }\ge 7$
and subsequently yields sustained oscillations with further increase in
 $U^{\ast }$
. We refer to this as the mode I response
 $(7\le U^{\ast }\le 12)$
, where we have found the spiral wake mode of vortex shedding as was seen for a non-rotating sphere (Behara et al. Reference Behara, Borazjani and Sotiropoulos2011). In the spiral mode, the sphere oscillates following a circular orbit through a transverse plane. With an increase in rotation rate, while a non-rotating sphere subsides, a rotating sphere is seen to sustain a high-amplitude response at larger
 $U^{\ast }$
. In comparison with
 $\Omega _{x}=0.2$
, the sphere exhibits early VIV response from
 $U^{\ast }=4$
at
 $\Omega _{x}=1$
, albeit with lower
 $A^{\ast }_{y, z}$
amplitudes. The response amplitude slowly grows with
 $U^{\ast }$
to its peak
 $ (A^{\ast }_{max}\approx 0.35D )$
at
 $U^{\ast }\approx 8$
. We call this the mode II response. The response amplitude then drops and remains almost invariant with
 $U^{\ast }$
for the regime
 $10\le U^{\ast }\le 12$
, which closely corroborates the plateau branch for the 1-DOF VIV response of a non-rotating sphere at higher reduced velocities (Govardhan & Williamson Reference Govardhan and Williamson2005; Sareen et al. Reference Sareen, Zhao, Sheridan, Hourigan and Thompson2018). The streamwise rotating sphere also reveals a synchronised response for all
 $\Omega _{x}$
and exhibits persistent large-amplitude oscillations up to the largest value of
 $U^{\ast }$
that has been considered.
Functional dependence of the time-mean cross-stream displacement of the sphere (
 $\overline {Y}/D$
) with
 $U^{\ast }$
for the two rotation rates is shown in figure 6. We have obtained a theoretical estimate of
 $\overline {Y}/D$
by assuming a synchronised periodic wake state of the sphere with
 $C_{y}=(\overline {C_{y}})_{\textit{VIV}}+A\sin (\omega \,t)$
and
 $y(t)=\overline {Y}+B\sin (\omega \,t+\phi )$
. Here,
 $A$
and
 $B$
are the amplitudes,
 $\phi$
is the phase angle,
 $\omega$
is the frequency,
 $(\overline {C_{y}})_{\textit{VIV}}$
is the time-average lift coefficient of the sphere undergoing VIV and
 $\overline {Y}$
is the time-average cross-stream displacement. On substituting
 $C_{y}$
and
 $y(t)$
in (2.3) and by time averaging over a cycle, we obtain an expression for the time-average synchronised periodic displacement of the sphere
 $Y=\overline {Y}_{\textit{VIV}}/D=3(\overline {C_{y}})_{\textit{VIV}}U^{\ast 2}/(16m^{\ast }\pi ^2)$
. In figure 6, we have compared our results with the numerical and estimated
 $\overline {Y}/D$
data of Rajamuni et al. (Reference Rajamuni, Thompson and Hourigan2018b
) for
 $Re=300$
. We observe that the predicted and computed values of
 $\overline {Y}$
in the results of Rajamuni et al. (Reference Rajamuni, Thompson and Hourigan2018b
) align quite closely. We see that, for a streamwise rotating sphere, rotation has no effect on
 $\overline {Y}/D$
for increasing
 $U^{\ast }$
. Irrespective of rotation rates, the sphere stays almost at the initial mean position,
 $\overline {Y}/D\approx \:0$
. This is the same behaviour when the sphere does not undergo any rotation. We attribute this to the symmetric cross-stream displacement about the zero-mean position for non-rotating and streamwise rotating spheres.
The dependence of the time-mean cross-stream displacement (y direction) of the sphere
 $\overline {Y}/D$
with
 $U^{\ast }$
for various rotation rates. The dashed line shows the estimated time-mean position of the sphere expressed by
 $Y=\overline {Y}_{\textit{VIV}}/D=3(\overline {C_{y}})_{\textit{VIV}}U^{\ast 2}/(16m^{\ast }\pi ^2)$
. Here,
 $(\overline {C_{y}})_{\textit{VIV}}$
is the time-average lift coefficient of a sphere undergoing VIV. The present results are compared with Rajamuni et al. (Reference Rajamuni, Thompson and Hourigan2018b
) for
 $Re=300$
.

3.1.3. Vortex-induced vibration of a transversely rotating sphere
The Magnus force invariably dampens the sphere response during transverse rotation compared with the streamwise case, where it is absent. The cross-stream amplitude at
 $\Omega _{z}=0.2$
grows over the range
 $3\le U^{\ast }\le 5$
. We name it the mode A regime, marked by the hairpin vortices. The sphere vibrates significantly within this regime with the peak
 $ (A^{\ast }_{y, max}\approx 0.42D )$
lying in
 $5\le U^{\ast }\le 6$
. Thereafter,
 $A^{\ast }_{y}$
monotonically decreases over
 $7\le U^{\ast }\le 12$
. We identify this as the mode B regime, marked by strong upward-deflected hairpins and twisted hairpin vortices. The overall trend of
 $A^{\ast }_{y}-U^{\ast }$
yields a bell-shaped curve and is analogous to that shown by Rajamuni et al. (Reference Rajamuni, Thompson and Hourigan2018a
,
Reference Rajamuni, Thompson and Houriganb
).
At
 $\Omega _{z}=0.2$
, the sphere vibrates appreciably along the transverse direction, reaching
 $A^{\ast }_{z, max}\approx 0.42D$
at
 $U^{\ast }=7$
, followed by a linear decrease in
 $A^{\ast }_{z}$
with increasing
 $U^{\ast }$
. Notably, for
 $U^{\ast }\gt 7$
, the vibration amplitude in the
 $z\hbox{-}$
direction exceeds
 $A^{\ast }_{y}$
across the
 $A^{\ast }_{y}-U^{\ast }$
range, an effect absent in the 1-DOF case, underscoring the unique influence of 3-DOF motion. The transfer of vibrational amplitude from the
 $y \hbox {-}$
direction to the
 $z \hbox {-}$
direction for a transversely rotating sphere undergoing 3-DOF VIV beyond a specific
 $U^{\ast }$
can be possibly attributed to the complex interplay of the Magnus effect and flow dynamics. As the sphere rotates, the Magnus effect generates a lift force perpendicular to both the flow direction and the axis of rotation. This lift force disrupts the vortex shedding in the
 $y \hbox {-}$
direction, suppressing VIV in that plane. However, the unbalanced pressure distribution caused by the Magnus effect redirects energy to the
 $z \hbox {-}$
direction, where the influence of the Magnus effect is weaker, and the sphere experiences less aerodynamic damping. Beyond a critical
 $U^{\ast }$
, this energy transfer intensifies, allowing the sphere to oscillate with greater amplitude in the
 $z \hbox {-}$
direction while the
 $y \hbox {-}$
direction oscillations remain suppressed. This dynamic coupling between the rotationally induced lift and the flow-induced forces leads to an anisotropic distribution of vibration amplitudes across the two transverse directions, where the Magnus effect mitigates motion in one direction while enhancing it in another. An additional implication of the Magnus force causes a decay in
 $A_{y}^{\ast }$
at a higher rotation rate. We observe that
 $A_{z}^{\ast }$
also reduces to a much lower magnitude than
 $A_{y}^{\ast }$
, thus indicating an overall suppression of VIV. At
 $\Omega _{z}=1$
, the VIV response starts for
 $U^{\ast }\ge 3$
in the cross-stream direction, leading to a slightly broader mode A regime. Within this regime, the sphere shows a desynchronised response, with the hairpins shed in the wake undergoing intense reconnections to render a complex wake structure. In contrast, the VIV response along the transverse direction begins at a later stage (
 $U^{\ast }\ge 5$
) and persists over the entire
 $U^{\ast }$
regime. Notably, the response data of Rajamuni et al. (Reference Rajamuni, Thompson and Hourigan2018b
) for
 $\Omega _{z}=1$
show a complete suppression of VIV at
 $U^{\ast }\ge 7$
.
We observe a synchronised response for a transversely rotating sphere at
 $\Omega _{z}=0.2$
over
 $4\le U^{\ast }\le 12$
. However, a slightly desynchronised response is seen at
 $U^{\ast }=9$
. Interestingly, the large-amplitude VIV is not sustained for the
 $U^{\ast }$
range where the frequency response is synchronised, albeit that it appears through a limited span of
 $5\le U^{\ast }\le 6$
. This is because of the Magnus force, which leads to the suppression of VIV. At
 $\Omega _{z}=1$
, the sphere shows lock-in response for
 $3\le U^{\ast }\le 5$
followed by desynchronised vibrations over the regime
 $6\le U^{\ast }\le 12$
. As the rotation rate increases, the large-amplitude oscillation subsides, although the peak VIV occurs at the end of the synchronisation phase. Over the desynchronisation regime, the VIV amplitude decreases with an increase in
 $U^{\ast }$
. We have observed that the variation of
 $f/f_{n}-U^{\ast }$
in the lock-in regime is the same for both spiral and hairpin modes of vortex shedding, while the desynchronised response unveils a complex ring mode (shown later).
When the sphere rotates transversely,
 $\overline {Y}/D$
monotonically increases with
 $U^{\ast }$
owing to the reduced effective structural stiffness. For increasing
 $\Omega _{z}$
, the effect of Magnus force causes an increase in
 $\overline {Y}/D$
as the sphere is dragged towards the advancing side. We observe that, for each
 $\Omega _{z}$
,
 $\overline {Y}/D(U^{\ast })$
data reported by Rajamuni et al. (Reference Rajamuni, Thompson and Hourigan2018b
) overshoot the present result. In a 1-DOF VIV, the sphere is constrained to move only in the
 $y$
direction. Thus, its entire kinetic/vibrational energy is spent only on the
 $y$
-excursion. On the other hand, for a 3-DOF system (present work), as the sphere moves in all three directions, its total kinetic/vibrational energy is shared among them. We now turn to the comparison between the computed
 $(\overline {Y}/D)$
mean position with the estimate
 $(\overline {Y}_{\textit{VIV}}/D)$
based on the periodic synchronised wake state. Although, at smaller
 $U^{\ast }$
, they agree reasonably, the computed mean location departs significantly in the
 $U^{\ast }$
range where VIV is most effective. We attribute this difference to the varying vibration amplitudes in the
 $y$
and
 $z$
directions for transversely rotating spheres, which can lead to corresponding differences in the lift forces along these directions. As a result, neglecting the vibrations in the
 $z$
direction when estimating
 $Y$
may lead to inexact predictions. As the lift force essentially remains invariant with
 $U^{\ast }$
,
 $Y$
appears to surge monotonically with
 $U^{\ast }$
 $ ({\sim}U^{\ast 2})$
. A higher rotation rate lifts the sphere, and it becomes increasingly apparent at larger
 $U^{\ast }$
. However, similarity in the scaling
 $Y\sim U^{\ast 2}$
between the computed and periodic data indicates the importance of the moderate
 $U^{\ast }$
range that refers to the significant structural vibration regime.
3.2. Vortex shedding modes
Figure 7 summarises the vortex shedding modes across
 $U^{\ast }$
for non-rotating, streamwise and transversely rotating spheres. In the non-rotating case, the modes ‘hairpin (HP),’ ‘spiral (SP)’, and ‘twisted hairpin (THP)’ appear over the
 $U^{\ast }$
range. Similar modes are observed for the streamwise rotating sphere at
 $\Omega _{x}=0.2$
, with the SP mode dominant for
 $U^{\ast }\ge 5$
. At
 $\Omega _{x}=1$
, both THP and a new ‘twisted spiral (TSP)’ mode appear for
 $U^{\ast }\ge 6$
. Transverse rotation shows two main modes: HP at
 $\Omega _{z}=0.2$
and ‘ring (RG)’ at
 $\Omega _{z}=1$
. Detailed discussions of each mode and its effect on near-wake structures are included for various
 $U^{\ast }$
.
3.2.1. Vortex-induced vibration of a non-rotating sphere
We have visualised the instantaneous wake structure using the iso-surfaces of
 $Q(=1)$
(Jeong & Hussain Reference Jeong and Hussain1995). Figure 8 shows the vortical structures with
 $U^{\ast }$
for a non-rotating sphere undergoing VIVs. Within the large-amplitude synchronised vibration regime
 $ (5\le U^{\ast }\le 10 )$
, the sphere shows the SP mode of vortex shedding. The wake is characterised by two continuous spiral vortices intertwined with each other and extending
 ${\approx}7D$
downstream. The vortex filament containing the outer spiral appears to evolve from the vortex shed from the sphere’s surface, while the inner filament is attached to the downstream end of the sphere. Rajamuni et al. (Reference Rajamuni, Thompson and Hourigan2019) found that, with 3-DOF motion (for
 $\Omega =0$
), the sphere’s vibration amplitude decreases as it follows a circular orbit, unlike the linear path in 1-DOF motion, resulting in a spiralling wake. The wake pattern at
 $U^{\ast }=11$
shows single-sided shedding of a twisted hairpin-like structure (THP mode), similar to the one found for a stationery sphere (Johnson & Patel Reference Johnson and Patel1999). At
 $U^{\ast }=12$
, the hairpins undergo a strong cross-stream stretching in the near wake and break up into smaller filaments in the far stream.
Overview of the vortex shedding modes as a function of
 $U^{\ast }$
for non-rotating, streamwise and transversely rotating sphere.

The 3-D wake structures of a non-rotating sphere undergoing VIV for various
 $U^{\ast }$
values. The 3-D perspective views of the vortical structures are shown by plotting
 $Q$
criteria with
 $Q=1$
. The instantaneous
 $Q$
structures are visualised at the same dimensionless instant.

3.2.2. Vortex-induced vibration of a streamwise rotating sphere
Figure 9 shows that the wake structures at
 $\Omega _{x}=0.2$
for the mode I response branch
 $(7\le U^{\ast }\le 12)$
strongly resemble those observed for a non-rotating sphere undergoing VIV. However, the spirals’ orientations at
 $U^{\ast }=5$
and 6 differ, with the wake being rotated in opposite directions. In the far wake, the spirals break into smaller helical vortices, particularly noticeable at
 $U^{\ast }=6$
. As
 $\Omega _{x}$
increases from 0.2 to 1, at
 $U^{\ast }=5$
, the wake undergoes twisting in the primary vortex strand in the near wake, resulting in slightly twisted hairpins in both positive
 $y$
and
 $z$
directions. The THP experiences a strong swirl approximately
 $3D$
downstream, and its core becomes significantly distorted, later bifurcating into small-scale filaments in the far wake. For
 $6\le U^{\ast }\le 12$
, the vortical structures resemble a TSP, with neighbouring spirals deformed such that they become antiparallel. In the downstream, their interaction induces small-scale structures. Additionally, for
 $10\le U^{\ast }\le 12$
, vortex rings coil after generation, inducing an axial flow in the core. As the rings propagate, they continuously stretch, leading to large-scale shedding patterns with small-scale vortex filaments.
The effect of
 $U^{\ast }$
on the wake vortex topology past a streamwise rotating sphere undergoing VIV for rotational speeds of
 $\Omega _{x}=0.2$
and
 $\Omega _{x}=1$
. All 3-D perspective views of the vortical structures are shown by using the
 $Q$
criteria with
 $Q=1$
. Here, the instantaneous
 $Q$
structures are shown at the same dimensionless instant.

In figure 10, we show the temporal evolution of the vortex street by the isosurface of
 $Q=1$
in a complete shedding cycle at
 $\Omega _{x}=0.2$
, and a moderate
 $U^{\ast }=9$
. The evolution of vortices for instances
 $(a-h)$
is shown on the time series of sphere displacements (
 $x, y, z$
) in the insets. At
 $\Omega _{x}=0.2$
, two counter-rotating parallel vortex filaments form simultaneously at the top and bottom of the sphere by accumulating the shear layer shrouding the sphere. The sphere, primarily vibrating along the
 $y$
and
 $z$
directions (see insets), causes the filaments to form spirals as they evolve from initial horizontal conditions. Relative angular rotation in the streamwise direction prompts the filaments to wrap around in the far wake, deforming due to writhe and twist conversion (Yao, Yang & Hussain Reference Yao, Yang and Hussain2021). The bottom filament, having a weaker core, deforms earlier, generating small-scale filaments that are shed downstream.
The vortex shedding cycle shows 3-D perspective views visualised by
 $Q=1$
surfaces at
 $U^{\ast }=9$
and
 $\Omega _{x}=0.2$
. The time evolution of the vortices from the sphere is shown in the instances (a–h) indicated in the time series of
 $x$
,
 $y$
and
 $z$
in the insets.

3.2.3. Vortex-induced vibration of a transversely rotating sphere
Transverse rotation of the sphere leads to hairpin formation by peeling the shear layer due to the dominance of squeezed vortex structures on the advancing side and torn structures on the opposing side. In figure 11, within the mode A regime at
 $\Omega _{z}=0.2$
, the near wake exhibits two-sided alternate shedding of hairpins, with their tips engulfed by the legs of previously shed vortices. As the vortices move downstream, the hairpin legs join and convert into rings. The wake exhibits a pronounced upward deflection for
 $7\le U^{\ast }\le 12$
. At
 $U^{\ast }=7, 8$
, hairpins elongate along the positive
 $x$
axis, twist and rotate before travelling downstream under self-induction. They then deform and recede via cross-diffusion. At
 $U^{\ast }=9, 10$
, with a slightly desynchronised response, the wake displays a distinct topology. Due to the sphere’s rotational inertia, one HP sheds along the streamwise direction, while the next sheds along the transverse direction, with its tip pointing towards the positive
 $y$
axis. For
 $U^{\ast }=11, 12$
, the transverse rotation effect dominates over the VIV of the sphere. The rotation-induced Magnus force pushes the structures further up. The hairpins remain attached vertically to the coherent structure shrouding the sphere. Upon detachment, the structure moves higher and decays as the filaments outside the core viscously decay and cross-annihilate.
At the same dimensionless instant, instantaneous 3-D wake structures visualised by the
 $Q$
criteria with
 $Q=1$
as a function of
 $U^{\ast }$
for
 $\Omega _{z}=0.2$
and
 $\Omega _{z}=1$
.

For
 $\Omega _{z}=1$
, the vortex structures mostly experience tearing for
 $U^{\ast }\in [5, 12]$
and the wake has a topology similar to the ‘shear-layer-stable foci’ regime reported in Poon et al. (Reference Poon, Ooi, Giacobello, Iaccarino and Chung2014). At
 $U^{\ast }=5, 6$
, multiple hairpins are observed in the near wake with their tails attached to the sphere’s surface. The stretching and twisting mechanisms significantly alter the vortex loop’s shape into an RG-type structure. This structure later breaks into multiple smaller-scale vortex filaments in the near wake, resulting in a strongly asymmetric wake deflected upward to yield single-sided vortex shedding. The sphere’s higher rotation induces near-wake instability, causing rings to break into threads. These threads bend towards the advancing side of the sphere, reconnecting to form smaller-scale vortex filaments in the far wake. Filaments wrap around the stretched threads, weakening them and leading to finer-scale vortex decay via cross-diffusion, culminating in large-scale shedding. For
 $U^{\ast }\ge 9$
, near-wake structures consist of small-scale stretched threads and reconnected bridgelets (De & Sarkar Reference De and Sarkar2021). Downstream, complex topologies include strongly attached stretched hairpins with entangled legs among locally growing threads.
Wake deflection shown by the instantaneous contours of
 $\omega _{z}$
on the
 $z=0$
plane for
 $\Omega _{z}=0.2, 1$
and at various
 $U^{\ast }$
.

We show wake deflection during transverse rotation of the sphere in figure 12, illustrated by instantaneous contours of
 $\omega _{z}$
on the
 $z=0$
plane for rotation rates
 $\Omega _{z}=0.2$
and
 $\Omega _{z}=1$
across various
 $U^{\ast }$
values. The counter-clockwise rotation of the sphere drags the fluid around its bottom and upward along the back, causing the retreating side’s shear layer to deflect toward the advancing side and interact with the negative shear layer. On the advancing side, fluid flows counter to the sphere’s rotation, leading it to lose momentum and come to a halt rather than deflecting downward. Lower
 $U^{\ast }$
values are associated with greater wake deflection, likely due to the large-amplitude VIV of the sphere. In contrast, increasing
 $\Omega _{z}$
enhances upward wake deflection, causing upstream shedding of vortices at
 $\Omega _{z}=1$
.
The temporal evolution of instantaneous 3-D wake structures visualised by
 $Q=1$
surfaces at
 $U^{\ast }=9$
and
 $\Omega _{z}=0.2$
for the instances (a–h) indicated in the
 $x$
,
 $y$
and
 $z$
time series in the insets in a complete vortex shedding cycle.

The shedding cycle for
 $\Omega _{z}=0.2$
is presented in figure 13. The vortex shedding mode appears starkly different for
 $\Omega _{z}=0.2$
, where the sphere exhibits transverse
 $(z)$
oscillations. During the first half of the shedding cycle, the shear layer surrounding the sphere rolls up from its top to its bottom. The rolled-up shear layers grow in size during successive instants by accumulating peeled-up shear layers separating from the sphere’s surface, evolving into a hairpin vortex structure in stages
 $(b{-}c)$
. After detachment, the hairpin convects downstream with the tip pointing towards the streamwise direction. During downstream propagation, the hairpin legs approach each other through curvature-induced self-induction, forming ring-tail-like structures. During the second half of the shedding cycle, the hairpin initially moves towards the transverse direction. As it progresses downstream, the inward transport of angular momentum by the core causes the tip to tilt, where striping of the vortex core generates new filaments.
3.3. Trigger, intermittency and suppression of transverse mode
Figure 14 shows the plots of time-average drag
 $(\overline {C_x})$
and lift
 $(\overline {C_y})$
coefficients as a function of
 $U^{\ast }$
for various
 $\Omega _{x}$
. We have also shown the force coefficients for a non-rotating sphere undergoing VIV and have compared them with the data of Rajamuni et al. (Reference Rajamuni, Thompson and Hourigan2018b
) at
 $Re=300$
. Beyond the steady flow regime,
 $\overline {C_x}$
jumps to its maximum value and then monotonically decreases with
 $U^{\ast }$
irrespective of rotation rates. However, the sphere experiences higher drag as
 $\Omega _{x}$
increases. The overall trend of
 $\overline {C_x}$
is consistent with the results of Rajamuni et al. (Reference Rajamuni, Thompson and Hourigan2018b
), albeit that their predicted value of
 $\overline {C_x}$
with
 $U^{\ast }$
is higher than our predictions. We have found a synchronised response for a stationary and streamwise rotating sphere. The effect is reflected as zero-mean-time-average lift coefficient
 $(\overline {C_y}\approx 0)$
over the entire
 $U^{\ast }$
range, indicating a symmetric shedding of vortices about the mean position of the sphere. We observe a similar behaviour of
 $\overline {C_y}$
in Rajamuni et al. (Reference Rajamuni, Thompson and Hourigan2018b
), apart from the desynchronised cases where
 $\overline {C_y}\neq 0$
.
The functional dependence of the coefficient of (a) time-average drag
 $(\overline {C_x})$
and (b) time-average lift
 $(\overline {C_y})$
on
 $U^{\ast }$
for a non-rotating sphere
 $(\Omega =0)$
and when subjected to various streamwise rotation rates
 $\Omega _{x}$
. The
 $\overline {C_{x}}$
and
 $\overline {C_{y}}$
data at
 $\Omega =0$
of Rajamuni et al. (Reference Rajamuni, Thompson and Hourigan2018b
) are also compared for
 $Re=300$
.

Figure 15 compares the variation of
 $\overline {C_{x,y}}$
with
 $U^{\ast }$
for the non-rotating and transversely rotating sphere with Rajamuni et al. (Reference Rajamuni, Thompson and Hourigan2018b
). At the beginning of the mode A regime,
 $\overline {C_x}$
shows a discontinuous jump to attain the peak followed by a gradual drop with increasing
 $U^{\ast }$
. An increase in
 $\Omega _{z}$
causes an increase in the drag coefficient. However, the rate of decrease of
 $\overline {C_x}$
is slower in the desynchronisation regime at
 $\Omega _{z}=1$
and becomes almost invariant for
 $U^{\ast }\ge 10$
. We see that
 $\overline {C_x}$
increases appreciably as the rotation rate increases. Again, the overall trend of
 $\overline {C_x}$
complies with the behaviour seen by Rajamuni et al. (Reference Rajamuni, Thompson and Hourigan2018b
), although the sphere experiences higher drag at
 $Re=300$
than
 $Re=500$
. The time-average lift force acting on a stationary sphere undergoing VIV is zero. As the sphere rotates about the transverse axis, the lift force tends to become negative with an increase in rotation rate. This behaviour suggests that the lift force acts in the negative
 $y$
direction for a positive (counterclockwise) transverse rotation. From an inviscid standpoint, such a lift force arises owing to the Magnus force acting on the sphere. The time-average lift force remains almost invariant with
 $U^{\ast }$
, which is in agreement with 1-DOF data of Rajamuni et al. (Reference Rajamuni, Thompson and Hourigan2018b
), although the magnitude of
 $\overline {C_y}$
is higher for the present study.
Variation of the coefficient of (a) time-average drag
 $(\overline {C_x})$
and (b) time-average lift
 $(\overline {C_y})$
as a function of
 $U^{\ast }$
for a non-rotating sphere
 $(\Omega =0)$
and when subjected to various transverse rotation rates
 $\Omega _{z}$
. The corresponding mean force coefficients data of Rajamuni et al. (Reference Rajamuni, Thompson and Hourigan2018b
) are also compared for
 $Re=300$
.

At each
 $\Omega _{x}$
, figure 16 shows the variation of root-mean-square lift
 $(C_{y}^{\prime })$
and transverse force
 $(C_{z}^{\prime })$
coefficients with
 $U^{\ast }$
. Similarly,
 $C_{y,z}^{\prime }$
also shows an analogous jump in their variations beyond the steady regime. Subsequently, a sharp decline in both
 $C_{y,z}^{\prime }$
is observed until
 $U^{\ast }=8$
, which marks their return to the initial values. A comparable trend of
 $C_{y}^{\prime }$
is seen in Rajamuni et al. (Reference Rajamuni, Thompson and Hourigan2018b
), but they reported a higher rate of cross-stream wake oscillations. The wake fluctuation is minimum at
 $\Omega =0$
and is triggered with increasing
 $\Omega _{x}$
. We observe that both
 $C_{y}^{\prime }$
and
 $C_{z}^{\prime }$
are comparable and follow an identical trend. This signifies equivalent modes of wake fluctuations along the
 $z$
direction (as in
 $y$
). Being a 1-DOF study, such bi-directional wake modes are not evident in the above reference, which might indicate the reason for the observed disagreement in fluctuating force coefficients.
The dependence of the root mean squared (a) lift
 $(C_{y}^{\prime })$
and (b) transverse force
 $(C_{z}^{\prime })$
coefficients as a function of
 $U^{\ast }$
for a non-rotating sphere
 $(\Omega =0)$
and when subjected to various streamwise rotation rates
 $\Omega _{x}$
. The
 $C_{y}^{\prime }$
data at
 $\Omega =0$
of Rajamuni et al. (Reference Rajamuni, Thompson and Hourigan2018b
) are also compared for
 $Re=300$
.

The dependence of the root mean squared (a) lift
 $(C_{y}^{\prime })$
and (b) transverse force
 $(C_{z}^{\prime })$
coefficients as a function of
 $U^{\ast }$
for a non-rotating sphere
 $(\Omega =0)$
and when subjected to various transverse rotation rates
 $\Omega _{z}$
. The corresponding
 $rms$
force coefficients data of Rajamuni et al. (Reference Rajamuni, Thompson and Hourigan2018b
) are also compared for
 $Re=300$
.

Figure 17 shows the variation of the root mean squares of the force coefficients with
 $U^{\ast }$
for the transverse rotation cases where the
 $C_{y}^{\prime }$
data of Rajamuni et al. (Reference Rajamuni, Thompson and Hourigan2018b
) are shown alongside the present. We observe that, as the sphere starts to exhibit VIV response, there is a similar jump in
 $C_{y,z}^{\prime }$
, which subsequently drop to their pre-VIV state for
 $U^{\ast }\gt 8$
. This agrees with the trend shown in Rajamuni et al. (Reference Rajamuni, Thompson and Hourigan2018b
). In general, the magnitude of
 $C_{y}^{\prime }$
during the streamwise and transverse rotation of the sphere is comparable, except at
 $\Omega _{z}=0.2$
, where it is much higher. At
 $\Omega _{z}=0.2$
, increased flow fluctuations are observed owing to the fast roll-up of the wall shear layers into the vortices, which results in enhanced cross-stream wake fluctuation. Rotation adds angular momentum to the boundary layer, causing more energetic shear-layer separation and stronger vortices in the wake. Near-wake instabilities amplify fluctuations by breaking vortices into smaller threads that reconnect and decay into fine-scale structures, intensifying lift fluctuations. Notably,
 $C_{y}^{\prime }$
at
 $U^{\ast }=4.0$
appears to be higher than that at
 $U^{\ast }=5.0$
; for this, we have included a comparison of instantaneous wake structures (
 $Q=1$
iso-surfaces) at
 $\Omega _{z}=0.2$
for
 $U^{\ast }=4.0$
and 5 in figure 17(a). At
 $U^{\ast }=4$
, near-wake instability breaks vortices into threads that bend and reconnect, creating small-scale vortex filaments and higher flow fluctuations. At
 $U^{\ast }=5$
, the wake displays regular shedding of ring-type vortices without such bifurcations, resulting in reduced flow fluctuations. In contrast,
 $C_{z}^{\prime }$
is initially smaller than
 $C_{y}^{\prime }$
. However, for
 $U^{\ast }\gt 7$
,
 $C_{z}^{\prime }$
surpasses
 $C_{y}^{\prime }$
across the remaining
 $C_{y}^{\prime }-U^{\ast }$
range, with the effect being more pronounced at
 $\Omega _{z} = 0.2$
. As explained in § 3.1.3, this behaviour is attributed to the Magnus force, which induces the transfer of VIV amplitude in the
 $z \hbox {-}$
direction. The observed wake fluctuations occur mainly normally to the rotational axis. During its transverse rotation, the sphere induces an upward dragging motion on the boundary layer on the retreating side (
 $\delta _b$
), which further trims it. On the other hand, the already thickened boundary layer on the advancing side (
 $\delta _t$
) takes in the dragged layer (
 $\delta _b$
), leading to a continuous boundary layer growth along
 $y$
. This causes a large-scale separation of the
 $\delta _t$
-layer, which is responsible for the increased flutter of the sphere, resulting in a higher
 $C_{y}^{\prime }$
. However, such an effect is absent in the transverse direction, where the fluctuating force component always remains small. At a higher rotation rate, the onset of small-scale structures in the near wake and local pockets of smaller eddies tend to mix the
 $\delta _t$
and
 $\delta _b$
layers, leading to a localised separation process. Thus, not only does the structural response show a dip, but wake fluctuations drop to a minimum, although the Magnus force grows in stature at higher
 $U^{\ast }$
. Thus, one may argue that growth in the Magnus effect with
 $U^{\ast }$
(or rotation rate) is associated with a lighter structural response marked by diminished wake fluctuations.
Suppression of VIV owing to the transverse rotation-induced Magnus force is further substantiated in figure 18 by the time histories of
 $y(t)$
for various
 $U^{\ast }$
at
 $\Omega _{z}=0.2, 1$
, with the corresponding time histories of
 $z(t)$
appended in figure 18(a). It is observed that the amplitude of displacement decays considerably as
 $\Omega _{z}$
is increased. The pressure difference between the advancing and retreating sides drives the sphere to a distant mean cross-stream location (see
 $\overline {Y}$
in figure 6). However, owing to the localised weak separation process (discussed above), the sphere yields a feeble structural response. In the synchronisation regime, the sphere vibrates to saturation at each
 $\Omega _{z}$
, albeit with a smaller amplitude at higher
 $U^{\ast }$
(
 $\approx 0.01D$
at
 $U^{\ast }=10$
). However, the sphere shows intermittent movement in the desynchronisation regime at
 $\Omega _{z}=1$
. Such motion is frequently disrupted by small-scale mixing of
 $\delta _t$
and
 $\delta _b$
layers that tend to eliminate the much-needed pressure difference to sustain a high-amplitude fluttering of the sphere. The notable effect of the Magnus force-induced transfer of vibrational amplitude from the
 $y \hbox {-}$
to the
 $z \hbox {-}$
direction for
 $U^{\ast }\gt 7$
at
 $\Omega _{z}=0.2$
is further substantiated by the time signals of
 $z(t)$
in figure 18(a). As
 $U^{\ast }$
increases beyond 7, the VIV amplitude along the
 $z\hbox{-}$
direction grows, exhibiting symmetric oscillations about the zero-mean value, while the vibrations along the
 $y \hbox {-}$
direction decay progressively. This highlights the dominance of the Magnus force in redistributing the VIV amplitude under transverse rotation.
Time histories of (a) the cross-stream
 $y(t)$
and transverse
 $z(t)$
displacements of the sphere as a function of
 $U^{\ast }$
for
 $\Omega _{z}=0.2$
and (b)
 $y(t)$
with
 $U^{\ast }$
for
 $\Omega _{z}=1$
.

It is found from figure 5 that the normalised response frequency significantly exceeds 1.0 as
 $U^{\ast }$
becomes large, indicating a loss of lock-in, where the response becomes predominantly influenced by flow excitation. This flow excitation may stem from natural vortex shedding around the sphere or fluctuations caused by the imposed rotation. As the rotational speed increases, the resulting loss of lock-in becomes a crucial factor in suppressing VIV. To further demonstrate this, we have computed additional spectra of fluid forces, complementing the force data shown in figures 14–17. Specifically, we have examined the form drag
 $(C_{x,f})$
and viscous drag
 $(C_{x,v})$
coefficients, where total drag
 $C_{x}=C_{x,f}+C_{x,v}$
. Figure 19 shows the dependence of time-average drag coefficients
 $(\overline {C_{x,f}},\;\text{and}\; \overline {C_{x,v}})$
on
 $U^{\ast }$
for varying
 $\Omega _{z}$
, including a comparison with data for
 $\Omega =0$
. It is evident that
 $\overline {C_{x,f}}$
consistently exceeds
 $\overline {C_{x,v}}$
by several magnitudes, emerging as the primary component of fluid forces. A larger
 $U^{\ast }$
is always associated with elevated
 $\overline {C_{x,f}}$
values, which further increase with
 $\Omega _{z}$
. A higher
 $\overline {C_{x,f}}$
suggests intensified pressure differentials due to disrupted flow patterns around the body, which are associated with larger-scale vortical structures. This, in turn, leads to greater flow excitation and a subsequent loss of lock-in.
Effect of transverse rotation on the variation of the time-averaged form drag coefficient
 $(\overline {C_{x,f}})$
and viscous drag coefficient
 $(\overline {C_{x,v}})$
as a function of
 $U^{\ast }$
. Results for a non-rotating sphere are also included for comparison.

3.4. Viscosity-induced separation
We have tracked instantaneous vortex centres in various axial planes to characterise how the local rotation is linked to the vortical structures. For the present 3-D VIV problem, we have extended the experimental vortex centre identification algorithm introduced by Graftieaux, Michard & Grosjean (Reference Graftieaux, Michard and Grosjean2001). We employ a method using the function
 $\zeta _{_{S}}$
(De & Sarkar Reference De and Sarkar2022), which locally evaluates the tendency of pure rotation. The function is defined for a specific point ‘S’, the localised region is
 $M_{\varDelta }$
, which includes a number of computing cells denoted as ‘T’
 \begin{align} \zeta _{_{S}}=\frac {1}{M_v}\int _{M_{\varDelta }}\left \lvert \frac {\boldsymbol{ST}\times \boldsymbol{u}}{\lvert \boldsymbol{ST} \rvert \lvert \boldsymbol{u} \rvert }\right \rvert \,{\rm d}v, \end{align}
where
 $\boldsymbol{u}$
is the velocity vector,
 $|\cdots |$
is absolute magnitude and
 $M_v$
is the volume of the region
 $M_{\varDelta }$
which signifies the local neighbourhood of `S’. Clearly,
 $\zeta _{_{S}}$
reaches close to unity when
 $M_{\varDelta }$
is part of a recirculatory region. Also the closer a localised flow is to pure rotation, the closer
 $\zeta _{_{S}}$
is to unity. Thus, vortex centres can be identified by evaluating the global maximum of
 $\zeta _{_{S}}$
at an instant in a plane. In the present work this procedure is carried out in a number of streamwise planes at every time instant. For a given plane, if
 $(x(t),y(t))$
correspond to the global maximum of
 $\zeta _{_{S}}$
, then the locus of
 $(x(t),y(t))$
results in the trajectory of the vortex centres in that plane. Figures 20 and 21 show the vortex trajectories in different axial planes for the two streamwise rotation rates. The figures are constructed as follows: at a given plane, we use the function
 $\zeta _{_{S}}$
to trace the vortex centres over time, mapping their trajectory as the path of these centres through the plane. We have indicated the possible direction of wake rotation by blue arrows. At various axial planes, the trajectories qualitatively reveal the radial motion of the localised vortices in sync or out of sync with the sphere’s rotation. At smaller
 $U^{\ast }$
, we see that trajectories do not move along a circle and are out of sync with the sphere’s motion. Hence, the wake rotation is decoupled from the rotation of the sphere. However, the core of the vortex at all axial planes settles along the sphere’s mean footprint, marked by the crowding of the vortex centres. We further observe a lack of radial synchronisation of the vortex centres.
Vortex trajectories at different axial planes for various
 $U^{\ast }$
and at
 $\Omega _{x}=0.2$
. The sphere’s location relative to each plane is shown as a solid circle, while the rotational direction of the vortex trajectories is shown in blue arrows.

Vortex trajectories as a function of
 $U^{\ast }$
at different axial planes for
 $\Omega _{x}=1$
. The direction of rotation of the trajectories is indicated by blue arrows and the sphere’s location by a solid circle.

At higher
 $U^{\ast }$
, vortex centres follow circular orbits with an apparent streamwise rotation about the initial wake axis. Near-wake congregation fades away, particularly at
 $U^{\ast }=9$
, where most trajectories move radially. For
 $\Omega _{x}=1$
, fewer vortex centres populate the sphere’s mean footprint, and narrowing trajectories at large
 $U^{\ast }$
suggest enhanced momentum transfer from the sphere to the wake. This may cause efficient rotational energy transfer. Further downstream, rotational speed drops, causing azimuthal separation of vortex centres and reduced fluid mixing. Trajectories show lesser radial spreading as they settle at a smaller radius. In the near wake at
 $U^{\ast }\ge 7$
, multiple azimuthal orbits of trajectories are observed, with hairpin cores synchronising their rotation with the sphere’s motion, resulting in perfectly circular orbits.
Streamwise variations of vortex trajectories at different axial planes for various
 $U^{\ast }$
and at
 $\Omega _{z}=0.2$
, with the location of the sphere as a solid circle.

Vortex trajectories at different axial planes for various
 $U^{\ast }$
and at
 $\Omega _{z}=1$
. The sphere’s location relative to each plane is shown as a solid circle.

In figures 22 and 23, we show the corresponding vortex centres for the two spanwise rotation rates, with the sphere’s location indicated by a solid circle. Trajectories at
 $\Omega _{z}=0.2$
exhibit horizontal wake segregation. As
 $U^{\ast }$
increases, vortex paths segregate vertically, encompassing the sphere’s average footprint. At
 $U^{\ast }=9$
, the hairpin, just after its formation, tilts perpendicular to the axis of rotation with the tip encompassing the maximum concentration of vortex centres oriented along the positive-
 $y$
axis. Downstream, hairpin legs expand, dispersing centres widely. Far-wake diffusion results in hairpin thinning, as evident from a reduced population of vortex centres across the far-stream plane. Greater spanwise mobility is observed at
 $\Omega _{z}=0.2$
. We observe that a stronger
 $\Omega _{z}(=1)$
induces vertical segregation of vortex trajectories. Transverse wake deflection dominates, scattering vortex centres across transverse planes. Regardless of
 $U^{\ast }$
, vortex centres symmetrically align along the
 $\pm y$
axis. Transverse rotation drives the flow along the rotation axis, migrating centres in the negative
 $z$
direction. Trajectories are less influenced by
 $U^{\ast }$
and cluster along the rotation axis on the sphere’s mean footprint. Generally, the wake recedes at higher
 $\Omega _{z}$
, potentially affecting the viscous Magnus effect. In summary, streamwise rotation induces axial wake rotation, while
 $\Omega _{z}$
introduces inhomogeneities, possibly linked to the Magnus effect.
3.5. Periodicity of vortex core and phase slip
The periodicity of the sphere’s vibration for various rotation rates. Variation of the (a) longitudinal periodicity
 $\lambda _{y}^{\ast }=\sqrt {2}y_{rms}/y_{max}$
and (b) transverse periodicity
 $\lambda _{z}^{\ast }=\sqrt {2}z_{rms}/z_{max}$
as a function of
 $U^{\ast }$
. At the inset, line-time reconstruction of the vertical velocity
 $(v)$
along the streamwise direction is shown at a vertical section
 $y=D/2$
for a few selected
 $U^{\ast }$
at each rotation rate. Here, the time evolution of
 $v$
is along the
 $x$
axis while the
 $y$
axis denotes the streamwise direction.

We have computed the periodicity of the sphere response in the cross-stream
 $(\lambda _{y}^{\ast })$
and transverse
 $(\lambda _{z}^{\ast })$
directions, which is defined as (Rajamuni et al. Reference Rajamuni, Thompson and Hourigan2020)
 \begin{align} \lambda _{y}^{\ast }=\sqrt {2}y_{rms}/y_{max},\,\,\,\lambda _{z}^{\ast }=\sqrt {2}z_{rms}/z_{max}. \end{align}
Here,
 $y_{max}$
and
 $z_{max}$
are the maximum amplitudes of the sphere displacement. Theoretically, the closer
 $\lambda _{y,z}^{\ast }$
is to unity the better is the chance of obtaining a periodic response (Rajamuni et al. Reference Rajamuni, Thompson and Hourigan2020) of the sphere during a departure. Figure 24 shows the dependence of
 $\lambda _{y,z}^{\ast }$
on
 $U^{\ast }$
for
 $\Omega _{x,z}=0.2$
and 1. The streamwise variation of the time evolution of the cross-stream velocity along the advancing side of the sphere is shown in insets for a few representative values of
 $U^{\ast }$
. The motion for
 $\Omega =0$
is periodic in
 $y$
and
 $z$
over
 $5\le U^{\ast }\le 10$
, marked by the SP shedding mode. However, a transition from the SP
 $\to$
THP mode for
 $11\le U^{\ast }\le 12$
introduces aperiodicity in the sphere’s vibration, rendering
 $\lambda _{y,z} ^{\ast }\approx 0.5$
. For low streamwise rotation (
 $\Omega _{x}=0.2$
) a periodic response of the sphere is observed for
 $5\le U^{\ast }\le 12$
as
 $\lambda _{y,z} ^{\ast }\approx 1$
. This regime, showing signs of the SP shedding mode, exhibits sustained high-amplitude vibration. We observe a near-periodic vibration for
 $\Omega _{x}=1$
, where the sphere exhibits the TSP shedding mode. However, a marginal departure (
 $\lambda ^{\ast }\approx 0.8$
) is seen for
 $U^{\ast }=4$
with the THP mode and for
 $U^{\ast }\ge 10$
associated with the TSP mode.
At
 $\Omega _{z}=0.2$
, cross-stream vibration is nearly periodic for
 $U^{\ast }\le 5$
. A transition from THP→HP with increasing
 $U^{\ast }$
brings in an aperiodic response. In contrast, motion along the
 $z$
axis is periodic across the entire range of
 $U^{\ast }$
. For this, we appeal to figure 17(b), where
 $C_{z}^{\prime }$
shows diminishing transverse wake oscillation, which hints at possible periodicity in the flow. The periodicity is lost in the RG mode at
 $\Omega _{z}=1$
, yielding
 $\lambda _{y}^{\ast }\lt 0.5$
for almost all
 $U^{\ast }$
. However, owing to the lower levels of oscillation (figure 17) in the
 $z$
direction,
 $\lambda _z^{\ast }$
shows greater signs of periodicity than in the cross-stream direction with increasing
 $U^{\ast }$
. The line-time reconstructions shown in the insets also support the evidence of periodicity obtained directly from the sphere response. Clearly, a horizontal line, corresponding to the time evolution at a point, intersects the wake alternatively at negative and positive values. This indicates periodic and coherent signatures of vortex structures along the streamwise direction for the patterns where
 $\lambda _{y,z}^{\ast }\approx 1$
. We also notice cell broadening with increasing
 $U^{\ast }$
, indicating vortex core flattening due to large-scale deformation. However, in cases where the sphere exhibits aperiodic vibrations
 $(\lambda _{y,z}^{\ast }\lt 0.5)$
, irregular narrow bands of aperiodic cells are observed along the transverse direction.
Space–time reconstruction on the time evolution of instantaneous iso-surfaces of
 $\omega _{x}$
at 0.2
 $\lvert \omega _{x}\rvert _{max}$
at a streamwise section
 $x=5D$
for various
 $U^{\ast }$
and at
 $\Omega _{x}=0.2$
and 1. Each column shows the same
 $U^{\ast }$
, while each row shows the same
 $\Omega _{x}$
.

Figure 25 shows the space–time reconstruction of instantaneous
 $\omega _{x}$
iso-surfaces (20 % of the global maximum) at
 $x=5D$
for different
 $U^{\ast }$
and
 $\Omega _{x}$
, while figure 26 illustrates the corresponding results for
 $\Omega _{z}=0.2$
and 1. At
 $\Omega _{x}=0.2$
and
 $U^{\ast }=5$
, an undisturbed vortex core (in red) rotates counterclockwise, forming a helix. Vortex filaments outside the core rupture along the meridional
 $(x-z)$
plane due to self-stretching (Pradeep & Hussain Reference Pradeep and Hussain2001). For
 $U^{\ast }=7$
, core fluctuations lead to perturbations and eventual break up due to instability self-limiting via overshoot viscous decay (Stout & Hussain Reference Stout and Hussain2016). This mechanism causes thinning of the core while the encircling filaments are sheared. At
 $U^{\ast }=9$
, a periodic helical structure emerges, with core flattening and subsequent rupture of both core and encircling filaments due to self-stretching. At
 $\Omega _{x}=1$
and
 $U^{\ast }=5$
, centrifugal instability induces persistent helical core distortion, leading to core bifurcation. The core helically advances, while outside fluctuations cause encircling filaments to accumulate at the crest due to shear-induced motion. At
 $U^{\ast }=7$
, a variable area stable core forms a helix out of sync with the sphere’s motion, with small-amplitude waves and core thinning. Similarly, at
 $U^{\ast }=9$
, core fragmentation occurs due to enhanced dissipation and diffusion. The propagation wavelength of structures increases with
 $U^{\ast }$
for all
 $\Omega _{x}$
.
At a streamwise section
 $x=5D$
, space–time reconstruction on the time evolution of instantaneous iso-surfaces of
 $\omega _{x}$
at 0.2
 $\lvert \omega _{x}\rvert _{max}$
for the selected
 $U^{\ast }$
values for
 $\Omega _{z}=0.2$
and 1. Each column shows the same
 $U^{\ast }$
, while each row shows the same
 $\Omega _{z}$
.

At
 $\Omega _{z}=0.2$
and
 $U^{\ast }=5$
, the vortex column distorts due to sphere rotation, resulting in a fragmented core. Outer filaments stretch azimuthally and break, forming vorticity patches within. We observe that a higher transverse rotation rate causes faster core tilting, with suppressed VIV yielding low-amplitude fluctuations at
 $U^{\ast }=7$
. Despite core fragmentation, clustered filaments reduce core displacement. At
 $U^{\ast }=9$
, a more stable core with increased VIV suppression is observed, showing transversely oriented fragmented hairpin legs with self-stretched filaments. At
 $\Omega _{z}=1$
,
 $\omega _{x}$
evolution lacks a distinct wave pattern. At
 $U^{\ast }=5$
, encircling filaments induce significant core fluctuations. Filament pairing at the core boundary enhances their circulation, amplifying core perturbations. Conversely, opposite-signed filaments collide, forming dipoles that convect radially outwards due to core expansion. This induces radial and azimuthal vorticity cells, intensifying core instability through the rapid shearing of vorticity elements. Similar core perturbation occurs at
 $U^{\ast }=7$
and 9, with VIV suppression at higher
 $U^{\ast }$
reducing core fluctuations and radial wave expansion.
Instantaneous phase differences
 $\Delta \phi _{y-C_{y}}$
(between
 $y$
and
 $C_{y}$
signals) and
 $\Delta \phi _{z-C_{z}}$
(between
 $z$
and
 $C_{z}$
signals) as a function of
 $U^{\ast }$
for various
 $\Omega _{x}$
. Columns correspond to identical
 $U^{\ast }$
values, while each row shows the same
 $\Omega _{x}$
.

We have calculated phase differences (
 $\Delta \phi$
) between the time signals of
 $y(t)$
and
 $C_{y}(t)$
, as well as
 $z(t)$
and
 $C_{z}(t)$
, to gain further insight into how the space–time evolution of the vortex structure is influenced by the character or vortex formation ‘timing’ (Lu & Dalton Reference Lu and Dalton1996; Khalak & Williamson Reference Khalak and Williamson1999). Phase of a real valued time signal
 $f(t)$
can be obtained by carrying out a Hilbert transform
 \begin{align} \mathcal{H}[f(t)]=\frac {1}{\pi }\int _{-\infty }^{\infty }\frac {f(\psi )}{t-\psi }\;{\rm d}\psi, \end{align}
which converts
 $f(t)$
into an analytic function
 $Be^{i\phi (t)}$
, where
 $B$
is the instantaneous amplitude. The explicit expressions for the phase calculation of both
 $C_{y}(t)$
and
 $C_{z}(t)$
using the Hilbert transform,
 $\mathcal{H}({\cdots})$
, are as follows:
 $\phi _{C_y}=\tan ^{-1} (\mathcal{H}[C_{y}(t)]/C_{y}(t) )$
,
 $\phi _{C_z}=\tan ^{-1} (\mathcal{H}[C_{z}(t)]/C_{z}(t) )$
. Here,
 $\phi _{C_{y}}$
and
 $\phi _{C_{z}}$
represent the phase angles corresponding to the signals
 $C_{y}(t)$
and
 $C_{z}(t)$
. Figure 27 shows the temporal evolution of phase differences
 $\Delta \phi _{y-C_{y}}$
(between
 $y$
,
 $C_{y}$
) and
 $\Delta \phi _{z-C_{z}}$
(between
 $z$
,
 $C_{z}$
) for various
 $U^{\ast }$
and
 $\Omega _{x}$
, while figure 28 provides corresponding details for different
 $\Omega _{z}$
. We have plotted
 $\Delta \phi$
in an unwrapped manner. For
 $\Omega _{x}=0.2$
,
 $\Delta \phi \approx 0$
at
 $U^{\ast }=5$
, indicating an in-phase synchrony (0 rad) in the
 $y$
and
 $z$
directions. However, at
 $U^{\ast }=7$
,
 $\Delta \phi _{z-C_{z}}$
exhibits a slightly asynchronous dynamics compared with
 $\Delta \phi _{y-C_{y}}$
, which maintains perfect phase synchrony. At
 $U^{\ast }=9$
, both
 $\Delta \phi _{y-C_{y}}$
and
 $\Delta \phi _{z-C_{z}}$
remain constant and symmetric about
 $\Delta \phi =0$
, except for a constant phase shift. We observe phase synchrony in
 $\Delta \phi _{y-C_{y}}$
(
 $\approx \pi$
rad) and anti-phase synchrony in
 $\Delta \phi _{z-C_{z}}$
(
 $\approx -\pi$
rad). Intriguingly, for
 $\Omega _{x}=1$
at
 $U^{\ast }=5$
,
 $\Delta \phi _{z-C_{z}}$
remains in phase synchrony for several periods in one mode. Subsequently, a sudden change to another mode around
 $t\approx 180$
corresponds to a switch in the timing of vortex formation (Govardhan & Williamson Reference Govardhan and Williamson2000). The phase-bounded behaviour is lost, and
 $\Delta \phi _{z-C_{z}}$
drifts continually, resulting in an unbounded growth. The dynamics shows ‘phase slips’, representing a loss of synchronisation in phase. We attribute this to the competition of vortex modes, where distinct states coexist at various time intervals, along with instantaneous variations of frequencies and amplitudes (Konstantinidis et al. Reference Konstantinidis, Zhao, Leontini, Jacono and Sheridan2020; Aswathy & Sarkar Reference Aswathy and Sarkar2022). In contrast,
 $\Delta \phi _{y-C_{y}}$
shows complete phase synchronisation. For
 $U^{\ast }=7$
, perfect phase-bounded behaviour is observed, while at
 $U^{\ast }=9$
, synchronisation in
 $\Delta \phi _{z-C_{z}}$
and anti-phase synchronisation in
 $\Delta \phi _{y-C_{y}}$
are evident, differing from the
 $\Omega _{x}=0.2$
case at
 $U^{\ast }=9$
.
In contrast to the streamwise rotation, force coefficients and sphere response differ (see figure 28) in the
 $y$
and
 $z$
directions for transverse rotation. At a small
 $U^{\ast }=5$
, although
 $\Delta \phi _{y-C_{y}}$
shows perfect phase synchronisation,
 $\Delta \phi _{z-C_{z}}$
indicates time-bounded anti-phase synchrony close to
 $-12\pi$
for
 $\Omega _{z}=0.2$
. At a slightly higher
 $U^{\ast }(=7)$
,
 $\Delta \phi _{y-C_{y}}$
grows with time, and the dynamics shows ‘phase slips’, while
 $\Delta \phi _{z-C_{z}}$
retains perfect synchrony. We see a fully phased locked stable dynamics at
 $U^{\ast }=9$
. For higher rotation rate (
 $\Omega _{z}=1$
), the dynamics for
 $U^{\ast }=5$
resembles ‘phase slips’, in
 $\Delta \phi _{y-C_{y}}$
, while
 $\Delta \phi _{z-C_{z}}$
is phase synchronous. For higher
 $U^{\ast }$
,
 $\Delta \phi _{z-C_{z}}$
predominantly governs the dynamics, whereas
 $\Delta \phi _{y-C_{y}}$
shows phase-bounded synchronisation in time. Notably, at
 $U^{\ast }=7$
, a switch in vortex formation timing occurs around
 $t\approx 160$
, while at
 $U^{\ast }=9$
,
 $\Delta \phi _{z-C_{z}}$
reveals visible phase-locking epochs and the dynamics shows ‘phase slips’.
Effect of
 $\Omega _{z}$
on the instantaneous phase differences
 $\Delta \phi _{y-C_{y}}$
and
 $\Delta \phi _{z-C_{z}}$
for different reduced velocities. Each column presents consistent
 $U^{\ast }$
values, while each row pertains to identical
 $\Omega _{z}$
.

3.6. Rotational coupling and motion transition
Rotation of the sphere spreads to the wake, resulting in torsion as the wake retains only a part of it as one moves downstream. To explore this, we compute the angular velocity of the wake vortex,
 $\Omega _{f} (y,z )$
, across transverse
 $(y-z)$
planes at different streamwise positions. For a given streamwise station
 $s$
, the area-averaged angular velocity of vortices at any
 $(y-z)$
plane with area
 $B_{yz}$
is defined as
 \begin{eqnarray} \Omega _s\left (x,t\right )=\frac {1}{B_{yz}}\int _{B_{yz}} \Omega _{f} (y,z){\rm d}B_{yz}. \end{eqnarray}
For any
 $(y-z)$
plane along
 $s$
, we calculate the radius
 $r$
from the mean position
 $M$
(here it is the wake axis) to any point
 $P$
on the plane. The azimuthal velocity at
 $P$
about
 $M$
is determined as
 $u_{\theta }=-v\cos {\theta }+w\sin {\theta }$
, and
 $\Omega _{f} (y,z )=u_{\theta }/r$
. By integrating the angular velocities over
 $B_{yz}$
, we obtain
 $\Omega _{s}$
.
Time-averaged normalised angular velocity variations across different transverse
 $(y{-}z)$
planes as a function of
 $U^{\ast }$
for various (a) streamwise and (b) transverse rotation rates. The insets in (a) display instantaneous
 $Q$
structures for selected cases, illustrating changes in wake rotation direction. The shaded area represents the region where
 $\langle \Omega _{n}\rangle \lt 10\,\%$
.

Figure 29 presents the time-averaged normalised angular velocity,
 $\langle \Omega _n\rangle =\langle \Omega _s (x,t )\rangle /\Omega$
, across transverse
 $(y{-}z)$
planes for two rotation rates and
 $U^{\ast }$
range showing a transition in the wake rotation direction. Instantaneous
 $Q$
structures for
 $U^{\ast }$
on either side of the transition are shown in the insets. The threshold for the unaffected wake region,
 $\langle \Omega _{n}\rangle \lt 10\,\%$
, is indicated in the shaded area. For a given
 $\Omega _{x}$
,
 $\langle \Omega _n\rangle$
drops steadily from the near wake to the far stream, eventually reaching saturation. We observe far-wake saturation for
 $\Omega _{x}=0.2$
, whereas at
 $\Omega _{x}=1$
,
 $\langle \Omega _n\rangle$
saturates earlier in the near wake. For a given
 $U^{\ast }$
, there is no change in sign of
 $\langle \Omega _n\rangle$
along
 $x$
, indicating that the wake is either in-sync or out-of-sync with the sphere rotation. In the near wake, distinguishable large-scale structures, driven by the high angular velocity of the vortices, amplify
 $\langle \Omega _n\rangle$
. Conversely,
 $\langle \Omega _n\rangle$
diminishes in the far stream due to wake instabilities propelled by small-scale structures. They induce mixing and localised fluid motions with pockets of positive and negative vorticity cells with smaller circulation loops. Vortices at all downstream planes exhibit clockwise and counterclockwise motions, cancelling each other, leading to a trivial
 $\langle \Omega _n\rangle$
. We see that
 $\langle \Omega _n\rangle$
drops gradually with
 $U^{\ast }$
, even though the wake still rotates in sync with the sphere. Owing to a larger rotation rate that induces small-scale structures, a drop in
 $\langle \Omega _n\rangle$
with
 $U^{\ast }$
at
 $\Omega _x=1$
becomes visibly insignificant. The insets show a transition from HP
 $\to$
SP mode for
 $\Omega _{x}=0.2$
, and from THP
 $\to$
TSP mode for
 $\Omega _{x}=1$
, aligning with the shift in the wake’s rotation direction. Transverse rotation of the sphere does not promote axial wake rotation, which is evident from figure 29(b) where
 $\langle \Omega _n\rangle (x) \approx 0$
is obtained for all
 $U^{\ast }$
.
The variation of
 $\langle \Omega _{n}\rangle$
with
 $U^{\ast }$
at
 $x=2$
for
 $\Omega _{x}=0.2$
and 1. Insets illustrate
 $y(t)$
time histories for different
 $U^{\ast }$
cases before and after the transition from counterclockwise to clockwise wake rotation for each
 $\Omega _{x}$
, where
 $T=St^{-1}$
.

To gain further insights, in figure 30, we present
 $\langle \Omega _n\rangle -U^{\ast }$
variations at
 $x=2$
for
 $\Omega _{x}=0.2$
and 1. Here, we can detect the
 $U^{\ast }$
at which the wake undergoes the in-sync to out-of-sync rotational transition. Time histories of
 $y(t)$
on either side of the transition are shown in the insets. At
 $\Omega _{x}=0.2$
,
 $\langle \Omega _n\rangle$
drops sharply with
 $U^{\ast }$
, reaching a negative peak before approaching zero at higher
 $U^{\ast }$
. However, at
 $\Omega _{x}=1$
,
 $\langle \Omega _n\rangle$
stabilises for higher
 $U^{\ast }$
, maintaining a constant negative magnitude. The transition from anti-clockwise to clockwise wake rotation occurs at lower
 $U^{\ast }$
for
 $\Omega _{x}=0.2$
compared with
 $\Omega _{x}=1$
. This transition is characterised by a large-amplitude VIV response of the sphere, evident from the higher fluctuations in
 $y(t)$
. When the sphere exhibits a low-amplitude VIV response at lower
 $U^{\ast }$
, the HP and THP modes of wake structure rotate in sync with the sphere. Conversely, during high-amplitude VIV, the SP and TSP modes slip after detachment from the source, leading to alteration in their rotational direction due to the localised motion of the vortices close to the sphere.
In figure 29(a), we noticed a varied penetration of the sphere’s angular velocity into the downstream vortices. We attempt to quantify the axial penetration depth as
 \begin{eqnarray} \langle \Omega _{s} (x=\delta _{f}/D,t )\rangle =\eta \Omega, \end{eqnarray}
where the threshold parameter
 $\eta$
is set to
 $10 \,\%$
. Thus,
 $\delta _{f}$
indicates the downstream distance where vortical structures retain up to
 $10\,\%$
of the sphere’s angular speed. Hence, the sphere’s rotation does not impact on the points within the shaded region in figure 29(a). Figure 31 shows the variation of
 $\delta _{f}/D$
with
 $U^{\ast }$
for
 $\Omega _{x}=0.2$
and 1, which increases steadily with
 $U^{\ast }$
until the transition from counterclockwise to clockwise wake rotation prompts a sudden surge in the penetration depth. This transition
 $(\delta _f/D \approx 20$
) signifies that the rotational inertia of the sphere is felt nearly in the entire downstream wake, as indicated by the SP and TSP modes. The wake attempts to synchronise its rotation with the sphere, leading to a significant twisting of the downstream vortices. This twisting results in the formation of intertwined spiral vortices. Beyond the point maximum penetration, increasing
 $U^{\ast }$
leads to a gradual drop in
 $\delta _{f}/D$
. Noticeably, at the higher
 $\Omega _{x}$
,
 $\delta _{f}/D$
returns back to its pre-transition state. The nature of wake rotation during the in-sync and out-of-sync states is nearly identical at larger sphere rotation. This trend is associated with forming intricate vortical structures in the wake, characterised by multiple bifurcations into small-scale patterns. Consequently, the influence of
 $\Omega _{x}$
on the wake vortical structures is primarily confined to a region proximal to the sphere.
4. Streamwise and transverse rotation effects on 3-DOF VIV at
 $\boldsymbol{Re=300}$

We investigate the influence of streamwise and transverse rotation on the 3-DOF VIV of a sphere at
 $Re=300$
for
 $\Omega _{x,z}= 0.3, 0.5, 1$
and
 $2$
, along with a non-rotating case, by fixing
 $U^{\ast }=6$
(where the sphere exhibits high-amplitude VIV at
 $Re=500$
) with
 $m^{\ast }=2$
. Table 1 compares the response amplitudes and average force coefficients for
 $Re=300$
and
 $Re=500$
. Note that data at
 $Re=300$
are only shown where corresponding
 $Re=500$
data are available. The table shows that the VIV response amplitudes and average force coefficients for the sphere exhibit similar trends at both Reynolds numbers (
 $Re=300$
and
 $Re=500$
). This consistency suggests that streamwise and transverse rotation have a comparable impact on 3-DOF VIV behaviour across these Reynolds number regimes, leading to similar dynamic responses and fluid force characteristics.
Variation of the penetration depth,
 $\delta _{f}/D$
as a function of
 $U^{\ast }$
for
 $\Omega _{x}=0.2$
and 1.

Comparison of response amplitudes and average force coefficients for
 $Re=300, 500$
, at
 $\Omega =0$
and
 $\Omega _{x,z}=1$
.

Figure 32 shows instantaneous vortical structures as a function of rotation rates for
 $Re=300$
. The wake structure of the non-rotating sphere shows the HP mode, characterised by two symmetrical streets of hairpin vortices forming in the wake, consistent with the observations reported by Behara et al. (Reference Behara, Borazjani and Sotiropoulos2011). On the other hand, a streamwise rotating sphere exhibits a SP mode of vortex shedding for all
 $\Omega _{x}$
, except at
 $\Omega _{x}=2$
, where the shed structure transitions to a RG mode. As
 $\Omega _{x}$
increases, wake instability gradually emerges. However, when compared with
 $Re=500$
, we find that the wake maintains similar vortex shedding modes, despite the wake instability reaching a more advanced growth stage (figure 9).
For the transversely rotating sphere the wake shows the HP mode of vortex shedding for all
 $\Omega _{z}$
. Transverse rotation causes the wake to deflect toward the advancing side (the positive
 $y$
direction), with this deflection becoming more pronounced at higher rotation rates. This behaviour aligns with the lift force acting on the sphere’s retreating side (the negative
 $y$
direction), attributed to the Magnus effect. The influence of 3-DOF VIV is particularly evident at
 $\Omega _{z}=2$
, where our results reveal an unsteady wake. In contrast, findings of Rajamuni et al. (Reference Rajamuni, Thompson and Hourigan2018b
) for 1-DOF VIV indicate a steady wake, underscoring the distinct dynamics between these two regimes. The 3-DOF motion generates an unstable wake, with interactions between vortices and shear layers intensifying flow separation and pressure fluctuations. The coupling between axes amplifies disturbances in pressure and velocity fields, resulting in much stronger flow oscillations than in 1-DOF motion. Notably, at
 $Re=300$
, the wake structure bears a resemblance to that of
 $Re=500$
at
 $\Omega _{z}=0.2$
, illustrating the instability growth associated with higher Reynolds numbers (figure 11).
Vortex topology as a function of rotation rates for
 $Re=300$
, using 3-D perspective views of the vortical structures with
 $Q=1$
. Instantaneous
 $Q$
structures are displayed at the same dimensionless time for consistent comparison across different rotation rates.

5. Influence of streamwise and transverse rotation on 3-DOF VIV at
$\boldsymbol{Re=1000}$

Time evolution of instantaneous 3-D wake structures visualised by
 $Q=1$
surfaces for
 $\Omega _{x}=0.2$
and 1 for the instances (a–d) shown in the
 $x$
,
 $y$
and
 $z$
time series in the insets in a complete vortex shedding cycle.

The temporal evolution of instantaneous 3-D wake structures visualised using
 $Q=1$
surfaces for
 $\Omega _{z}=0.2$
and 1, corresponding to four distinct instances (a–d) indicated in the
 $x$
,
 $y$
and
 $z$
time signals in the insets.

To analyse the effect of streamwise and transverse rotation on the 3-DOF VIV in more practical applications, we have performed 3-D computations at
 $Re=1000$
for
 $\Omega _{x,z}=0.2$
and
 $1$
, with a fixed
 $U^{\ast }=6$
(with
 $m^{\ast }=2$
). Figure 33 shows the influence of streamwise rotation on the instantaneous wake structures in a complete vortex shedding cycle for the instants shown in the insets. For
 $\Omega _{x}=0.2$
, the shed structures roll up at each instant into discrete vortices that break apart and do not reattach to the sphere’s surface. The breakdown of these structures does not tend to rotate at the same speed as the sphere. While the attached layer on the sphere continues to rotate, the near and far wake feature small-scale eddies arranged in a large-scale spiral that rotates slowly due to its heavier accumulation of vorticity. We observe that increasing the streamwise rotation rate to
 $\Omega _{x}=1$
does not significantly alter the overall wake dynamics compared with
 $\Omega _{x}=0.2$
. This indicates that streamwise rotation mainly affects smaller-scale vortical structures beyond a certain threshold without substantially changing the large-scale vortex formation and shedding patterns.
For the transversely rotating sphere during a vortex shedding cycle at
 $\Omega _{z}=0.2$
, figure 34 shows a wake pattern similar to that seen for
 $\Omega _{x}=0.2$
. The wake features small-scale structures that wrap around a large-scale bifurcated spiral. In contrast, at
 $\Omega _{z}=1$
, the eddies experience rapid reconnections in the near wake, forming an avalanche of large, tangled 3-D vortex structures that travel downstream. In the far wake, these structures ultimately evolve into ring-like vortices due to core diffusion.
6. Conclusions
We have performed 3-D simulations of a streamwise (
 $\Omega _x$
) and transversely (
 $\Omega _z$
) rotating sphere undergoing 3-DOF VIV at
 $Re=500$
and
 $m^{\ast }=2$
for
 $2\le U^{\ast }\le 12$
. The key outcomes of this study can be summarised as follows.
Higher streamwise rotation promotes early, sustained VIV, while transverse rotation leads to desynchronisation and reduces response amplitude. The vibration amplitude of the sphere remains similar to the non-rotation case for
 $U^{\ast }\le 10$
but diverges at larger
 $U^{\ast }$
. For streamwise rotation, VIV begins at moderate
 $U^{\ast }\approx 5$
, with faster rotation rates leading to earlier onset and sustained oscillations. Transverse rotation reduces the cross-stream amplitude due to the Magnus effect, allowing large vibrations only within a narrow
 $U^{\ast }$
range, while increased
 $\Omega _{z}$
triggers earlier VIV onset but suppresses large amplitudes at higher
 $U^{\ast }$
. The transfer of vibrational energy from the
 $y\hbox{-}$
direction to the
 $z \hbox {-}$
direction at
 $U^{\ast }\gt 7$
, especially at
 $\Omega _z=0.2$
, results in larger-amplitude oscillations in the
 $z\hbox{-}$
direction. Streamwise and non-rotating spheres exhibit synchronised vibrations, while low
 $\Omega _{z}$
causes desynchronisation at moderate
 $U^{\ast }$
. Higher
 $\Omega _{z}$
induces early lock-in, followed by desynchronisation at larger
 $U^{\ast }$
.
Hairpin, SP, THP and RG
modes of vortex shedding. Vortex shedding modes for
 $\Omega =0$
are identified as HP, SP and THP across the entire
 $U^{\ast }$
range, while similar modes are observed for
 $\Omega _{x}=0.2$
, with the SP mode becoming dominant for
 $U^{\ast }\ge 5$
. At
 $\Omega _{x}=1$
, both THP and TSP modes appear for
 $U^{\ast }\ge 6$
, which can be regarded as a unique vortical mode for the streamwise rotating sphere. We primarily observe the HP mode at
 $\Omega _{z}=0.2$
and RG mode at
 $\Omega _{z}=1$
; the latter identifies a transversely rotating wake. The relative difference in wake rotation with the sphere results in circumferential twists, which can be attributed to the accelerated wake transition.
Synchronised responses greatly influence force coefficients. A synchronised response in stationary and streamwise rotating spheres results in a zero-mean-time-average lift coefficient. Higher
 $\Omega _{x}$
causes increased drag, while
 $\overline {C_y}$
stays trivial for stationary and streamwise rotating spheres. Increasing
 $\Omega _{z}$
also raises drag (
 $\overline {C_x}$
) which stabilises for
 $U^{\ast }\ge 10$
at
 $\Omega _{z}=1$
. Wake fluctuation is seen to trigger with
 $\Omega _{x}$
, showing similar trends in both
 $C_{y}^{\prime }$
and
 $C_{z}^{\prime }$
. In the synchronised regime, the sphere vibrates to saturation with smaller amplitudes at higher
 $U^{\ast }$
. On the other hand, in the desynchronisation regime at
 $\Omega _{z}=1$
, the sphere moves intermittently under the influence of the Magnus effect, which causes low-amplitude vibrations.
Streamwise rotation enhances momentum transfer, while transverse rotation induces wake segregation and vortex distortion. An algorithm is developed to track instantaneous vortex centres across axial planes, showing non-circular trajectories at lower
 $U^{\ast }$
due to wake decoupling, while at
 $\Omega _{x}=1$
, fewer centres and narrower trajectories indicate improved momentum and energy transfer. Increased transverse rotation causes horizontal and vertical wake segregation, leading to receding wakes that may affect the Magnus effect. The sphere exhibits periodic responses at
 $\Omega _{x}=0.2$
for
 $5\le U^{\ast }\le 12$
and aperiodic trajectories at
 $\Omega _{x}=1$
, with nearly periodic cross-stream vibrations for
 $U^{\ast }\le 5$
. Temporal reconstruction confirms wake periodicity, while at
 $\Omega _{x}=0.2$
and
 $U^{\ast }=5$
, a stable helical vortex core is observed, which distorts at higher rotation rates, while increased
 $\Omega _{z}$
leads to distorted vortex columns and enhanced circulation without distinct wave patterns.
Streamwise rotation shifts wake from counterclockwise to clockwise at higher
 $ U^{\ast }$
, while transverse rotation leaves axial wake unaffected. At
 $\Omega _{x}=0.2$
and
 $U^{\ast }=5$
, a trivial phase difference
 $(\Delta \phi )$
indicates in-phase synchrony between
 $(y, C_y)$
and
 $(z, C_z)$
signals, while at
 $\Omega _{x}=1$
, occasional ‘phase slips’ occur in
 $\Delta \phi _{z-C_z}$
with increasing
 $U^{\ast }$
. At
 $\Omega _{z}=1$
, vortex formation timing changes around
 $t\approx 160$
for
 $U^{\ast }=7$
, and phase locking with ‘phase slips’ appears in
 $\Delta \phi _{z-C_z}$
for
 $U^{\ast }=9$
. Evaluating wake rotation, the normalised angular velocity
 $\langle \Omega _n \rangle$
decreases along the wake for all
 $\Omega _x$
values, while transverse rotation does not induce axial wake rotation. Near the sphere
 $(x=2)$
,
 $\langle \Omega _n \rangle$
shifts from counterclockwise to clockwise at a lower
 $U^{\ast }$
for
 $\Omega _{x}=0.2$
compared with
 $\Omega _{x}=1$
, showing deeper vortex penetration with increasing
 $U^{\ast }$
until reaching a transition point in wake rotation.
Acknowledgements
The author would like to thank Dr M. Rajamuni of UNSW Canberra for useful discussions.
Funding
The present research was carried out using the funds available through the National Supercomputing Mission (NSM) project DST/NSM/R&D_HPC_Applications/2021/03.36. All the simulations were carried out at PARAM-KAMRUPA HPC facility at IIT Guwahati.
Declaration of interests
The authors report no conflict of interest.
Appendix A. Immersed boundary-based FSI solver for the sphere
Equations (2.1) and (2.2) are solved using an immersed boundary-based technique where the solid–fluid interface is treated as diffused within the scope of a solitary computing cell. A universal equation that blends the momentum conservation equation with the solid velocity with a solid volume fraction is solved for all the computing cells. The volume-integrated version of this equation is written below for the
 $i\rm th$
momentum equation, approximated for a cell with centre
 $P$
, faces
 $f$
and volume
 $V_P$
 \begin{align} (1-\phi _B) & \left [ \frac {u_{i,P}^{n+1}-u_{i,P}^n}{\Delta t}V_P+\tfrac {1}{2}\left( \sum _f F_fu_{i,f}^{n+1}+\sum _f F_fu_{i,f}^n \right) \right . \nonumber \\ & \quad + \left . \frac {1}{2}\left(\sum _f p_f^{n+1} S_{i,f} +\sum _f p_f^{n} S_{i,f} \right) - \frac {1}{2{Re}}\left( \sum _f F_{du_if}^{n+1}+\sum _f F_{du_if}^{n} \right) \right ] \nonumber \\ & \quad + \phi _B \frac {u_{i,P}^{n+1}-u_{i,B}}{\Delta t}V_P=0 \nonumber \\ & \qquad\qquad\qquad\qquad\quad\sum _f F_f^{n+1} =0 .\end{align}
Note that the second-order implicit Crank–Nicolson scheme is used for the time advancement with all spatial terms approximated using second-order volume or surface integrals. The volume fraction,
 $\phi _B$
that measures part of the solid that lies inside a computing cell, seamlessly blends the momentum equation for fluid cells (
 $\phi _B=0$
) with the solid velocity (
 $u_{i,B}$
) for solid cells (
 $\phi _B=1$
). Since the interfacial cells (
 $0\lt \phi _B\lt 1$
) have both effects, the success of this technique grossly depends upon the accurate calculation of
 $\phi _B$
. Moreover, moving boundary problems, such as the present one, demand accurate, fast and robust calculation
 $\phi _B=0$
to retain the object’s shape and obtain a precise time-marching solution.
Non-uniform grid resolution in the three Cartesian directions and the sphere in its mean position are shown. Note that the uniform mesh resolution in the indicated block containing the sphere at all times is given by
 $\Delta x,y,z_{min}/D=1/65$
.

Excellent resolution of the sphere has been achieved using a finer surface triangulation. In (a), we show a side-by-side comparison of the surface triangulated sphere and the zero-level-set surface, indicating excellent object reproduction. Error in volume calculated using the volume fraction field is shown as a time series in (b), showing that the maximum deviation is as small as 0.05 %.

Domain independence test results showing the influence of domain size on (a) the time histories of
 $y(t)$
and (b) the
 $x{-}y$
trajectories for the 3-DOF VIV of a rotating sphere at
 $U^{\ast }=6$
and
 $\Omega _{z}=0.2$
.

As the nonlinear convective term is treated implicitly, flux linearisation is carried out, which yields a diagonally dominant linear system for each velocity component in each flux loop. However, as they arise from a convection–diffusion equation (read the linearised momentum equation), they converge reasonably fast. Thus, although overall numerical stability is achieved at the cost of a few linear systems, an insignificant increase in computational cost is noticed to achieve a stable time-marching procedure. The pressure Poisson equation arising due to the enforcement of mass balance is expected to share the maximum CPU time. All the sparse linear systems are solved using the Biconjugate Gradient Stablized technique preconditioned by a highly scalable block-diagonal version of Stone’s strongly implicit procedure. For more details on the numerical procedures, De (Reference De2018) and De & Sarkar (Reference De and Sarkar2021) can be referred to. Simulations reported in this work have combined consumed nearly 0.3 million core hours.
Appendix B. Mesh structure for moving boundary
A multi-block, non-uniform Cartesian grid has been used to adequately resolve regions near the sphere for a better wake resolution. The sphere is always kept inside a box
 $(1.5D,2D,2D)$
where a refined uniform mesh is used. The box that contains the sphere has a mesh resolution
 $\Delta x/D, \Delta y/D,\Delta z/D=1/65$
, while an equivalent resolution for the surface triangulation of the sphere leads to nearly 25 000 triangles. Figure 35 shows mesh distribution in the three Cartesian directions. To show the relative position of the sphere, it is positioned at its mean location with the refined uniform block indicated with shade. Relative resolution between the fluid domain and the object surface is kept nearly unity (De Reference De2018) to keep the error in volume fraction low. Figure 36(a) shows a side-by-side comparison between the surface triangulated sphere and the zero-level-set surface, appearing identically the same. Since computations of the volume fraction are key to this method, a check on the reproduced object volume (
 $V_{{numer}}$
)
Grid sensitivity test results for four successively refined meshes
 $M_1$
,
 $M_2$
,
 $M_3$
and
 $M_4$
at
 $U^{\ast }=6$
,
 $m^{\ast }=2$
and
 $Re=500$
. Here,
 $\overline {C_x}$
is the time-average drag coefficient, whereas the root mean square of streamwise and transverse forces are,
 $C_{x}^{\prime }$
and
 $C_{y}^{\prime }$
, respectively. The grids in the
 $x$
,
 $y$
and
 $z$
directions are
 $N_x$
,
 $N_y$
and
 $N_z$
and
 $\unicode{x1D6E5}_s$
is the mean length of surface triangles.

Mesh sensitivity test results for four successively refined meshes
 $M_1$
,
 $M_2$
,
 $M_3$
and
 $M_4$
at
 $U^{\ast }=6$
,
 $m^{\ast }=2$
and
 $Re=500$
. Here,
 $A_{y}^{\ast }$
and
 $A_{z}^{\ast }$
represent the response amplitudes of the sphere along the
 $y$
and
 $z$
directions, respectively, while
 $f/f_{n}$
denotes the normalised frequency and
 $\overline {Y}/D$
is the mean displacement. Details of the mesh resolutions for
 $M_1{-}M_4$
are provided in Table 2.

 \begin{align} V_{num}=\sum _i \phi _iV_{Pi}, \end{align}
is necessary. Note that
 $i$
is a computing cell with volume fraction and volume as
 $\phi _i$
and
 $V_{Pi}$
, respectively. In panel (b) of the figure, a typical time series data of the error (with respect to the triangulated volume
 $V_{tri}$
) in reproduced volume,
 $\Delta V=|1-V_{num}/V_{tri}|$
is shown. It is evident that, with the above-mentioned object and mesh resolution, the sphere is always reproduced very accurately, with the maximum error never exceeding 0.05 %.
Aerodynamic force coefficients
 $(\overline {C}_x,\overline {C}_y)$
and vortex shedding frequency (
 $St$
) for flow over a non-rotating sphere at
 $Re=500$
is compared with a few previously reported data. The agreement has been excellent.

Appendix C. Domain and grid sensitivity analysis
To investigate the influence of domain size on the 3-DOF VIV of the sphere, we have conducted a domain independence test using four consecutive domains
 $(x\times y\times z)$
: domain 1
 $(25D\times 12D\times 12D)$
, domain 2
 $(32D\times 16D\times 16D)$
, domain 3
 $(40D\times 20D\times 20D)$
and domain 4
 $(50D\times 24D\times 24D)$
. All domains position the sphere at a distance of
 $5D$
from the inlet plane. For a representative case with
 $\Omega _{z}=0.2$
and
 $U^{\ast }=6$
, the simulation results are presented in figure 37, showing the time histories of
 $y(t)$
in panel (a) and the
 $x{-}y$
trajectories in panel (b). It can be seen that the results from domains 2, 3 and 4 exhibit negligible differences
 $({\lt} 0.5\,\%)$
. However, these minor variations in the sphere’s excursion correspond to a 5–6-fold increase in CPU time for the largest domain size. Hence, to achieve an optimal balance between domain size and computational efficiency, we have selected a domain size of
 $32D\times 16D\times 16D$
in the present research.
Numerical results for the VIV of a non-rotating sphere for
 $4\le U^{\ast }\le 9$
at
 $Re=300$
, and
 $m^{\ast }=2$
are compared with the data reported by Behara et al. (Reference Behara, Borazjani and Sotiropoulos2011). Transverse response amplitude shows the initial and upper branches in (a), while average drag coefficient
 $(\overline {C}_x)$
shows a reasonable departure in (b), normalised vortex shedding frequency
 $(f/f_n$
) agrees well with the reference data in (c). Measures of wake oscillations, depicted in (d) and (e), also exhibit reasonable agreement with the reported data which was obtained using a sharp-interface-based immersed boundary method.

A comparison between the present 1-DOF simulation data and the results of Rajamuni et al. (Reference Rajamuni, Thompson and Hourigan2018b
) at
 $Re=300$
for
 $\Omega _{z}=0.2$
. (a) Variation of
 $A_{y}^{\ast }$
with
 $U^{\ast }$
. (b) Dependence of
 $\overline {C_{x,y}}$
on
 $U^{\ast }$
. The comparison shows satisfactory agreement.

To evaluate the effect of mesh resolution on the solution, we have carried out three tests: VIV of a sphere in an unbounded domain at
 $\Omega =0$
, VIV of the sphere in presence of streamwise (
 $\Omega _x=1$
) and transverse rotation (
 $\Omega _z=1$
) at
 $Re=500$
,
 $m^{\ast }=2$
and reduced velocity
 $U^{\ast }=6$
. Non-uniform Cartesian mesh is used for all the cases, with the sphere kept within a block of refined uniform mesh. We have used four successively finer meshes (
 $M_1,\ldots ,M_4)$
starting with
 $M_1=168 \times 122 \times 122$
and increasing
 $25\,\%$
in each spatial direction while keeping
 $\Delta t=10^{-4}$
. The body resolution (
 $\unicode{x1D6E5}_s$
) is also refined along with the mesh to keep the body and mesh resolution ratio nearly unity. Table 2 reports the body resolution, average drag
 $(C_x$
) and terms of streamwise and transverse forces, while Table 3 provides the corresponding mesh resolution results, detailing the response amplitudes of the sphere along the
 $y(A_{y}^{\ast })$
and
 $z(A_{z}^{\ast })$
directions, the normalised frequency (
 $f/f_{n}$
) and the mean displacement (
 $\overline {Y}/D$
). We have observed a near convergence of data at the finest level, where any further refinement does not improve the solution. A maximum of less than 4 % variation in the predictions between
 $M_2$
and
 $M_3$
is observed with no discernible difference between the two finest levels. However, to achieve a better wake resolution, we have performed all subsequent calculations using the finest mesh,
 $M_4=330 \times 240 \times 240$
, used in the tests.
Appendix D. Comparison test
For the comparison test, we first compared the flow results past a non-rotating sphere at
 $Re=500$
. Table 4 lists
 $\overline {C_{x}}$
,
 $\overline {C_{y}}$
and Strouhal number
 $(St)$
obtained from the present study and the corresponding data from the literature (Roos & Willmarth Reference Roos and Willmarth1971; Morsi & Alexander Reference Morsi and Alexander1972; Sakamoto & Haniu Reference Sakamoto and Haniu1990; Mittal Reference Mittal1999; Tomboulides & Orszag Reference Tomboulides and Orszag2000; Poon et al. Reference Poon, Ooi, Giacobello, Iaccarino and Chung2014; Rajamuni et al. Reference Rajamuni, Thompson and Hourigan2020). The average aerodynamic coefficients and instantaneous wake structure have been observed to agree with the previously reported results. Subsequently, we carried out a series of computations for the VIV of a non-rotating sphere in the range
 $4\le U^{\ast }\le 9$
at
 $Re=300$
and
 $m^{\ast }=2$
, as reported by Behara et al. (Reference Behara, Borazjani and Sotiropoulos2011). The structural and frequency responses, along with the aerodynamic force coefficients, are compared with the reported data in figure 38. The transverse amplitude correctly reproduces the initial and upper branches (a). The wake fluctuation is accurately resolved as the rms of
 $C_x$
(d) and
 $C_y$
(e) compare very well with the data. However, a maximum departure in average
 $C_x$
in (b) is observed to be within 5 % bound. This can be attributed to the fundamental difference in how the object boundary is handled, which has a greater impact on the normal velocity gradient on the surface of the sphere. Unlike the above reference, the present methodology does not demarcate a solid and fluid boundary to minimise the spurious force oscillations arising due to the velocity and pressure discontinuity (Seo & Mittal Reference Seo and Mittal2011) for moving boundary problems. Further, the frequency response of the sphere normalised by its natural frequency yields an excellent agreement (c).
To obtain more confidence in the simulation’s reliability, we have carried out 3-D computations by suppressing 2-DOFs in the code, obtaining results for 1-DOF VIV of a transversely rotating sphere at
 $\Omega _{z}=0.2$
for
 $Re=300$
over the range
 $2\le U^{\ast }\le 12$
. Figure 39 compares the results of
 $A_{y}^{\ast }$
and
 $\overline {C_{x,y}}$
between the current 1-DOF simulation data and those of Rajamuni et al. (Reference Rajamuni, Thompson and Hourigan2018b
). The response of the sphere in panel (a) and the mean force coefficients in (b) show satisfactory agreement with literature results.