1. Introduction
The U.S. multimodal transportation system handled 18⋅6 billion tons of goods valued at 18 trillion USD in 2018. This is equivalent to more than 715 million trucks, 186 million carloads or 12⋅4 million barges (FHWA, 2019). To support expected freight grow of 51% by 2045 (FHWA, 2019), federal legislation calls for multimodal freight planning – a significant distinction from the sole pursuit of highway-oriented freight planning (FHWA, 2017a). In this context, it is imperative to identify future infrastructure needs for highways, rail, water, air and pipelines. Travel demand models (TDM) with freight forecasts are common tools to identify and prioritise transportation infrastructure needs by estimating performance metrics for demand, policy and capacity scenarios. However, because freight components of TDMs were initially developed for truck transportation, they often lack the level of detail needed to evaluate multimodal freight performance metrics. For example, the Arkansas State TDM incorporates road and rail networks, but lacks a waterway network (Alliance Transportation Group, 2015), despite the key role of the Arkansas River in the state economy (Nachtmann, Reference Nachtmann2015). Such imbalanced network representation limits the ability of TDMs to estimate freight fluidity metrics, identify bottlenecks across multimodal supply chains and support infrastructure planning for multimodal facilities such as ports. In the absence of a detailed waterway network, state-of-the-practice freight TDMs cannot assign an accurate number of vessels to the network, preventing a true multimodal comparison of capacity upgrade needs and benefits among roadways (by the addition of travel lanes) and inland waterways (by dredging and/or preventative maintenance at locks).
Due to privacy and confidentiality concerns, data required for freight TDMs, such as spatially disaggregated origin–destination (OD) flows and trip characteristics, are limited for all modes and are especially underrepresented for inland waterways (FHWA, 2017b). Along inland waterways, freight flows distinguished by port OD are not publicly available. Through the Waterborne Commerce and Statistics Center (WCSC), the U.S. Army Corps of Engineers (USACE) collects detailed domestic waterborne traffic movements, which are mandatorily reported by all vessel operators. For cargo movements, the point of loading and unloading of each cargo type is reported (U.S. Army Corps of Engineers, 2018). While the WCSC data is generally regarded as the best among all modal data sets due to the fact that it surveys the complete population (not just a sample), due to confidentiality concerns only a summarised version is publicly released via the Waterborne Commerce of the United States (WCUS), which contains summary statistics on foreign and domestic commerce along U.S. waterways (U.S. Army Corps of Engineers, 2016). The Manuscript Cargo and Trips Data Files, accessible via the WCSC public website, provide movements of cargo at federally authorised ports, harbours and inland waterways in the U.S., including the annual number of trips reported per port and waterway, by direction, vessel type and draft (U.S. Army Corps of Engineers, 2018). In addition, WCSC publishes OD cargo movements at the regional and state level (U.S. Army Corps of Engineers, 2019), but for the purpose of data gathering to support long-range freight planning (e.g., OD volumes/tonnages and trip characteristics), the Manuscript Cargo and Trip Files and regional OD flows are limiting, mainly due to high-level spatial aggregation (e.g. it specifies only three port areas in the entire state and only a single designated OD entry for all shipping activity on the Arkansas River). This work overcomes such limitation by developing a data-driven, transferable map-matching methodology to identify trips on inland waterways based on data collected through automation between ODs located at any node along a detailed inland waterway network.
The recent open availability of historical Automatic Identification System (AIS) data, which tracks vessel locations and timestamps with reporting intervals of just a few seconds, is a promising source to model maritime freight flows. This work develops a detailed inland waterway transportation network and identifies vessel trips and trip-chains by applying network mapping (map-matching) heuristics to AIS data. Map-matching produces complete paths between stops from vessel ping data as a series of connected links. Uniquely, the stop identification procedure contained in the heuristic estimates parameters to distinguish freight stops at ports from delays through locks or stops at mooring or barge fleeting areas. To do so, the novel methodology incorporates AIS data reduction and simplified map-matching techniques that facilitate the application of the proposed methodology to a statewide geographical scale, as demonstrated in the case study. The methods are evaluated with AIS data for 747 miles of navigable waterways in Arkansas, including the McClellan Kerr–Arkansas River Navigation System (MKARNS) and the portion of the Mississippi River along Arkansas's eastern border. The proposed methods are general enough to be transferable to any waterway or port system for which AIS data is readily available. This paper contributes to the body of research in AIS applications by uniquely identifying vessel trips on an inland waterway network, without limitations on trip duration (unlike other works, trips are not ‘reset’ every day), or location (i.e. any node of the network may constitute a trip origin or destination). Moreover, this paper further addresses research priorities and recommendations by the U.S. Committee on the Marine Transportation System (CMTS), such as: coordinate and apply big data analytics to reveal research gaps and inform decision making; couple the newly available vehicle probe data sets with more traditional freight data resources to quantify and contextualise travel times, dwell times, trip counts and other metrics; and create specific MTS system-scale performance indicators that relate to the freight flow network so they may be periodically updated and used for network calibration and validation (U.S. Committee on the Marine Transportation System, 2020).
2. Background
2.1 Multimodal freight planning and TDMs
The projected growth in freight transportation and its importance to the economy require increased effort to improve multimodal freight demand forecasting tools (FHWA, 2017a,b). TDMs identify future system deficiencies based on forecasted activity (demand) and infrastructure (supply) scenarios, supporting the identification of infrastructure needs to estimate freight demand flows and performance measures and guide multimodal planning. Improvements to TDM state-of-the-practice include the consideration of behavioural models to generate activity forecasts and integration of balanced multimodal networks to represent truck, rail and water infrastructure, as elaborated in the following paragraphs.
Depending on their application, TDM techniques range from simplified sketch-planning methods to complex trip- and activity-based approaches (National Academies of Sciences, Engineering, and Medicine, 2012). Trip-based models typically follow a sequential four-step approach: trip generation, trip distribution, mode choice and route assignment (Ortuzar and Willumnsen, Reference Ortuzar and Willumnsen2011). In most cases, TDMs have passenger and freight models, which are combined before route assignment. The conventional four-step TDM is an effective method for determining network flows (when the network is represented). However, trip-based TDMs lack behavioural richness because trips are considered to occur independently rather than as connected trip-chains. Activity-based models (or agent-based models, ABMs) use a disaggregated approach to incorporate relationships between trips, tours and activities through trip-chains (Ortuzar and Willumnsen, Reference Ortuzar and Willumnsen2011). A key step for activity-based models is to generate a synthetic population to represent agents (i.e. individuals, tucks, or vessels) in the study area and to identify the characteristics of their travel activity patterns, in the form of trip-chains. Synthetic populations are generated by using census data and public-use microdata sample (PUMS) files, matching demographic and economic control targets for the base year (Castiglione et al., Reference Castiglione, Bradley and Gliebe2015). Then, agent activity patterns (i.e. trip-chains) are generated.
Research and practice in multimodal freight ABMs and, in particular, waterborne ABMs are limited (SteadieSeifi et al., Reference SteadieSeifi2014). Most ABM efforts have been focused on passenger travel (Čertický et al., Reference Čertický, Drchal, Cuchý and Jakob2015; Chow and Djavadian, Reference Chow and Djavadian2015; Cipriani et al., Reference Cipriani, Crissalli, Gemma and Mannini2020), and those that consider freight are limited in that they focus on truck movements, excluding inland waterway transportation from the scope (Roorda et al., Reference Roorda, Calvacante, McCabe and Kwan2010; Camargo et al., Reference Camargo, Hong and Livshits2017; Oka et al., Reference Oka, Fukuda and Shinohara2020; Stinson et al., Reference Stinson, Auld and Mohammadian2020). One of the reasons for this gap in the literature may be the extensive computing power required to process ABMs, which results in its application to fewer modes and relatively small spatial areas, such as metropolitan organisations (Camargo et al., Reference Camargo, Hong and Livshits2017; Oka et al., Reference Oka, Fukuda and Shinohara2020; Stinson et al., Reference Stinson, Auld and Mohammadian2020). This paper adds to the body of research by developing a novel methodology including AIS data reduction and simplified map-matching techniques that reduce the computational requirements to process large-scale, highly disaggregated AIS data. As demonstrated in the case study, the methodology is successfully applied to a statewide inland waterway system.
The novel methodology identifies and characterises vessel trips and trip-chains on inland waterways, facilitating freight transportation planning efforts. In particular, the proposed methodology allows for the development of synthetic vessel populations and characterisation of associated trip-chains, supporting the development of waterborne ABMs and their integration into multimodal ABMs. For trip-based models, waterborne OD trip matrices can be developed by mining trips from AIS data in the way presented herein. Both trip-based and activity-based models require an accurate representation of the transportation network. However, since TDMs were initially developed for road transportation, state-of-the-practice multimodal freight TDMs have imbalanced representation of mode-specific transportation networks, limiting their ability to accurately identify bottlenecks and impacts on the multimodal transportation system (Alliance Transportation Group, 2015). This work overcomes this limitation by creating a detailed navigable waterway network and map-matching highly disaggregated maritime data. The purpose of this approach is ultimately to enable integration of maritime modes into trip-based or activity-based TDMs.
2.2 Automatic identification system data (AIS)
AIS was originally developed to support real-time navigation operations, including collision avoidance, coastal monitoring and vessel traffic services. Since December 2004, the International Maritime Organization (IMO) has required AIS transceivers to be fitted aboard all passenger-carrying vessels and commercial vessels larger than 300 gross tons on international voyages (IMO, 2019). The AIS transceiver broadcasts AIS messages, which include vessel location, identity and operational status as well as vessel characteristics, such as ship type and dimensions, in real time. These messages are received by other vessels, as well as by receivers in onshore base stations, buoys and other vessels (terrestrial-AIS) and satellites (satellite-AIS). Due to operational constraints, satellite and terrestrial-AIS tend to differ in spatial and temporal resolution. Satellite-AIS provides global spatial coverage (depending on the number of satellites in the constellation) but has lower probability of sustained detection in dense-traffic areas due to the ‘collision’ of AIS messages transmitted by vessels at the same time (Eriksen et al., Reference Eriksen, Greidanus and Delaney2018). In addition, data latency can become an issue due to lapses in visibility between the satellite and the relay station on the ground that receives the messages, resulting in lower time resolution. The spatial coverage of terrestrial-AIS can be constrained by the number and/or locations and working order of onshore antennas but will typically provide better time resolution than satellite data. Terrestrial-AIS provides good tracking capability within the receiving tower antennas’ line of sight, and satellite and terrestrial-AIS systems complement each other when it comes to compiling continuously sampled historical coverage of AIS vessel position reports across large spatial domains (Fernandez Arguedas et al., Reference Fernandez Arguedas, Pallota and Vespe2018).
There are two types of approved mobile AIS stations, Class A and B, which differ in the frequency and number of data fields reported. Commercial cargo vessels are typically equipped with Class A devices (U.S. Coast Guard, n.d.). AIS messages transmitted by Class A devices contain three data categories: position report, vessel and voyage. Position reports include latitude, longitude, timestamp, speed over ground, course over ground, heading and navigation status (e.g. underway using engine, at anchor, not under command, etc.). Vessel features include vessel name, dimensions, call sign and identification numbers (IMO, MMSI). Voyage data may include cargo, draught, destination and estimated time of arrival. While data in the position report is dynamic and automated, vessel and voyage features are static, manually entered fields which often contain substantial errors and omissions (Yang et al., Reference Yang2019). Messages from Class B devices exclude the IMO number, draught, destination, ETA, rate of turn and navigational status. In terms of frequency, Class A transponders broadcast dynamic data every 2–10 s while in transit (frequency varies with vessel speed) and every 3 min when it stopped. Static information is transmitted every 6 min. Class B transponders reporting intervals are sparser, as Class A transmissions have priority, but are roughly every 20 s (Yang et al., Reference Yang2019).
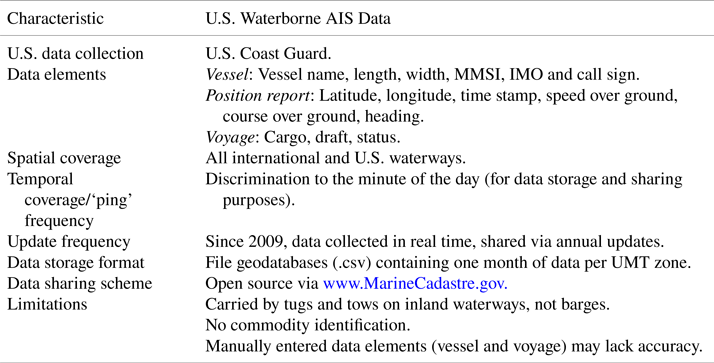
In the U.S. (Table 1), AIS carriage by vessels is required as per Title 33, Code of Federal Regulations (U.S. Coast Guard, n.d.) for all inland waterways. Notably, freight transportation on U.S. inland waterways consists mainly of tugs and tows that push/pull barges (ASCE, 2021) and the AIS transponder is carried by the tug/tow, not by the barges. Historical terrestrial-AIS data within the U.S. (2009–2017) is available for free download from the NOAA OCM (Office for Coastal Management, 2018) as geodatabases. Each file contains point location data at 1-minute interval, per month and UMT zone. Satellite-AIS can be obtained from USDOT (U.S. Department of Transportation, 2020).
AIS data characteristics within the U.S

Note: Valid for terrestrial–AIS messages broadcasted by Class A devices.
2.2.1 AIS data applications and potential challenges in using AIS data for freight planning
In addition to navigation safety (i.e. collision risk assessments and vessel traffic monitoring), AIS data characteristics make it suitable for alternative purposes (Yang et al., Reference Yang2019). For example, researchers and practitioners have been mining AIS data for environmental analysis (oil spills, emissions, ecosystem impacts) (Campana et al., Reference Campana2017; Allen et al., Reference Allen, Yurk, Vagle, Pilkington and Canessa2018), ship behaviour analysis (in restricted waters, fishing activities, etc.) (Vespe et al., Reference Vespe2016; Breithaupt et al., Reference Breithaupt, Copping, Tagestad and Whiting2017; Sheng et al., Reference Sheng2018), trade analysis (Adland et al., Reference Adland, Jia and Strandeness2017; Wu et al., Reference Wu2017) and port and navigation system performance measurement (Mitchell and Scully, Reference Mitchell and Scully2014; DiJoseph and Mitchell, Reference DiJoseph and Mitchell2015; Kruse et al., Reference Kruse2018; Wu et al., Reference Wu, Roy, Hamidi and Craig2020). The use of AIS data for advanced applications such as operational research (e.g. route planning) and freight planning is still expanding (Yang et al., Reference Yang2019).
One of the challenges associated with the use of AIS historical data for freight planning may be coverage (Hammond and Peters, Reference Hammond and Peters2012). Lack of coverage in the AIS dataset used to apply the stop identification and map-matching procedure proposed in this work would result in missing vessel stops and trips. Although broadcast of position and operational status via AIS is required for nearly all commercial vessels, publicly or commercially available datasets may only contain select samples of all AIS records. For instance, some tug and tow operations might not be recorded due to smaller tugs not meeting the AIS reporting criteria (Perez et al., Reference Perez, Chang, Billings and Kosub2009), transmission interference or devices malfunctioning. AIS data coverage may differ by region or port. In the Gulf Coast region, Perez et al. (Reference Perez, Chang, Billings and Kosub2009) compared tug counts by port derived from AIS data with WCUS data, concluding that AIS data accurately represented activity in the biggest port area but overestimated or underestimated activity in smaller port areas, potentially due to the presence of fewer AIS reception antennas. Dobbins and Langsdon (Reference Dobbins and Langsdon2013) generated inland waterway one-day tow-trips from AIS data collected by a single AIS antenna and compared them to lockages reported by the USACE's Lock Performance Monitoring System (LPMS). They found that LPMS lockages occurred three times more than AIS-detected lockages. LPMS records all vessels that traverse each of approximately 200 locks and dams along the U.S. inland waterways, constituting a valuable source of data to evaluate coverage of AIS. Historical lockage data (1993–2017) is openly available in the U.S. Army Corps of Engineers public lock reports (USACE Digital Library – Public Lock Reports). For our work, we performed a coverage analysis of the AIS dataset by comparing it with LPMS lockages. We found that AIS-based traces represented an 88% of the population of vessel traces recorded at locks by LPMS. This means that the AIS data used for the case study is adequate. Moreover, AIS represents a significantly bigger portion of the population than location tracking data corresponding to other freight modes, such as truck GPS, which in the same study area (Arkansas) and timeframe (2016) represented roughly 10% of the truck population (Diaz Corro et al., Reference Diaz Corro, Akter and Hernandez2019).
2.3 Map-Matching algorithm for network mapping
Map-matching reconstructs the trajectory of a GPS-enabled device on a network, from a series of potentially sparse, noisy position records or ‘pings’ (Jensen and Tradišauskas, Reference Jensen and Tradišauskas2009). Each ping is defined by latitude, longitude and timestamp. Map-matching algorithms iterate through timestamp-ordered pings, associate each ping to a network link based on location proximity and store the series of links utilised by the vehicle (Camargo et al., Reference Camargo, Hong and Livshits2017). A limitation is that, for dense networks, high-frequency pings and large-scale data (i.e. several vehicles), the computation time can be prohibitive. Conversely, low-frequency pings and/or dense networks lead to incomplete path identification and low map-matching accuracy, e.g. many links are traversed between pings. As a result, most map-matching algorithms trade-off between computation time and accuracy (Hashemi and Karimi, Reference Hashemi and Karimi2014).
Within the context of freight transportation, to overcome low-performance issues, Pinjari et al. (Reference Pinjari, Zanjani, Thakur, Irmania, Kamali, Short, Pierce and Park2014) reduced truck GPS pings to 5-min frequencies prior to map-matching (Pinjari et al., Reference Pinjari, Zanjani, Thakur, Irmania, Kamali, Short, Pierce and Park2014). Camargo et al. (Reference Camargo, Hong and Livshits2017) proposed a map-matching algorithm for low-frequency truck GPS data. The algorithm iterates through all pings and identifies stops based on calculated speed, minimum stop time and coverage (length of the diagonal of a bounding box containing all consecutive-stopped pings). Then, the algorithm reiterates through the pings to identify which network links are likely used by the truck along its path. Lastly, a trip is created by computing the shortest path between each pair of consecutive stops, using the links previously identified. The algorithm was applied for ABM in a large metropolitan area to conduct select link, OD and time-of-day analysis, and trajectory visualisation (Camargo et al., Reference Camargo, Hong and Livshits2017). Akter et al. (Reference Akter, Hernandez, Corro-Diaz and Ngo2018) adapted Camargo's algorithm to truck GPS data for a statewide network. Using the map-matching algorithm output, Akter et al. derived truck operational characteristics (stop time-of-day, stop duration, trip length, trip duration and total number of stops in a day) and fed a multinomial logit model that distinguished truck daily activity patterns into five commodity groups (Akter et al., Reference Akter, Hernandez, Corro-Diaz and Ngo2018). This work expands the utilisation of map-matching algorithms to waterway networks by adapting the work of Camargo et al. (Reference Camargo, Hong and Livshits2017).
2.3.1 Trip identification from AIS data
Previous works reconstructed vessel trajectories from AIS data (Dobrkovic et al., Reference Dobrkovic, Iacob and Van Hillegersbarg2018; Sheng et al., Reference Sheng2018; Zhang et al., Reference Zhang, Meng, Xiao and Fu2018; Zhao et al., Reference Zhao, Shi and Yang2018) but were limited either in their ability to match pings to a defined inland waterway network, or in that movements were divided per day, masking the identification of trips. DiJoseph and Mitchell (Reference DiJoseph and Mitchell2015) overcome the latter by applying an algorithm to link time-consecutive AIS records together to generate paths on inland waterways (DiJoseph and Mitchell, Reference DiJoseph and Mitchell2015), but did not fuse generated vessel paths with a defined network. The inability to map vessel data to a network precludes future incorporation and integration of AIS data into multimodal network-based models, such as TDMs. In contrast, the algorithm developed in this work allows for the identification of trips and trip-chains defined by origin and destination (not duration) and matched to a defined network.
3. Methodology
The methodology consists of three steps: (1) data preparation, (2) vessel stop identification and (3) vessel trip and trip-chain identification. All data and tools are open source.
3.1 Step 1-Data preparation
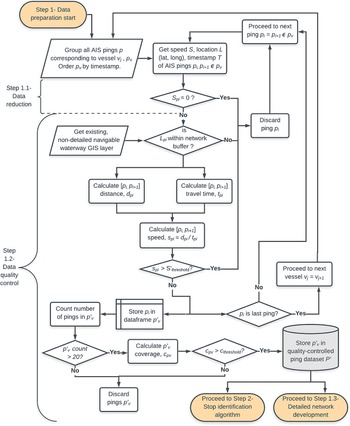
Data preparation (Figures 1–2) involves three procedures: (1) AIS data quality control, (2) AIS data reduction and (3) development of the detailed inland waterway network.
AIS data preparation flowchart

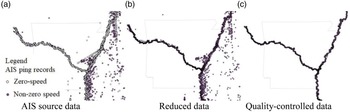
Example of AIS data preparation. (a) AIS source data. (b) Reduced data. (c) Quality-controlled data

3.1.1 Step 1.1 – AIS data reduction
Data reduction is necessary to accelerate ‘big data’ processing. In AIS datasets, records with zero speed outnumber the non-zero speed records (Osekowska et al., Reference Osekowska, Johnson and Carlsson2017) and, depending on the application, removal of zero-speed records provides a mechanism for data reduction. For example, Fujino et al. reconstructed vessel trajectories from a reduced AIS dataset and applied unsupervised machine learning to identify vessel course and issue real-time off-course warnings. The original dataset of 5,756,438 records was reduced by 40% by removing records with zero speed (Fujino et al., Reference Fujino, Claramunt and Boudraa2018). Following this example, in this paper, zero-speed records are removed with no loss of representation of trip characteristics needed for map-matching and stop-identification heuristics. By removing zero-speed records from the AIS dataset, computational time is reduced while still benefiting from highly disaggregated, ubiquitous AIS characteristics.
3.1.2 Step 1.2 – AIS quality control
AIS data contains erroneous or irrelevant records that result from transmission interference and device mishandling. Erroneous records are defined as those with unusual high speed and/or records located outside reasonable waterway boundaries [Figures 2(a) and 2(b)]. Irrelevant records come from vehicles that emitted less than 20 records within the reporting period. After identifying erroneous and irrelevant records as described next, they are removed from further analysis.
To identify erroneous records, first a spatial buffer is created for an approximate U.S. navigable waterway network from the National Transportation Atlas Database (NTAD) (Bureau of Transportation Statistics, 2015), clipped to the study area. The buffer width is derived from the Global River Bankfull Width & Depth Database (‘NARVIS’) (Andreadis et al., Reference Andreadis, Schumann and Pavelsky2013). NARVIS and NTAD are provided as geodatabases. Because the NTAD waterway geometry is inexact, it may not follow observed and valid AIS records. Therefore, a spatial buffer should be established to exclude records grossly outside of the navigable waterways [Figure 2(c)]. A buffer size of two standard deviations from the NARVIS mean width was found appropriate in this work. Records outside the buffer are removed.
Second, a forward sequential search iterates over consecutive AIS records to calculate speed [Equation (1)]. The speed (as space mean speed) is checked against a reasonableness threshold of 27⋅7 km/h (15 knots), based on El-Reedy (Reference El-Reedy2012). By applying the proposed speed threshold, records corresponding to non-freight vessels are discarded:

where
speed = space-mean-speed associated with pings i-1 and i, in km/h
travelled distance = great-circle distance based on position (latitude, longitude) between pings i-1 and i, in km
travelled time = time to travel between pings i-1 and i, in hr
Next, if fewer than 20 records are associated with one vessel, all the records for such vessel are removed. Lastly, spatial coverage of each remaining vessel record is calculated as the diagonal of a bounding box around all of its pings. Vessels with coverage of less than 2 km are removed. The coverage threshold is defined as the minimum distance between different port authorities in the study area, because for the purpose of freight planning it is interesting to observe vessels moving between port areas, not exclusively within.
3.1.3 Step 1.3 – Inland waterway network development
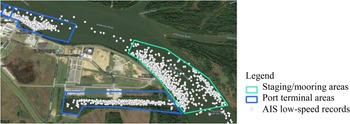
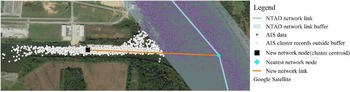
The objective of this step is to create a detailed representation of an inland waterway network as nodes and links on which to map-match the AIS vessel movements. Unlike prior work (DiJoseph and Mitchell, Reference DiJoseph and Mitchell2015), the network is expanded to include nodes representing: (1) connections between links to accommodate geometry and attribute changes; (2) locks; (3) port terminals; and (4) barge staging or mooring areas. To identify (1) and (2), the NTAD (Bureau of Transportation Statistics, 2015) is used. To identify (3), because the NTAD network node layer lacks sufficient detail (several ports are aggregated to single port authorities), it must be supplemented with local data such as state or regional port databases. If local data is not available, a review of open-source aerial imagery should be performed. To identify (4), NTAD cannot be used because it does not specify the location of designated anchorage grounds. Thus, clusters of AIS records corresponding to tugs with low speed but that did not match the location of a port terminal can be used to locate designated or undesignated mooring areas. As a result, ‘staging’ or mooring areas are identified – areas within the waterway where tugs may leave barges to be picked up later. Polygons representing port terminals, mooring areas and locks are drawn to surround clusters of low-speed records observed from AIS data and labelled (Figure 3). While this paper explores the use of AIS data to enhance an existing network, as an alternative electronic navigational charts (ENC) may be used, for example, to identify designated anchorages/moorings. ENCs for U.S. inland waterways are developed by USACE and may be downloaded from https://ienccloud.us/
Sample staging/mooring and port terminal areas

The waterway line layer used as a basis to develop the detailed network is also obtained from the NTAD. Since the NTAD port layer is supplemented with additional port and non-port nodes, it is necessary to edit the NTAD waterways line layer to accommodate these ‘new’ nodes. Next, AIS data is used to identify potential missing links and accommodate the network representation to the path followed by vessels (Figure 4). First, pings outside a buffer of the NTAD waterway line layer are selected. Buffer size is the NARVIS mean river width (Andreadis et al., Reference Andreadis, Schumann and Pavelsky2013). Second, clusters of pings outside the buffer are identified. Third, for each cluster, the closest node to each cluster centroid is found. Identified nodes are connected to the cluster centroid with a new link. Lastly, the modified waterway line layer is subject to a GIS plugin to generate a routable network model (Anon., 2018) with link ‘cost’ determined from link length. Attributes added to the network link layer include length (miles) and travel time (hours). Transit travel time is calculated based on the link length and on the average speed obtained from the AIS dataset, except for links representing locks, were a ‘lockage transit travel time’ is obtained from the annual average processing time provided in the LPMS (U.S. Army Corps of Engineers, USACE Digital Library – Public Lock Reports). The calculation of the average vessel speed considered all the AIS records within the reduced AIS dataset.
Detailed navigable waterway network development

3.2 Step 2 – Stop identification
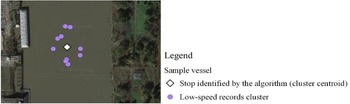
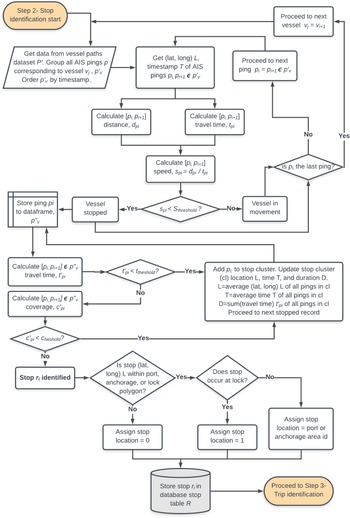
The purpose of this step is to identify and characterise stops made by vessels using an automated stop identification algorithm modified from Camargo et al. (Reference Camargo, Hong and Livshits2017). For AIS records, zero- and low-speed position records may both correspond to stops, and many zero- or low-speed position records found in close geographic proximity typically correspond to the same stop, rather than to several unique stops. Even though each position record includes a point-speed estimate, point speeds may not be reliable due to transmission issues and thus cannot not be used alone to define a stop. Instead, the stop identification algorithm evaluates consecutive series of position records to discover ‘stop clusters’ (Figure 5). Each stop cluster is defined by a stop time (the average timestamp of all pings within the cluster), duration, position (the centroid of the cluster) and location (e.g., at a port, lock, mooring or other area). in Figure 6 shows the stop-identification algorithm from AIS data.
Stop cluster example

AIS stop identification flowchart

The parameters within the stop identification algorithm that identifies stop clusters are: calculated speed, minimum time stopped (i.e. stop duration) and maximum stop coverage. The geospatial stop coverage parameter represents the length of the diagonal of a bounding box containing all consecutive-stopped records.
To define values for algorithm parameters, manual verification of stop locations within port areas is performed for a sample of AIS records. Parameters are iteratively calibrated to achieve acceptable performance measured in terms of precision [Equation (2)], e.g. the number of correctly identified stops at ports (true positives) relative to the total number of identified stops at ports (true positives and false positives). By using precision as the performance metric for algorithm calibration, the occurrence of correctly identified stops is maximised while reducing the occurrence of ‘duplicated stops’. Duplicated stops are defined as two (or more) timewise consecutive stops occurring at nearby locations that in reality should be clustered into a single stop. Precision considers both true positives (TP, stops correctly identified by the algorithm) and false positives (FP, stops that the algorithm incorrectly identified as a stop, or duplicated stops). Details regarding parameter estimation and performance are presented in the case study section.

where
True Positives (TP)= number of stops correctly identified by the algorithm
False Positives (FP)= number of stops that the algorithm incorrectly identified as such, or duplicated stops
3.3 Step 3 – Trip identification
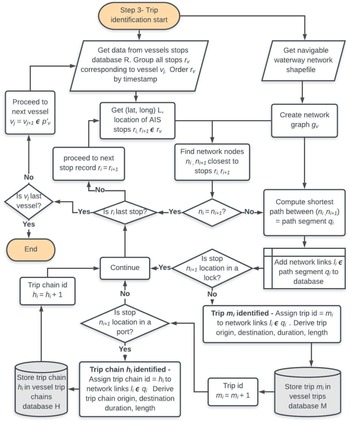
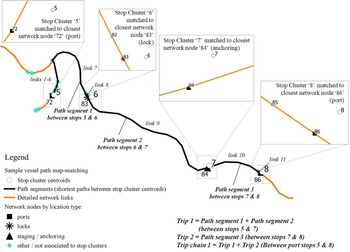
The purpose of this step is to reconstruct vessel trajectories as complete and connected paths defined by network links and nodes using map-matching heuristics and define individual freight trips and trip-chains by origin and destination (Figure 7).
AIS trip identification flowchart

3.3.1 Step 3.1 – Vessel path identification and network map-matching
To reconstruct vessel trajectories defined by network links and nodes using map-matching heuristics, the map-matching heuristic developed by Camargo et al. (Reference Camargo, Hong and Livshits2017) was adapted as follows (Figure 8). For each vessel, first stop cluster records are associated with a network node by proximity. Second, the complete path of the vessel is reconstructed by assuming that the vessel takes the shortest path between pairs of timewise-consecutive stop clusters associated with different nodes. For highway applications, the later assumption can be a challenge to meet, given dense highway networks with many competing ‘shortest’ paths. The algorithm by Camargo et al. accounted for this by limiting the shortest path links to those that comprised the reduced set of network links associated with pings. However, for inland waterway networks, there are relatively fewer nodes and links from which to reconstruct a shortest path between stops. Therefore, the map-matching algorithm can be simplified by finding the shortest path between stop clusters without the need to look at a reduced link set. The approach of searching for shortest paths between stop clusters and not between all pings thus serves to increase computational efficiency without reducing path identification accuracy.
Map-matching and trip characterisation algorithm for a sample vessel

Ultimately, the map-matching algorithm produces a sequence of shortest paths (‘path segments’) that constitute the complete paths made by all vessels. Path segments are represented as the series of nodes of the network visited by each vessel between each pair of consecutive stops, the time when the vessel arrived and left each node and the associated network link connecting consecutive nodes.
3.3.2 Step 3.2 – Vessel trip characterisation
Following the map-matching procedure vessel paths are defined by OD so that individual trips and trip-chains can be characterised. Trip characteristics do not include cargo volumes, commodity types or even whether any barges (empty or otherwise) were actually transported. However, ODs are defined as freight ports and a distinction is made between freight stops (pick-up or delivery) at ports and stops due to lockage, mooring and other non-freight activity. Along a vessel path, stops at locks are mandatory, traffic-related (equivalent to a truck stopping at a traffic light) and irrelevant for characterising freight activity as purposed in this paper. Thus, trips are defined as the combination of successive path segments that share a lock as an intermediate stop. For example, in Figure 8, network node 83 (associated with stop cluster 6) represents a lock; so, path segments 1 and 2 are combined into a single trip with nodes 72 and 84 as origin and destination. As such, vessel trips are based on the time and location of their stops that constitute trip origins and destinations, regardless of the duration of the trip, as was assumed in prior work (Dobbins and Langsdon, Reference Dobbins and Langsdon2013). Once trips are defined, trip characteristics such as trip length (in miles) and duration (in hours) are derived by aggregating the length and transit time of all the links comprising the trip. Other trip characteristics include: trip origin and destination nodes and location (e.g., port, staging/mooring, lock and other non-port).
Next, to identify trip-chains, trips are combined for cases of potentially non-freight ODs. For ODs found to be non-ports (mooring areas and other network nodes), the consecutive trips are combined such that the stop at the non-port becomes an intermediate stop (not an origin or destination) in the trip-chain (Figure 8). All nodes in the network should be predefined as ports or non-ports so that identification of intermediate stops is facilitated.
4. Case study: Maritime freight activity analysis in Arkansas
4.1 Scope and data
The map-matching methodology was evaluated using terrestrial-AIS data observed at the MKARNS and the portion of the Mississippi River along Arkansas's eastern border for the year 2016. The study area has more than 20 AIS antennas. In total, 7,803,151 AIS records broadcasted with a 5-min frequency by 776 vessels were extracted from NOAA OCM data (Office for Coastal Management, 2018) [Figure 2(a)]. One hundred sixteen of the 776 vessels were observed within the MKARNS, while the remaining 660 vessels were observed within the Mississippi River (and did not use the MKARNS). Of these records, 53% corresponded to zero-speed records, which were removed [Step 1.1, Figure 2(b)]. The quality control process (Step 1.2) excluded 518,697 position records from the dataset. As a result, 3,398,279 AIS records (44% of the original sample) were subject to the map-matching procedures [Figure 2(c)].
The data used for this work constituted a sample of the population of vessels traveling on Arkansas waterways during 2016. Thus, a coefficient of coverage was calculated by comparing unprocessed AIS traces with LPMS data. The reduced AIS data sample represents 88% of commercial vessels operating on the MKARNS during 2016. Coverage varies per lock, possibly indicating that the AIS sample excluded more vessels observed in the proximity of the locks where a lower coefficient of coverage was found, i.e. the Oklahoma portion of the MKARNS.
The development of the detailed inland waterway network (Step 1.3) was complemented with geospatial data from the Arkansas Economic Development Commission GIS office. Only port terminals located on the MKARNS were considered, resulting in 43 unique freight port terminals and 11 staging/mooring areas. The travel time on waterway network links was based on an average vessel speed of 4⋅76 mph, derived from the reduced AIS dataset.
4.2 Stop identification and map-matching parameter calibration
Tuneable parameters within the stop identification and map-matching algorithms were calibrated against a manually verified dataset generated by the authors. Since this case study concerns on freight activity in Arkansas, the manual validation was focused on the Arkansas portion of the MKARNS. Notably, the only manual step in the process is the creation of the labelled sample of vessel stops from the AIS reduced dataset, where the label indicates the stop location. Using a random stratified sample of eight vessels from the 2016 AIS records, 4869 stops (3820 trips across 352 days) were manually identified by comparing vessel position records to aerial imagery. The stratified random sample considered: number of pings (less than 15,000; 15,000–30,000; and more than 30,000), expanded time coverage (less than 3 months; 3–9 months and 9–12 months) and frequency of presence at ports (less than 20, 20–30 and more than 30 ports visited). Stops were manually identified based on the position record spot speed (speed = 1 corresponded to a stop), location of the stop and characteristics (speed, position) of prior and subsequent stops. In particular, we counted the number of unique stops made by each vessel and classified them by location. To classify stops by location, each of the port terminals, staging areas and locks within the Arkansas portion of the MKARNS received a unique identifier code, used as stop label. All other stops (including stops at ports not located in MKARNS, such as ports in the Mississippi River) received a location code ‘0’. With the manually validated data, sample parameters were calibrated using a partial combinatorial search heuristic within the ranges expressed in Table 2. The search over the parameter space continued until model performance (precision) no longer improved. More than 40 combinations were evaluated; the combination of parameter values which gave highest precision was selected. The calibrated parameters showed a precision of 84% at ports, 85% at locks and 74% at staging/mooring areas within the Arkansas portion of the MKARNS. The overall precision (i.e. stops at all location types within MKARNS) was 81%. In addition, the calibrated parameters produced the fewest duplicated stops (16%), as defined in Step 2 of the methodology.
Stop identification parameters

4.3 Results
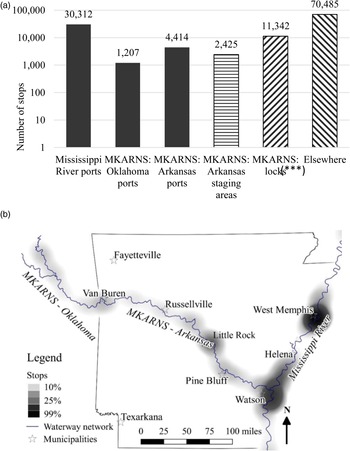
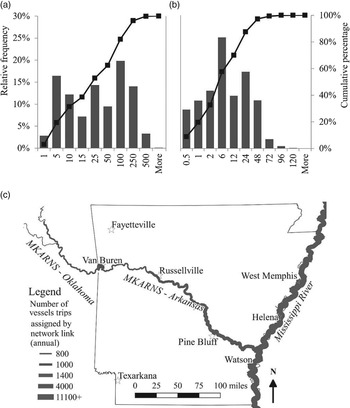
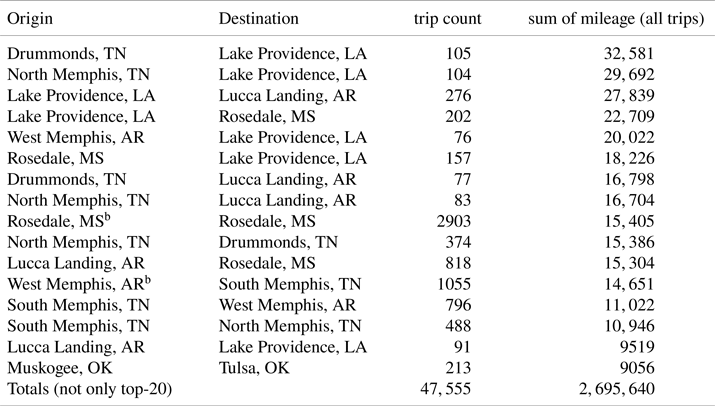
The stop identification algorithm identified 120,185 stops for the 3⋅4 million AIS position records, of which 24% were on the MKARNS and 75% on the Mississippi River (Figure 9). The subsequent map-matching algorithm identified 47,555 trips (Figure 10) and 31,359 trip-chains. The average number of annual trips per vessel was 63, with a mean and median trip length of 56⋅7 and 20⋅0 miles, respectively, within a range of 0⋅2 to 1085 miles, and a mean and median duration of 10⋅5 and 3⋅8 h, respectively, with a range of 1–214 h. Vessel trips of shortest length and duration likely correspond to movements of tugs between docks and mooring areas within a given port [e.g. Rosedale, MS, and between West and South Memphis, TN (Table 3)] and to support construction occurring during 2016, e.g. Broadway Bridge in Little Rock, AR. The corridors with longer miles travelled during 2016 were on the Mississippi River and are summarised in Table 3.
Stop identification results from AIS data. (a) Number of stops per location type. (b) Heat map of stop locations

Trip identification results from AIS data. (a) Trip length distribution (miles). (b) Trip duration distribution (hours). (c) Trips assigned to the navigable waterway network

Top corridors by distance travelled by all trips, 2016a

a Only top corridors with more than 75 trips are shown.
b Likely barge relocation between docks and mooring areas within a given port.
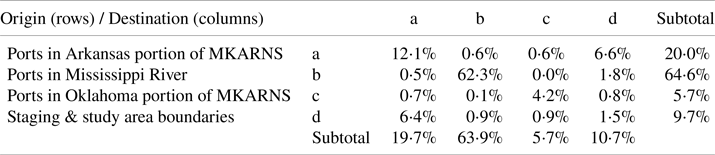
Table 4 summarises notable trends in the origin and destination of tug trip-chains identified with this approach in the study area during 2016. The majority of trips (62⋅3%) had origin and destination in ports located at the Mississippi River, followed by trips with origin and destination in the Arkansas portion of the MKARNS (12⋅1%). Only a few tug trips (1⋅4%) travelled between the MKARNS and the Mississippi Rivers, with the majority of these (1⋅1%) observed south of the junction, and the remaining transiting north of the junction. The main corridor covered by the trips passing through the MKARNS–Mississippi River junction cover the corridor Rosedale Port, MS, a staging area located near Pendleton, AR. Further insight showed that only 3⋅3% of trips crossed the study area boundaries (0⋅4% entered and 2⋅9% exited).
Origin-destination matrix, 2016 (percentage of port-to-port trips, i.e. trip-chains)

The data was processed in 485 min using a computer with Intel® Core™ i7-8700 processor (3⋅20 GHz), 32GB RAM, Microsoft Windows 10, 64-bit operating system. Open-source software was used: Python, PostgreSQL for database management and Quantum GIS (QGIS) for geoprocessing and visualisation.
4.4 Model validation
For validation, the trip paths identified by the model (i.e. processed AIS data) on the MKARNS were compared to LPMS data (i.e. trip lockages) [Equation (3)] following (Dobbins and Langsdon, Reference Dobbins and Langsdon2013):

where
V = model evaluation metric,
Processed AIS data lockages = annual number of tugs observed from the processed AIS data (trips) in transit through each of the locks in the study area and
LPMS data lockages = annual number of commercial vessels reported by LPMS for the same locks during the same time period (U.S. Army Corps of Engineers, USACE Digital Library – Public Lock Reports)
To estimate the Processed AIS data lockages, trip geometries of tugs/tows that intersected locks (represented by screenlines) were counted as vessels in transit through the lock. Validation results show that the model is capable of correctly identifying 83⋅5% of trip lockages, with a range of [65⋅6%–96⋅6%] by lock. This validation is limited in that it only considers the trips that crossed a lock, thus excluding trips on the lower Mississippi River (where there are no locks). Future work to overcome this limitation may consider traffic cameras and other data sources for validating AIS-derived trips.
Algorithm precision likely varies as a result of: (1) the AIS dataset where the model is tested represents 88% (not 100%) of the vessel activity in the area, (2) the random stratified sample of vessels used to train the model constitutes only 1% of the vessels in the dataset and (3) it is observed that a single set of stop identification algorithm parameters does not provide a best fit for all verified vessel trips.
5. Discussion
The map-matching method presented in this paper recreates vessel trips from AIS position records by first identifying the location of freight delivery stops that constitute trip ODs and then connecting those stops as complete consecutive series of inland waterway network links. Matching of vessel trips to a robust inland waterway network allows for further integration into multimodal STDMs, which typically fall short in their representation of non-truck modes.
5.1 Transferability
Since AIS data is available worldwide and for various time periods (past and present), the proposed methodology has potential for spatial and temporal transferability. Tuneable parameters within the stop identification and map-matching heuristics, such as stop duration, speed and spatial coverage, are calibrated using verified vessel trajectories. It is possible that for other regions and time periods, waterway geometry and vessel operational characteristics may differ and, thus, tuneable parameters should be recalibrated.
5.2 Sensitivity analysis
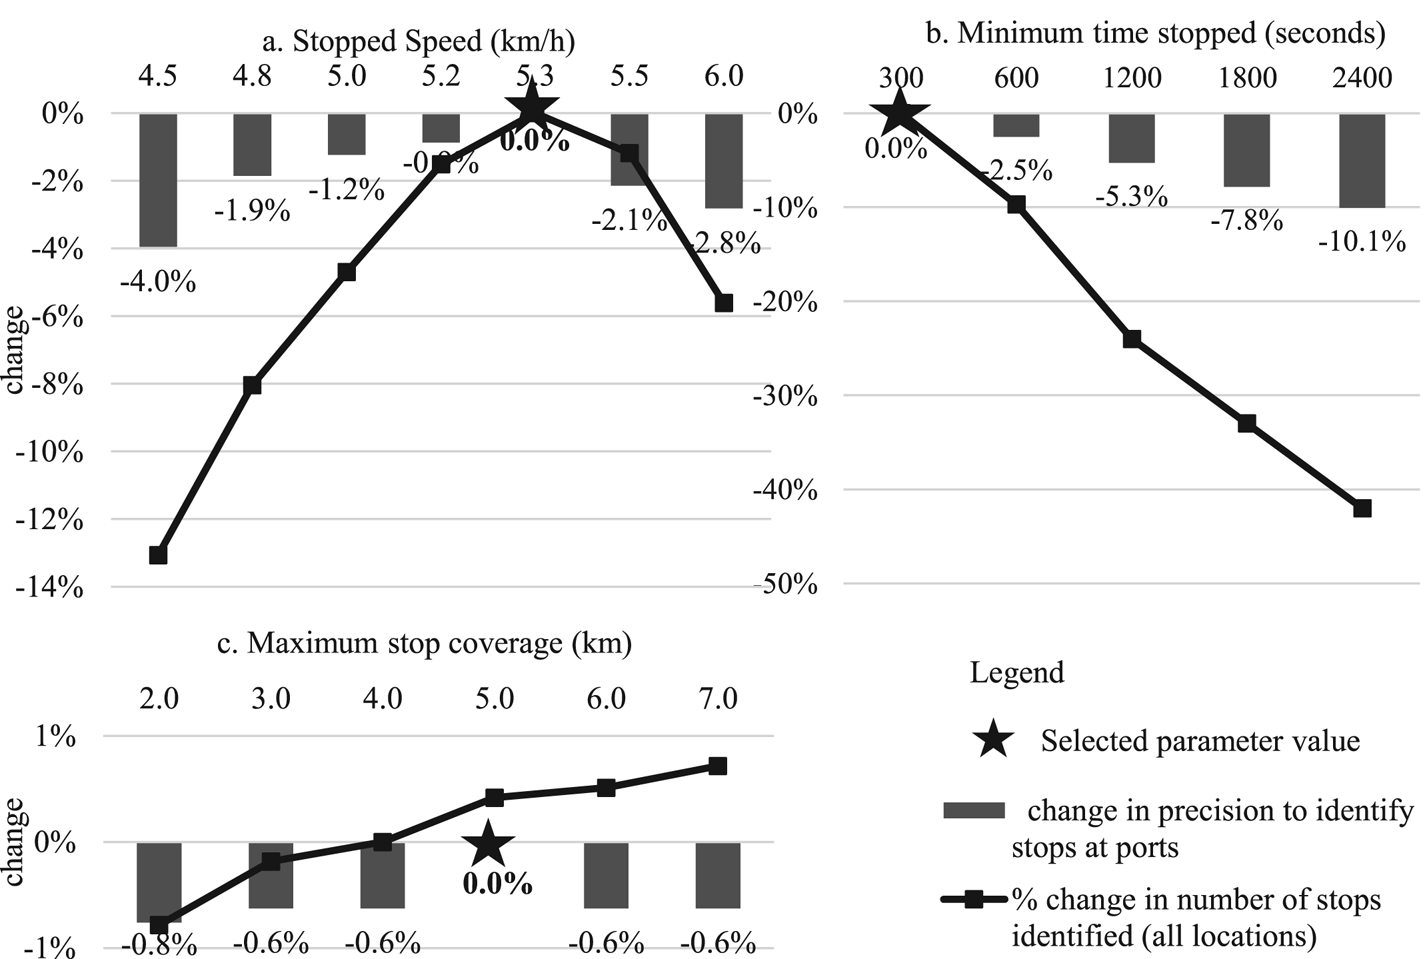
A sensitivity analysis is performed to illustrate the impact of various model parameters on model performance (Figure 11) including: (a) stopped speed, (b) minimum time stopped and (c) maximum stop coverage. Stopped speed is varied between 4⋅5 and 6⋅0 km/h [Figure 11(a)]. For the case study, 5⋅3 km/h (2⋅9 knots) produces the highest precision in stops identified at ports (84⋅0%). For the stopped speed values tested, in general, as the stopped speed decreases below or increases above 5⋅3 km/h, the algorithm precision decreases and the number of stops identified decreases by as much as 13%. This can be attributed to the number (and proportion) of duplicated stops, which tend to occur at or near ports more than at non-port areas. This increase in the number (and proportion) of duplicated stops identified by the algorithm [false positives in Equation (2)] produces a decrease in the precision.
Sensitivity of stop identification output to algorithm parameters

Minimum time stopped is varied between 300 and 2400 s (5–40 min) [Figure 11(b)]. For the case study, 300 s produces the highest precision in the stops identified at ports. In general, as minimum time stopped increases, the algorithm precision decreases from 84⋅0% to 73⋅9%. As a point of reference, the typical ‘in-port’ time for a tug to pick-up and deliver barges at a port terminal is about 30 min to a few hours, depending on weather, cargo, and other factors (U.S. Department of Agriculture, 2010). Most importantly, the selection of the minimum time stopped is dependent on the frequency of the ping data. For instance, considering that vessels may emit only one ping while stopped and that the AIS data used for analysis has a frequency of 300 s, stops corresponding to single-ping records would not be identified if the minimum time stopped parameter was greater than 300 s.
Maximum stop coverage is varied between 2 and 15 km [Figure 11(c)]. For the case study, 5⋅0 km produces the highest precision in combination with the other parameters (84⋅0%). In general, as the stop coverage increases, the number of stops identified decreases slightly (by 0⋅8%), while precision to identify stops at ports does not change. This is likely due to an increase in stops identified in locations other than ports.
5.3 Contributions and applications
With the ultimate objective of evaluating multimodal infrastructure needs and guiding investment decision-making, the methodology and results presented in this work support freight planning in general. In particular, this paper documents the development of efficient and effective tools to improve the representation of inland waterways in network-based multimodal TDMs. We focus on mining highly disaggregated terrestrial-AIS observations to identify and characterise vessel trips and trip-chains by origin, destination, length and duration, characterisations which benefit both trip-based and activity-based TDMs. Trip-based TDMs may benefit from this work in a number of ways, including but not limited to: (1) creation of OD matrices for trip distribution, (2) data for validation of waterborne mode choice and (3) trip assignment to an inland waterway network. Activity-based TDMs may benefit from: (1) the creation of a waterway network from AIS data, (2) the creation of synthetic agent populations (vessels) and (3) characterisation of trip-chains. In addition, the data reduction strategy and simplified map-matching algorithm presented in this work facilitate the mining of millions of data elements in a computationally efficient way.
5.4 Limitations and future work
For waterway network modelling, this work calculated the travel time of all links considering the average speed reported by all AIS records in the reduced dataset. Going forward this could be improved by calculating the average speed on each link considering only the AIS records observed in the vicinity of each link. Further analysis on speed may be conducted, based on if a vessel is towing, or on its size, both given in AIS message 5 (assuming these fields are input correctly).
A notable limitation of the proposed methodology to analyse freight activity based on AIS tracking data is that AIS transponders are installed on tugs and tows and not on the barges that carry freight (Kruse et al., Reference Kruse2018). This has several implications: trips made by tow/tugboats without barges or transporting empty barges are still included in the AIS data, and a tow/tugboat may pick-up loaded barges from an origin port and leave them in the vicinity of its destination port, to be picked up later to reach its final destination. Such movements are recorded as two separate trips, masking the true OD of the freight. Lastly, since each tow may push several barges, the amount of freight carried in each trip is unknown. To overcome the uncertainty in the volume of cargo carried by vessels on inland waterways, the authors have developed a stochastic approach based on the average number of barges carried by tug, as observed from LPMS data, and combined AIS with aggregated commodity databases (Asborno and Hernandez, Reference Asborno and Hernandez2021).
Building on future work based on the methodology proposed in this paper, the authors are working on further characterising inland waterway freight movements though an automated, data-driven methodology to identify the commodity carried in each trip. Such characterisation may be realised by fusing LPMS and AIS data using stochastic assignment methods. Ultimately, this paper and future work help to fill data gaps often referenced for freight commodity flows so that freight project identification and prioritisation can best leverage data-driven approaches.
6. Conclusion
Vessel tracking data that is readily available through archival AIS data provides a consistent source to observe freight activity on inland navigable waterways across time and space. The stop identification and map-matching heuristics presented in this paper allow vessel tracking data to be used to define and characterise freight trips and trip-chains along the inland waterway network. The methodology presented in this paper first identifies stops made by each vessel by clustering successive AIS position records based on their location, timestamp and calculated speed. Then, each stop is associated with a network node based on proximity. If two timewise-consecutive stops are assigned to different network nodes, they constitute the OD of a path segment. Then, a map-matching algorithm reconstructs complete vessel paths by finding the shortest path between OD pairs. Path segments through locks are joined to define freight trips and trip chains between freight activity stops at ports. Lastly, freight trips characteristics are derived, such as trip length, duration, origin and destination. The methodology is applied to the MKARNS in Arkansas with 84⋅0% precision in detecting stops at ports. Sensitivity of the model parameters, such as maximum stop speed and duration, show that to ensure accuracy for other regions, parameter calibration is necessary. Validation results show the model correctly identifies 83⋅5% of trips through locks. Given that historical AIS data are increasingly available worldwide, the proposed methodology may be applied to any region with navigable waterways.
Overcoming the limitations of prior analyses of AIS datasets, this work allows AIS data to be mapped to a well-defined inland waterway network (also generated from AIS data). In doing so, freight activity along the inland waterway can be integrated into TDM frameworks, both trip-based and activity-based. This is a benefit because many freight TDMs focus mainly on highways while ignoring important multimodal connectivity, leading to the inability to estimate multimodal performance metrics. In addition, trip-based TDMs benefit from the potential to generate OD matrices from vessel trips characterised by this work and activity-based models benefit from the potential to generate synthetic populations from the vessel trip and trip-chain characteristics derived from highly disaggregated AIS data. With the availability of AIS data and the methods for freight trip identification presented in this paper, it is increasingly possible to represent and integrate non-truck modes in freight TDMs.
Financial support and disclaimer
This material is based upon work supported by the USDOT under Grant Award Number 69A3551747130. The work was conducted through the Maritime Transportation Research and Education Center at the University of Arkansas. This work reflects the views of the authors, who are responsible for the facts and the accuracy of the information presented herein. This document is disseminated under the sponsorship of the USDOT's University Transportation Centers Program, in the interest of information exchange. The U.S. Government assumes no liability for the contents or use thereof.
Author contributions
The authors confirm contribution to the paper as follows: study conception and design: M. Asborno, S. Hernandez; data collection: M. Asborno, S. Hernandez, M. Yves, N. Mitchell; analysis and interpretation of results: M. Asborno, M. Yves; draft manuscript preparation: M. Asborno, S. Hernandez, N. Mitchell. All authors reviewed the results and approved the final version of the manuscript.
Conflict of interests
None