I. INTRODUCTION
Zn1-xMgxO:Al and ZnO:Al belong to the class of transparent conductive oxides (TCOs).Reference Ginley, Hosono and Paine1 These materials have a high transparency in the visible and near-infrared spectral range accompanied by a low resistivity between 10−2 Ω cm and 10−4 Ω cm, making them suitable for various applications like transparent electrodes in flat panel displays, thin film solar cells, as heating or as antistatic layers.Reference Ellmer and Mientus2
For the use of doped ZnO layers as transparent front contacts in chalcopyrite (Cu(In,Ga)S2) thin film solar cells an adequate conduction band alignment to the absorber films is needed. The open circuit voltage of solar cells made of Cu(In,Ga)S2 and other wide-band-gap chalcopyrites is significantly lower than expected according to the band gap energy of about 1.5 eV and only slightly higher than the open circuit voltage of solar cells made of Cu(In,Ga)Se2, which has a band gap of approximately 1.1 eV and which show currently the highest efficiencies of 20.3% for polycrystalline thin film solar cells.Reference Jackson, Hariskos, Lotter, Paetel, Wuerz, Menner, Wischmann and Powalla3, Reference Siebentritt, Rau, Siebentritt and Rau4 Theoretically, one would expect even higher efficiencies for the Cu(In,Ga)S2 solar cells as compared with the Cu(In,Ga)Se2 cells, because a band gap energy of around 1.5 eV is near the efficiency maximum according to the theory.Reference Baruch, Devos, Landsberg and Parrott5, Reference Siebentritt6
The reasons for the too low open circuit voltages of wide-band-gap chalcopyrites are not yet fully understood.Reference Siebentritt, Rau, Siebentritt and Rau4 Different mechanisms have been discussed: recombination at the interface between the absorber and the buffer layer, defects in the absorber materials and an unfavorable band alignment between front contact, buffer layer and absorber layer.Reference Siebentritt, Rau, Siebentritt and Rau4, Reference Rau, Turcu, Noufi, Shafarman, Cahen and Stolt7 The band alignment between the conduction band minima of the window layer and the absorber layer can be improved by the use of a transparent front contact, which has a higher lying conduction band minimum.Reference Yamada, Matsubara, Sakurai, Ishizuka, Tampo, Fons, Iwata and Niki8 This can be realized, for instance, with Zn1-xMgxO:Al of which the band gap and therefore the conduction band minimum can be increased in a wide range without phase separation of MgO and ZnO. The reported nonequilibrium solubility limits x of Mg in ZnO depend on the deposition technique as well as parameters. Mg solubilities between x = 0.33 and 0.49 have been reported,Reference Minemoto, Negami, Nishiwaki, Takakura and Hamakawa9, Reference Park, Yi and Jang10 accompanied by an increase of the band gap energy from 3.24 eV for x = 0–4.20 eV for x = 0.46 for radio frequency (RF) magnetron-sputtered films.Reference Minemoto, Negami, Nishiwaki, Takakura and Hamakawa9
In the present article, we studied the relation between the electrical transport and structural properties like inclusion of other phases, grain size, density of dopants or trap densities at grain boundaries of magnetron-sputtered Zn1-xMgxO:Al and ZnO:Al films.
II. EXPERIMENTAL DETAILS
The Zn1-xMgxO:Al and ZnO:Al films were prepared by magnetron sputtering from circular 76 mm ceramic targets (ZnO/MgO/Al2O3 88/10/2 mol% and 98/0/2 mol%) with a nearly balanced magnetron. The target-to-substrate distance was 61 mm. RF excitation with a constant generator power of 50 W was used. For 13.56 MHz plasma excitation frequency about 90% of the power is coupled into the plasma resulting in a target voltage of about −160 V. The 27.12 MHz generator delivers 80% of the power to the plasma at a target voltage of about −85 V. The sputtering was performed in pure argon at a pressure of 0.27 Pa. Unless otherwise mentioned, the data presented is for films prepared at 13.56 MHz.
As substrates, borosilicate glass with a size of 10 x 10 x 1.1 mm3 was used, which was radiatively heated by a boron nitride-encapsulated graphite heater up to temperatures of 500 °C.
The film thickness, typically 400–500 nm, was measured with a surface profilometer (Dektak 8, Veeco Instruments, Inc., Tucson, AZ) with an accuracy of around 5%. Resistivity and Hall measurements were performed at room temperature using contacts in the van der Pauw geometry and a magnetic field of 0.86 T. Ohmic contacts to the films were prepared by evaporation of Ni/Au (10/150 nm) contact triangles. The crystalline structure has been determined by x-ray diffraction in Bragg-Brentano geometry with a PANalytical X’Pert-MPD (PANalytical B.V., Almelo, Netherlands) using Cu Kα radiation and an x-ray tube voltage and current of 40 kV and 30 mA, respectively. The system has a 1D-detector ("PIXcel," PANalytical, Almelo, Netherlands) with an angular resolution in the range of the step size and no monochromator. A step size of 0.013° 2θ for a range from 25 to 80° 2θ and an integrated time of 100 s per angle position resulted in a measurement time of 30 min for one spectrum. The XRD patterns were analyzed with the program FullProf.Reference Rodriguez-Carvajal11 The films show a highly preferred c-axis orientation, which makes only the (0002)- and (0004)-peaks in the diffraction pattern visible. Because of that, the grain size and nonuniform strain (microstrain) have been calculated from the corrected integral Cauchy and Gauss widths of the (0002)-peak using the Scherrer formulaReference Scherrer12 and following the procedure of de Keijser et al.Reference Keijser, Langford, Mittemeijer and Vogels13
The composition of the samples was determined by Rutherford backscattering spectrometry (RBS) using 1.7 MeV 4He ions at an incidence and scattering angle of 0° and 170°, respectively. For the RBS analysis the films were deposited on glassy carbon (Sigradur, HTW Hochtemperatur-Werkstoffe GmbH, Thierhaupten, Germany) substrates to reduce the backscattering background. The detector resolution was 18 keV and the charge collected with the detector, covering a solid angle of 3.18 msr, was 10 μC.
It is known, that the electrical and structural properties of ZnO films exhibit a radial distribution,Reference Minami, Miyata, Yamamoto and Toda14 which has also been observed for our films. However, the effect was too weak to change the general observations of this article.
III. RESULTS—ELECTRICAL PROPERTIES AND CRYSTALLINE QUALITY
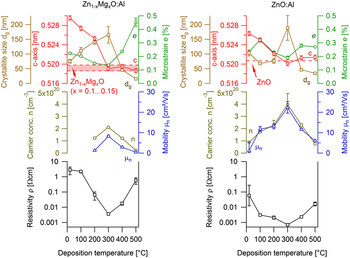
Figure 1 presents the results of resistivity, Hall (n, μ) and x-ray diffraction measurements for Zn1-xMgxO:Al and ZnO:Al films prepared at different substrate temperatures.
Resistivity, carrier concentration, Hall mobility, crystallite size, c-axis lattice constant and microstrain for Zn1-xMgxO:Al and ZnO:Al films deposited at substrate temperatures from 25 °C up to 500 °C. The depositions at the lowest substrate temperature were performed without intentional heating. The crystallite size and microstrain have been calculated using the Scherrer formulaReference Scherrer12 and following the procedure of de Keijser et al.Reference Keijser, Langford, Mittemeijer and Vogels13 The c-axis lattice parameter for the ZnO is taken from powder diffraction file JCPDS 36-1451.

The crystallite size exhibits a maximum value of 170 ± 30 nm for the Zn1-xMgxO:Al films and 190 ± 40 nm for the ZnO:Al films at deposition temperatures of about 300 °C. This is of the same order of magnitude as the thickness of the films. It has to be kept in mind that this is the size of domains perpendicular to the surface, which scatter the x-rays coherently and therefore represents only a lower limit for the grain size.Reference Dinnebier, Billinge, Dinnebier and Billinge15 The smallest crystallite sizes were obtained for substrate temperatures of 500 °C (16 ± 1 nm in Zn1-xMgxO:Al films and 34 ± 1 nm in ZnO:Al films), values that are of the same order of magnitude as reported by other authors.Reference Chen, Pei, Wang, Sun and Wen16, Reference Szyszka17 The microstrain exhibits its lowest values of 0.19 ± 0.01% for Zn1-xMgxO:Al and 0.14 ± 0.01% for ZnO:Al around 300 °C substrate temperature for both materials. Whereas for the ZnO:Al films the microstrain does not change very much with temperature, the microstrain in the Zn1-xMgxO:Al films increases strongly with increasing deposition temperature over 300 °C, resulting in a significantly higher microstrain of 0.45 ± 0.03% at 500 °C.
The c-axis lattice parameter changes for the Zn1-xMgxO:Al films strongly for deposition at room temperature (0.5296 ± 0.0005 nm) to 300 °C (0.5191 ± 0.0005 nm), which corresponds to a relative change of 2%. Above 300 °C the lattice parameter is more or less constant. The ZnO:Al films exhibit a similar behavior: the c-axis lattice constant changes from 0.5263 ± 0.0005 nm to 0.5201 ± 0.0005 nm with increasing deposition temperature up to 300 °C (relative change 1.2%). For higher temperatures there are again only relative changes of minor nature, approximately 0.25%. The maximum compressive stress, calculated from the c-axis expansion,Reference Cebulla, Wendt and Ellmer18 in the ZnO:Al films is σ = −(2.5 ± 0.2) GPa referring to a c-axis lattice constant of 0.52068 nm for ZnO (JCPDS 36-1451). The Zn1-xMgxO:Al films exhibit a maximum compressive stress of σ = −(4.7 ± 0.5) GPa for a reference lattice parameter between 0.5186 and 0.5198 nm.Reference Park, Yi and Jang10, Reference Pies, Weiss, Hellwege and Hellwege19 For deposition temperatures above 300 °C the films are nearly stress free.
Films with the lowest resistivity can be prepared for substrate temperatures around 300 °C. The minimum resistivity of the Zn1-xMgxO:Al films is (3.6 ± 0.2)·10−3 Ω cm and that of the ZnO:Al films is (7.0 ± 0.5)·10−4 Ω cm. Excluding the value for 100 °C, the resistivity of the Zn1-xMgxO:Al films is for the different temperatures between 5 (300 °C) and 50 times (room temperature) higher than that of the ZnO:Al films.
The Hall mobility has its maximum value of 8.3 ± 0.5 cm2/(Vs) for Zn1-xMgxO:Al and 22 ± 3 cm2/(Vs) for ZnO:Al around substrate temperatures of 300 °C. For higher and lower temperatures the Hall mobility decreases. A similar behavior can be observed for the carrier concentration. The maximum carrier concentration is reached for both materials around Tsub = 300 °C: (2.10 ± 0.05)·1020 cm−3 in Zn1-xMgxO:Al and (4.0 ± 0.7)·1020 cm−3 in ZnO:Al. For Zn1-xMgxO:Al films deposited below 200 °C it was not possible to measure the Hall effect with our system. The lowest carrier concentration observed in ZnO:Al was (7.0 ± 0.1)·1019 cm−3.
The lowest resistivities reported in literature for the ZnO:Al are about 2·10−4 Ω cm for plasma-assisted processes like magnetron sputtering or pulsed laser deposition.Reference Ellmer, Ellmer, Klein and Rech20 The resistivities of our films are higher, because we did not mainly focus on optimizing the film conductivity. The values for the Hall mobility and carrier concentration encompass a wide range of scattering as reported in literature, which cover the range of the data of our films.
IV. DISCUSSION
A. Crystalline quality
During magnetron sputtering deposition, a growing film experiences an impingement both of species contributing to the film growth (Zn, O, ZnO, ...), as well as of energetic species from the plasma (Ar+, O+, Zn+, ...) and from the target surface (O-), influencing the film growth by enhanced surface diffusion and/or formation of lattice defects.Reference Ellmer and Welzel21 The bombardment of the films by high energetic negative oxygen ions leads to interstitial defects in the lattice of the Zn1-xMgxO:Al and ZnO:Al films by the ion peening effect.Reference Windischmann22 Thus the lattice constant expands relative to the value of the ZnO or Zn1-xMgxO standard, which can be seen in Fig. 1 at low deposition temperatures. A high defect density also explains the small crystallite sizes. When the substrate temperature during the deposition is increased, more and more of these defects are annealed out.Reference Janotti and Van de Walle23 This leads to a decreasing lattice expansion, which we observe for both materials, accompanied by an increase of the size of the crystallites, because of a reduction of intragrain defects.
The solubility limit of aluminum in zinc oxide in the thermodynamic equilibrium is well below 1 at.%.Reference Shirouzu, Ohkusa, Hotta, Enomoto and Hojo24 Under nonequilibrium conditions, which exist for instance during magnetron sputtering, the solubility limit for aluminum is higher (<3 at.%) and phase segregation of ZnAl2O4 and Al2O3 occurs for higher aluminum contents.Reference Cornelius, Vinnichenko, Shevchenko, Rogozin, Kolitsch and Moller25, Reference Sieber, Wanderka, Urban, Dorfel, Schierhorn, Fenske and Fuhs26 Since we have an Al content between 2 at.% to 3 at.% below 400 °C for both materials, we can assume that the aluminum content in our films is at least near to the solubility limit. For low deposition temperatures it may be possible that we are preparing films in a metastable state, where there is no significant segregation of other phases. For higher deposition temperatures we may come closer to the state of equilibrium and we have to expect stronger phase segregation. However, it was not possible to detect any increasing phase segregation by XRD. It has been reported that the segregation of competing phases like ZnAl2O4 and Al2O3 mainly occurs at the grain boundaries and with very small grain sizes, making it almost undetectable by XRD, but obstructing the grains from growing larger.Reference Sieber, Wanderka, Urban, Dorfel, Schierhorn, Fenske and Fuhs26, Reference Han, Mantas and Senos27 This corresponds to the decrease of the grain size for deposition temperatures above 300 °C. The constancy of the lattice parameter above 300 °C can be explained in terms of a more or less relaxed lattice, because most of the point defects have been annealed out already during the film growth.
The stronger lattice expansion that we observe for the Zn1-xMgxO:Al films, as compared with the ZnO:Al films, for lower deposition temperatures can be due to a higher flux of high energetic negative oxygen ions bombarding the growing film when using a Mg-containing target. Based on a higher target voltage for direct current (DC) sputtering of ZnO, as compared with that of MgO,Reference Welzel, Dunger, Liebig and Richter28, Reference Welzel, Kleinhempel, Dunger and Richter29 there is strong evidence that the ion-induced secondary electron emission coefficient of MgO is higher than that of ZnO.Reference Depla, Heirwegh, Mahieu, Haemers and De Gryse30 A higher secondary electron emission coefficient induces a higher negative oxygen ion flux,Reference Mahieu and Depla31 which will bombard the films leading to more interstitial defects and hence a larger lattice expansion for the Zn1-xMgxO:Al films.
The lattice constant for temperatures above 300 °C, which probably corresponds to a relaxed lattice, for the Zn1-xMgxO:Al films is smaller as compared with the lattice constant of ZnO:Al films. This has also been observed in the literature for various deposition techniquesReference Park, Yi and Jang10, Reference Ohtomo, Kawasaki, Koida, Masubuchi, Koinuma, Sakurai, Yoshida, Yasuda and Segawa32, Reference Wu, Lu, Shen and Fan33 and can be attributed to the smaller tetrahedral ionic radiiReference Lide34 of Mg2+ (57 pm) as compared with that of the Zn2+ (60 pm).
The stronger increase in microstrain for the Zn1-xMgxO:Al as compared with the ZnO:Al films for deposition temperatures above 300 °C may be induced by a stronger phase segregation due to the higher content of aluminum and magnesium in these films.Reference Leineweber and Mittemeijer35
B. Carrier mobility
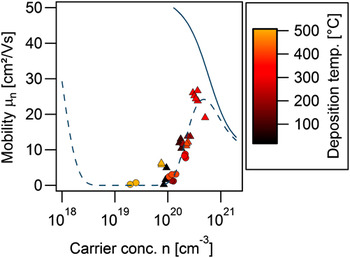
Figure 2 shows the Hall mobilities as a function of the free electron density together with a fit curve for the mobility of single crystalline zinc oxide, given by EllmerReference Ellmer36 using the general semiempirical fit formula of Masetti, first reported for c-Si mobility values.Reference Masetti, Severi and Solmi37 Also shown is a fit to the present data based on a combination of the grain barrier-limited transport model comprehensively described by SetoReference Seto38 and the ionized impurity model used by Ellmer, both of which will be introduced briefly in the following.
Hall mobility as a function of the carrier concentration for the Zn1-xMgxO:Al (●) and ZnO:Al (▲) films deposited at different temperatures. The solid curve represents a semiempirical fit to single crystalline zinc oxide dataReference Ellmer36 using the Masetti formula.Reference Masetti, Severi and Solmi37 The dashed line is a fit with a combined transport model taking into account grain barrier and ionized impurity scattering [Eq. (4)].

According to the grain barrier-limited transport model of Seto, the crystallographic defects at the grain boundaries induce a density of trap states in the band gap N t. Depending on the carrier concentration inside the grains, the trap states can be partially or completely filled, which results in a varying barrier height Φ B and width. The electrons can overcome this barrier by thermionic emission or by tunneling if the width is narrow enough (<≈ 2 nm). According to Seto the effective mobility is given by

with the barrier height


where e is the elementary charge, L is the grain size, N is the carrier density in the bulk of the grain, εr is the static dielectric constant and m * is the effective mass of the charge carriers.
Equation (1) for the grain barrier-limited transport can be combined with the fit formula to the single crystalline zinc oxide data

using Mathiessens rule
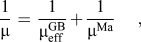
where μ min is the ionized impurity mobility at high carrier concentrations, μ max is the lattice mobility at low carrier concentrations and (μ max–μ 1) is the clustering mobility at very high carrier concentrations (values for single crystalline zinc oxide were given by EllmerReference Ellmer36). A fit with Eq. (4) describes the observed data very well (see the dashed line in Fig. 2). The trap density extracted from the fit to the data of the Zn1-xMgxO:Al and ZnO:Al films is N t = (2.3 ± 0.2)·1013 cm−2 and the grain size is L = 13 ± 5 nm, with εr = 8.34 and m* = 0.28 me (me electron mass). It has to be noted that L is, in contrast to the result of the XRD measurement, related to the lateral grain size because the current flow in the sample for the Hall measurement is parallel to the film surface.
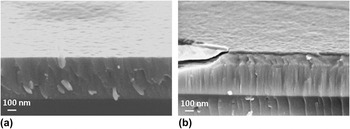
The trap density of our films is of the same order of magnitude as the values compiled by Ellmer.Reference Ellmer, Ellmer, Klein and Rech20 The lateral grain size extracted from the fit to the electrical transport data is in reasonable agreement with results from scanning electron microscopy, which show typical grain sizes below 40 nm for the different temperatures. For bigger crystallites it can clearly be seen that the growth is columnar, which is why the lateral grain size remains small even if the vertical grain size may be in the range of the film thickness (see Fig. 3). This also justifies as a rough approximation the assumption of a single crystallite size for the fit of the combined transport model to the mobility data of films prepared at different substrate temperatures.
Cross-sectional scanning electron microscopy pictures of a (a) Zn1-xMgxO:Al and (b) ZnO:Al film deposited at a substrate temperature of 300 °C on borosilicate glass. The columnar growth is clearly visible. A carbon layer was deposited on top of the films to avoid charging-up effects.

The mobility data for both materials can be described well by the same model and with the same grain boundary trap density. Since for most of the films the relation LN > N t holds and the clustering of ionized impurities, which becomes the dominant mechanism reducing the mobility above n >≈ 5·1020 cm−3, is not too strong, a higher carrier concentration leads to a higher mobility. This explains the dependence of the mobility on the substrate temperature: from room temperature up to 300 °C deposition temperature the carrier concentration is increasing, which leads to a decreasing grain barrier height and therefore to an increasing effective mobility.Reference Seto38 Above 300 °C, the carrier concentration decreases, leading to an increased barrier height, reducing the Hall mobility. The lower carrier concentration in the Zn1-xMgxO:Al films, as compared with the carrier concentration in the ZnO:Al films, leads to a higher grain barrier and hence a lower mobility in the Zn1-xMgxO:Al films, in accordance with the model.
The electron mean free path l e for diffusive transport can be, according to Sondheimer,Reference Sondheimer39 calculated as:

where h is Planck’s constant, e the elementary charge, ρ the resistivity and n the density of free carriers. For the Zn1-xMgxO:Al films l e is smaller than 1 nm, i.e., much smaller than the grain size of these films. Usually this is taken as an indication, that the transport is diffusive and not influenced by grain barrier scattering.Reference Chang and Hon40, Reference Chen, Pei, Wang, Yu, Liu, Sun and Wen41 This, however, is a wrong interpretation based only on the diffusive (Drude) model. Such a model is not applicable for polycrystalline materials with electrical grain barriers, as was shown recently by Lipperheide et al.Reference Lipperheide, Weis and Wille42 These authors developed a universal transport model that combines ballistic and diffusive transport. The main parameter in their model is the ratio of the electron mean free path l e and a transport length L T, which is given by L T = l e + s* + Λ*, where s* is a reduced sample (grain) size and Λ* is a shape parameter. The latter two parameters depend in an integral way on the barrier height and its shape. The mean free electron path (which has to be calculated for the carrier concentration in the grains) has to be compared not to the grain size d g, but to the transport length L T. Only, if l e ≪ s* + Λ*, diffusive transport is dominating, whereas for l e ≫ s* + Λ* ballistic transport prevails. In our range of carrier densities in the grains, we actually see qualitatively the transition from ballistic transport over the grain barriers to diffusive transport due to ionized impurities only.
For the Zn1-xMgxO:Al films deposited with 27.12 MHz plasma excitation frequency (not shown here), the carrier concentration is in the same range as for the ZnO:Al films deposited with 13.56 MHz. Nevertheless, the mobility of the carriers in the Zn1-xMgxO:Al films is lower. This may be due to additional scattering mechanisms like alloy scattering, caused by the addition of Mg.Reference Nordheim43
C. Carrier concentration
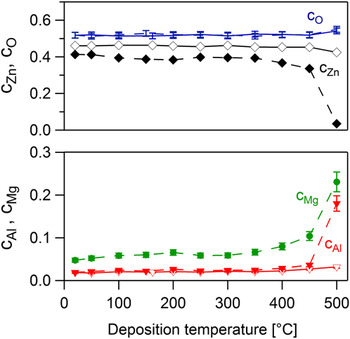
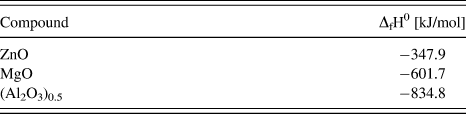
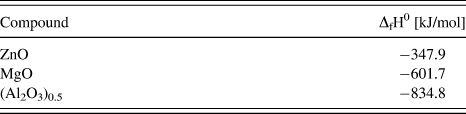
As we have seen, the mobility strongly depends on the grain barrier height. The measured carrier concentrations, however, do not depend on the grain barrier height at least for carrier concentrations above n ≈ 1019 cm−3.Reference Seager44, Reference Steinhauser, Fay, Oliveira, Vallat-Sauvain, Zimin, Kroll and Ballif45 Therefore, the observed dependences n(T sub) have to be caused by another reason (other reasons). First of all, the chemical composition of the films was analyzed by RBS, displayed in Fig. 4 as a function of the substrate temperature. The dopant concentration c al for both materials is nearly constant from room temperature up to 350 °C at about 2.3 ± 0.2 at.% for the Zn1-xMgxO:Al and 2.1 ± 0.3 at.% for the ZnO:Al films. Only for T sub ≥ 350 °C a slight increase of c al is observed and for Zn1-xMgxO:Al a strong increase at 500 °C. The increase of the Al (and Mg) contents with a simultaneous decrease in Zn content, which is more pronounced in the films made of Zn1-xMgxO:Al, is due to the different vapor pressures of the metals and the enthalpy of formation of the oxides. Zinc has the highest vapor pressureReference Alcock, Itkin and Horrigan46 and the lowest affinity to oxygenReference Liley, Reid, Buck, Weast and Astle47 (Table I), which means that it has the highest tendency to reevaporate from the substrate. The effect is more pronounced for the Zn1-xMgxO:Al films, because there also the magnesium is competing with the Zn in the formation of an oxide. The magnesium content may also lead to a stronger phase segregation due to the formation of MgAl2O4 at high deposition temperatures.
Chemical composition as a function of the substrate temperature for Zn1-xMgxO:Al and ZnO:Al films deposited on glassy carbon (Sigradur), measured by Rutherford backscattering spectrometry (RBS). Filled symbols (dashed lines) for Zn1-xMgxO:Al, open symbols (full lines) for ZnO:Al. Measured elements: O (without symbol), Zn (◇,◆), Al (▽,▼), Mg (●).

Standard enthalpy of formation ΔfH0 of the oxides for the metals present during the deposition,Reference Liley, Reid, Buck, Weast and Astle47 related to one metal atom.
Comparing these trends for c al, the chemical dopant concentration can be excluded as the reason for change in the carrier concentration with the deposition temperature. Obviously, the change in carrier concentration must be connected to variations in the dopant activation and/or to a carrier compensating mechanism.
The diffusion of Na, which acts as an acceptor in zinc oxide,Reference Janotti and Van de Walle23 from the substrate into our films, which may become significant for higher deposition temperatures, cannot be a reason for the behavior of the carrier concentration as well. Depositions and measurements of films prepared on alkali-free glass (AF45) confirmed this.
We performed x-ray absorption near-edge structure (XANES) measurements for the Al K edge of the Zn1-xMgxO:Al and ZnO:Al films (to be published). These spectra are comparable to absorption spectra of the Al K edge of aluminum nitride (AlN) thin films, grown with a preferred c-axis orientation like it is the case for our zinc oxide films.Reference Suga, Kameyama, Yoshioka, Yamamoto, Tanaka and Mizoguchi48 Since AlN has the same hexagonal crystalline structure as ZnO, we assume that the aluminum atoms are mostly substituted on zinc lattice sites in our films. This is in agreement with the usual dopant model for Al in ZnO, where the Al3+ ion is believed to be substituted on a zinc lattice site and to spend one electron to the conduction band.Reference Kröger49, Reference Zhang, Wei and Zunger50 Other defects like zinc interstitials are assumed to lead to intrinsic doping and probably cause, together with residual hydrogen, the n-type conductivity in "undoped" ZnO.Reference Janotti and Van de Walle23
However, the free carrier concentration can also be compensated by native defects like zinc vacancies or oxygen interstitials.Reference Janotti and Van de Walle23, Reference Zhang, Wei and Zunger50, Reference Sun and Wang51 Depending on whether the growth conditions are zinc-rich or oxygen-rich, the local density approximation (LDA)-corrected defect formation enthalpy for compensating defects gets close to or even becomes smaller than the formation enthalpy for donor-like defects with increasing Fermi level.Reference Zhang, Wei and Zunger50, Reference Erhart, Albe and Klein52 Due to the fact that we have degenerately doped films and therefore a very high Fermi level, we can assume that the formation enthalpy for compensating defects is at least in the same range as that for donor-like intrinsic defects in our films.
Therefore, the increase of the carrier concentration accompanied by the increase of the crystallite sizes and the decrease of the c-axis lattice expansion up to substrate temperatures of about 300 °C can be explained by the following model: due to the bombardment of the films with high energetic negative oxygen ions during the growth, it is likely that oxygen interstitials are formed, which are responsible for the c-axis lattice expansion accompanied by the compensation of the free carriers. Additionally, defect complexes of oxygen interstitials and aluminum, leading to an inactivation of the dopant, may also be formed.Reference Roberts, Wang, Sleight and Warren53 If the deposition temperature is increased from room temperature up to 300 °C, more and more of these defects are annealed out,Reference Janotti and Van de Walle23 reducing the compensation and the concentration of free carriers increases. Above temperatures of 300 °C, an increased phase segregation of Al2O3, ZnAl2O4 and/or MgAl2O4 may lead to an increasing number of inactive dopant atoms and thus to a decreasing carrier concentration, which is probably more pronounced for the Zn1-xMgxO:Al films due to an even stronger phase segregation.
V. CONCLUSION
The crystalline quality and the electrical properties of Zn1-xMgxO:Al and ZnO:Al films have been measured and compared. The films were deposited by magnetron sputtering at different substrate temperatures from room temperature up to 500 °C. The changes in the crystalline quality and the electrical properties, which occur for different deposition temperatures and between the two materials are governed by the same fundamental effects: the behavior of the Hall mobility can be explained by a combined transport model taking into account ionized impurity and grain barrier scattering. The changes in the crystalline quality and carrier concentration can be tentatively explained as a result of the bombardment of the films with high energetic negative oxygen ions and defect annealing as well as phase segregation for higher deposition temperatures.
This hypothesis is supported by the observation that the Zn1-xMgxO:Al films exhibit a lower crystalline quality and hence a lower conductivity in comparison to the ZnO:Al films, taking into account that a more intense bombardment by negative oxygen ions, caused by the higher ion-induced secondary electron emission coefficient, is expected for the Zn1-xMgxO:Al target.
It is possible to improve the film quality by reducing the number and energy of the high energetic negative oxygen ions bombarding the film. For example, by using 27.12 MHz plasma excitation frequency, the target voltage at a constant power and therefore the maximum energy of the bombarding particlesReference Ellmer and Welzel21 can be reduced by about a factor of 2. For the Zn1-xMgxO:Al this results in a minimum obtainable resistivity of (8.1 ± 0.4)·10−4 Ω cm in comparison to (3.6 ± 0.2)·10−3 Ω cm for excitation with 13.56 MHz and for the ZnO:Al films the minimum resistivity is reduced from (7.0 ± 0.5)·10−4 Ω cm to (3.2 ± 0.2)·10−4 Ω cm. The defect density in the grain boundaries N t of Zn1-xMgxO:Al and ZnO:Al films prepared at 27.12 MHz, however, is not changed, indicating that N t is an intrinsic property of zinc oxide.
ACKNOWLEDGMENTS
We thank the Helmholtz-Zentrum Dresden-Rossendorf (Richard A. Wilhelm) for the assistance during the RBS measurements and Dag Riebisch for performing most of the electrical measurements.