Congressional Forecasts: Theory Versus Tracking in 2010
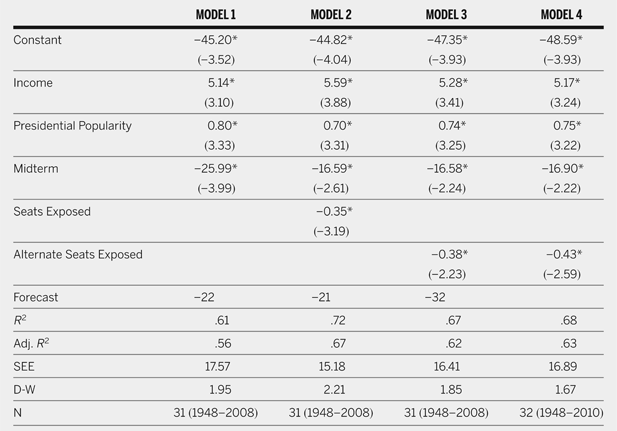
In our recent article forecasting the 2010 U.S. congressional elections, we argue for a model based on theory rather than tracking (Lewis-Beck and Tien Reference Lewis-Beck and Tien2010). A sound theoretical explanation of vote choice in House races should, ceteris paribus, predict better than a simple dependence on variables that proxy the vote, such as the generic ballot question. We posited a simple but classical explanation of the 2010 House vote—the referendum model—in which voters punish or reward the party in power according to its performance in office and the time available for that performance. In words, the model reads: House Seat Change = f(Economy, Popularity, Midterm). A measurement of these variables, at lags appropriate for forecasting, yields the estimates (OLS) of model 1, shown in column 1 of table 1. Model 1 gives a forecast of −22 seats for the Democrats in 2010, when, in fact, they scored about −60 seats. The model 1 forecast appears “wrong” in two senses. First, substantively, it fails to predict the Republican takeover of the House. Second, scientifically, it is off by over two standard errors of estimate (i.e., 38/17 > 2.0). Why did the model get it wrong this time, when the forecast was off by only one seat in the last midterm in 2006? To answer this question, the specifications of the model need consideration. Such consideration signals the scientific value of the forecasting exercise in providing a systematic trial-and-error method for model improvement.
The Referendum Model of Congressional Elections: Tests against 2010

Note. Figures in parentheses are t-values. * = statistically significant at .05. All variables as defined in Lewis-Beck and Tien (Reference Lewis-Beck and Tien2010).
The 2010 error suggests a need for attention to the absence of particular independent variable(s). What comes to mind immediately is a seats-at-risk or seats-exposed variable. We have employed such a variable in the past—indeed, we were among the leaders in developing the original concept of seats exposed (see Lewis-Beck and Rice Reference Lewis-Beck and Rice1992.) We resist its current use here, because it is more of a “tracking” variable than a substantive variable explaining vote choice. Nevertheless, we now introduce it, as an experiment, in model 2, table 1, column 2. Note that model 2 yields virtually the same forecast as model 1, predicting −21 Democratic seats. The implication is that taking seat exposure into account makes little difference. However, one might argue with the exposure measure used. Our historic measure of seats exposed is based on the departure from the average number of seats over the full electoral cycle of 62 years, which, for Democrats, is 245 seats. From that average, the 257 seats that were held by the Democrats going into 2010 does not fall far from the average, suggesting relatively little exposure in the contest.
Suppose that an alternative, more contemporary seats-exposed measure is used—namely, the departure from the average over the last 10 years (five elections). For the Democrats, that number (since 2002) is 222. Compared to the 257 Democratic seats going into 2010, this average does suggest that the Democrats had, after all, relatively high exposure. Thus, we introduce this alternative seats-exposed variable, yielding the estimates for model 3 reported in table 1, column 3. Now the forecast for the Democrats is −32, a loss that is still not large enough to force the party to forfeit control of the chamber. How sound is model 3? Note that its fit statistics—adjusted R 2 = .62 and SEE = 16.89—are comparable to the other two specifications of table 1. Furthermore, the magnitude of the coefficients of the substantive variables—the economy and popularity—seem stable, regardless of the particular specification used.
The previous comments on model 3 are general. What if we look at 2010 in particular to see if this year is an outlier? At first blush, it might seem so. First, there is the sheer magnitude of the loss itself. Second, 2010 does not compare well to what is perhaps the most relevant contest in the series—that of 1982. In that year, the economy was in trouble and President Reagan's popularity was only 45% (close to President Obama's figure). However, the Republicans lost 25 seats rather than 60. To examine this case, then, if 2010 represents an outlier, different diagnostics are possible. First, we can look at the model without the 2010 case (as in model 3) or with the 2010 case (as in model 4, table 1, column 4). Again, we see that the fit statistics and the magnitude of the substantive coefficients are quite similar for models 3 and 4. The 2010 case itself can be analyzed (as in model 4). The externally studentized residual for 2010 of 1.57 fails to exceed its critical value of 2.00. Furthermore, no DFBETAS for 2010 exceed the critical value of .35. In addition, the 2010 Cook's D = .06 is below the critical value of .14. By these diagnostics, the 2010 case does not represent a high-leverage outlier in this model. The lack of outlier status receives visual confirmation in the scatterplot of studentized residuals in figure 1. Here, we see that the 2010 observation fits comfortably, falling in line with expectations. In sum, the outlier hypothesis fails to be supported.
Externally Studentized Residuals

Conclusions
These theoretical and statistical challenges to the referendum model point to two conclusions, one benign and the other less so. The benign conclusion is that the 2010 Democratic losses in the House are pretty much as expected, given political and economic conditions. Put another way, no special explanation beyond the variables of model 3 is needed. The less benign conclusion is that the small sample size prevents detection of 2010 as an outlier driven by variable(s) not included in the model. One candidate variable here might be race, which we found negatively affected support for Obama in 2008 (Lewis-Beck, Tien, and Nadeau Reference Lewis-Beck, Tien and Nadeau2010). However, we do not have measures at hand to test the race hypothesis here. For now, it must remain conjecture.