1. INTRODUCTION
Designers and practitioners trying to come up with creative design solutions use a vast variety of techniques and approaches, many of which try to achieve inspiration or improved designs through making connections to examples, objects, or more or less random stimuli. For example, designers may conduct examinations of existing or competing products already fulfilling similar functions (e.g., benchmarking; Ulrich & Eppinger, Reference Ulrich and Eppinger2000), conduct brainstorming sessions (Osborn, Reference Osborn1963), or engage in activities where they are more or less randomly primed by stimuli (e.g., de Bono, Reference de Bono1975; MacCrimmon & Wagner, Reference MacCrimmon and Wagner1994; Firestien, Reference Firestien1996). Some of these techniques engage the designer in actively pursuing connections to past examples, whereas others attempt to prime the designers into incidentally discovering new connections. By making connections to exemplars, ideas, or stimuli, the hope is to achieve more creative design solutions.
The defining characteristics of creative products are their novelty and usefulness (Mayer, Reference Mayer and Sternberg1999). However, past research on exemplar influence on creative processes and creative outcomes have tended to focus extensively on the originality aspect of creativity. It has been argued and shown that providing past exemplars in creativity may have both beneficial and detrimental effects on the creative outcome (Smith et al., Reference Smith, Ward and Schumacher1993; Hinsz et al., Reference Hinsz, Tindale and Vollrath1997; Perttula & Sipilä, Reference Perttula and Sipilä2007; for a review, see Christensen & Schunn, Reference Christensen, Schunn, Markman and Wood2009a). Depending on the amount and type of exemplar used (Perttula & Sipilä, Reference Perttula and Sipilä2007), creativity may be improved or suffer. Some studies have tended to focus on the negative impact of exemplars on creative outcomes through decreased originality (e.g., Ward, Reference Ward1994; Dahl & Moreau, Reference Dahl and Moreau2002; Ward et al., Reference Ward, Patterson, Sifonis, Dodds and Saunders2002), or transfer of design problems, leading to design fixation (Jansson & Smith, Reference Jansson and Smith1991), but other studies have focused on the creative problem solving potential of analogous solutions (Gick & Holyoak, Reference Gick and Holyoak1980, Reference Gick and Holyoak1983).
In the present article we focus instead on the potentially important positive influence of past examples on design usefulness (i.e., the other defining characteristic of creativity). How do users perceive the usefulness of products that were generated by making connections to other examples and objects? Furthermore, although past exemplar research has tended to focus on how other objects may influence the creative process and design outcomes, we know much less about how examples of connection to users and people in general influences the design process. Tentative answers may come from techniques aiming at keeping the user central in the design process. This may be ensured through a number of approaches, including involving the users themselves actively in product development or through user-driven design (Norman & Draper, Reference Norman and Draper1986). Perhaps another way to ensure design outcome usefulness is to simply present examples of users to designers during the design process. In support of this, Im and Workman (Reference Im and Workman2004) developed a model for new product (NP) creativity, in which creativity was a mediator between market orientation and NP success. Creativity was separated into the dimensions of novelty and meaningfulness (defined as the extend to which NPs are perceived as appropriate and useful to target customers), and they found that a customer orientation led to more NP meaningfulness (but less NP novelty). Of novelty and meaningfulness, NP meaningfulness was of greater importance in explaining the link between market orientation and NP success. The present article is an attempt at specifying, using theories of creativity from cognitive science, how creative design thinking can be stimulated to improve NP usefulness in the final product. Here, a novel approach is suggested: by strategically supporting the thinking processes of the designers through the deployment of images of end users, it may be possible to lead design thinking in the direction of considering the user more during NP design. Further, it is hypothesized that by strategically showing images of within-domain products it is possible to lead design thinking in the direction of including knowledge of relevant analogous products in the design outcomes. In both cases, the strategic deployment of images should lead to products that the end users should consider more useful and be more willing to use. The present study will try to show that somewhat random stimuli introduced into the design process are effective in promoting the usefulness of NP design output as evaluated by the users themselves. Two thinking processes linking random picture input to product usefulness will be examined: analogical transfer and mental simulation.
2. THEORETICAL BACKGROUND
The conceptual model used here suggests that the relation between random input and outcome usefulness is grounded in thinking processes involving analogy and mental simulation leading to inclusion of product features or user characteristics in the thinking of the designer. These content features and characteristics then cause the design solution to become more useful as perceived by the end user. It is possible to further specify the content needed in the random images, by looking at the individual mental processes used. The literature on two mental processes is reviewed: mental simulation and analogical transfer.
2.1. Mental simulation of users
One frequently used creative process in design involves mentally simulating events and entities under changed circumstances to support reasoning, understanding, and prediction (Gentner, Reference Gentner, Smelser and Bates2002), and reduce uncertainty (Christensen & Schunn, Reference Christensen and Schunn2009b). There are several competing paradigms of mental models (e.g., Kahneman & Tversky, Reference Kahneman, Tversky, Kahneman, Slovic and Tversky1982; Gentner & Stevens, Reference Gentner and Stevens1983; Johnson-Laird, Reference Johnson-Laird1983; Kuipers, Reference Kuipers1994; Gentner et al., Reference Gentner, Brem, Ferguson, Wolff, Ward, Smith and Vaid1997), but at a general level these theories are in agreement that in certain problem solving tasks humans reason by constructing a mental model of the situations, people, events, and processes in working memory that in dynamic cases can be manipulated through simulation (Nersessian, Reference Nersessian, Carruthers and Stich2002). In design, mental simulations serve as quick and cheap ways of exploring both new technical or functional features and end-user preferences and product interaction (simulating, e.g., usability). Both of these functions have been shown to occur very frequently in design (Christensen & Schunn, Reference Christensen and Schunn2009b). Although both types of simulations (technical/functional and end user) may reduce uncertainty, notably the latter has been linked to creative outcomes in the literature. Keeping the user front and center is essential to the design process (Dahl et al., Reference Dahl, Chattopadhyay and Gorn1999) because too many products are still being introduced that do not meet customer expectations (Bailetti & Litva, Reference Bailetti and Litva1995). Theories of user-centered design (e.g., Norman & Draper, Reference Norman and Draper1986), user involvement in design (e.g., Kujala, Reference Kujala2003), usability (e.g., Rubin, Reference Rubin1994) and user driven innovation (e.g., von Hippel, Reference von Hippel2005) all agree that the end user should be considered or involved in design. [In contrast, however, a few authors have argued that a strong market orientation may lead to imitations and marginally new products (Bennett & Cooper, Reference Bennett and Cooper1979) or cause companies to lose their industry leadership if they listen too carefully to customers (Christensen & Bower, Reference Christensen and Bower1996).] In this way designers try to incorporate information about user characteristics (such as abilities and interests) into creative processes in product innovation. In examining the impact of imagining end users on the resulting design, Dahl et al. (Reference Dahl, Chattopadhyay and Gorn1999) found that instructing designers to include the customer in imagination visual imagery during the design process has a greater positive effect on the usefulness of the designs produced than including the customer in memory visual imagery. An imagination image differs from a memory image in that, instead of recalling a prior experience for the image, a new, nonexperienced event is constructed. In two studies the results indicated, as the authors had hypothesized, that when the designers used imagination and visualized the customer, the outcome design solution was rated as more useful by the customers. Cuing random end-user information may lead the designers to simulate end-user preferences, behavior, and product interactions to explore and test the usefulness of the design solution at hand, leading perhaps to more useful products as evaluated by the users themselves. This line of argument led to the first hypothesis (H1):
H1: Random end-user or user context images will lead to increased levels of end-user willingness to use the resulting design solutions when compared to images of other people or to a control group receiving no pictures of people.
2.2. Analogical transfer
Of all of the techniques aimed at enhancing creativity, analogy use is probably the one with the most theoretical support. A possible explanation of how image input may influence creativity comes from the analogical transfer literature (e.g., Gick & Holyoak, Reference Gick and Holyoak1980; Forbus et al., Reference Forbus, Gentner and Law1994; Holyoak & Thagard, Reference Holyoak and Thagard1997). Analogy involves accessing and transferring elements from familiar categories to use them in constructing a novel idea, for example, in an attempt to solve a problem or explain a concept (Gentner, Reference Gentner, Bechtel and Graham1998), and is one of the central generative creative cognitive processes concerning similarity. A famous design anecdote illustrates how analogies work. George de Mestral allegedly developed Velcro after examining the seeds of the burdock plant that had attached themselves to the fur of his dog after a walk. Analogies thus transfer properties from what is termed the source (where the properties came from, e.g., burdock seed properties) to the target (the new solution, e.g., Velcro). Analogy has been argued to be a very important mechanism in the design process (e.g., Roozenburg & Eekels, Reference Roozenburg and Eekels1996; Casakin & Goldschmidt, Reference Casakin and Goldschmidt1999; Goldschmidt, Reference Goldschmidt, Eastman, McCracken and Newstetter2001). Empirical studies have also shown how providing (Jansson & Smith, Reference Jansson and Smith1991; Ward, Reference Ward1994; Marsh et al., Reference Marsh, Landau and Hicks1996; Marsh et al., Reference Marsh, Ward and Landau1999; Dahl & Moreau, Reference Dahl and Moreau2002; Jaarsveld & van Leeuwen, Reference Jaarsveld and van Leeuwen2005) or retrieving (Ward, Reference Ward1994) existing examples (sources) can lead to property transfers in generative tasks. Some of the empirical studies finding evidence for exemplar property transfer effects in generative tasks has used engineering design tasks (Jansson & Smith, Reference Jansson and Smith1991; Christiaans & Andel, Reference Christiaans and Andel1993; Dahl & Moreau, Reference Dahl and Moreau2002). For example, Jansson and Smith (Reference Jansson and Smith1991) had both students and professional designers work on simple design problems such as how to construct a car-mounted bicycle rack. While one group was provided a specific example, another control group was not. The group receiving the example included more properties from the examples into their own solutions, including problems with the exemplar design. Jansson and Smith (Reference Jansson and Smith1991) referred to this as design fixation. To account for some of these findings, Ward (Reference Ward1994, Reference Ward, Smith, Ward and Finke1995, Reference Ward, Holyoak, Gentner and Kokinov1998) proposed a path of least resistance (POLR) model stating that the default approach in tasks of imagination is to access a specific known entity or category exemplar, and then pattern the new entity after it.
However, not all examples are the same or lead to the same amount of property transfer, as the analogical transfer literature shows. One such distinction concerns the “distance” between source and target, which may be considered large or small. For example, a designer trying to develop a new type of blood bag in medical plastics may make an analogy to other blood bags in medical plastics (within-domain analogies), or make an analogy to Christmas decorations or shoes or credit cards in developing the design (between-domain analogies; Christensen & Schunn, Reference Christensen and Schunn2007; see also Vosniadou & Ortony, Reference Vosniadou, Ortony, Vosniadou and Ortony1989; Dunbar, Reference Dunbar, Sternberg and Davidson1995; Dunbar & Blanchette, Reference Dunbar and Blanchette2001). Both within- and between-domain analogizing is frequently used in design (Christensen & Schunn, Reference Christensen and Schunn2007). Research on analogy has consistently shown that transfer increases with similarity (e.g., Simon & Hayes, Reference Simon and Hayes1976; Holyoak & Koh, Reference Holyoak and Koh1987; Ross, Reference Ross1987, Reference Ross1989; Novick, Reference Novick1988). Structural similarity between source and target is closely related to analogical transfer (indeed, the structural similarity, or isomorphy, between source and target is the reason we refer to them as analogous). However, superficial similarity has been shown to be a strong predictor of analogical access (Holyoak & Kohl, 1987; Ross, Reference Ross1987; Novick, Reference Novick1988; Gentner et al., Reference Gentner, Rattermann and Forbus1993). Within-domain analogies and between-domain analogies have differential amounts of superficial similarity, with more superficial similarity for within-domain analogies. As such, within-domain sources may be easier to access when compared to between-domain sources (e.g., Holyoak & Kohl, 1987; Gentner et al., Reference Gentner, Rattermann and Forbus1993). Insofar as within-domain examples are available, the examples should then bias the designer's creation toward including some of the example features (Marsh et al., Reference Marsh, Landau and Hicks1996; Ward, Reference Ward, Holyoak, Gentner and Kokinov1998), making the resulting innovation structurally similar to the source. In an idea exposure paradigm, Nijstad et al. (Reference Nijstad, Stroebe and Lodewijkx2002) found that semantically homogenous stimulus led to more idea generation within a semantic domain (going in depth).
In addition, both types of analogies (within-domain and between-domain) contain structural similarity. However, because between-domain analogies makes a leap across product or domain boundaries, it may be more difficult ensuring effective and successful transfer as there may be hard to detect incompatible domain or product characteristics (Johnson-Laird, Reference Johnson-Laird, Vosniadou and Ortony1989).
Some empirical support for these links has been found in a real-world study of engineering design, showing that the reference to within-domain prototypes significantly reduced between-domain analogizing (Christensen & Schunn, Reference Christensen and Schunn2007). In an experimental study, Dahl and Moreau (Reference Dahl and Moreau2002) demonstrated that student designers exposed to one or several within-domain examples led to lower proportions of between-domain analogies. Another experiment using student designers by Perttula and Sipilä (Reference Perttula and Sipilä2007) showed how providing common (as opposed to unusual) examples of design solutions led to higher genealogical linkage between examples and generated concepts. Tentative empirical support for the link between within-domain sources and property transfer comes from experiments on visual analogy (Beveridge & Parkins, Reference Beveridge and Parkins1987; Casakin & Goldschmidt, Reference Casakin and Goldschmidt1999; Bonnardel & Marmèche, Reference Bonnardel and Marmèche2004), indicating that visual information can cause solution element transfers (for tentative evidence that experienced designers may sometimes evoke more between domain sources, see Bonnardel & Marmèche, Reference Bonnardel, Marmèche, Gero and Bonnardel2005). The theoretical and empirical accounts that within-domain analogies are accessed and used more frequently, considered more relevant and interesting, and constitute a path of less resistance compared to between-domain sources led to the second hypothesis (H2):
H2: Showing random images of within-domain products during the design process will lead to design solutions with more property transfer from source to target when compared to between-domain products or a control group receiving no product images.
Transferring proven elements and solutions that are perhaps well known to the customer into new design solutions may create products that are readily applicable and help increase both product functionality (drawing on proven design elements) and ensure that the customer intuitively understands how to use the solutions over fanciful or highly dissimilar design solutions. As such, benchmarking as a creative design technique (e.g., Ulrich & Eppinger, Reference Ulrich and Eppinger2000) may lead to increased outcome usefulness through property transfer. This led to the third hypothesis (H3):
H3: Random images of within-domain products will lead to design solutions with increased levels of end-user willingness to use when compared to images of between-domain products or to a control group receiving no images of products.
As argued, it is hypothesized that the driver of this increased usefulness is property transfer (H4):
H4: Increasing amounts of within-domain property transfer in the design solution will lead to elevated evaluations of end-user willingness to use.
3. STUDY 1
The experiment manipulated two experimental factors (images of products and images of people) in a between-subjects mixed design, to test the proposed hypotheses. The images of products had two levels (within-domain products vs. between-domain products), as did the images of people (end users in context vs. people in general). A single control condition was included in which subjects received neither manipulation, bringing the design to five cells [(2 product images × 2 people images) + 1 control]. Coding of the design solution content, and end-user evaluations of the design solutions served as the dependent variables
3.1. Materials
3.1.1. Pictures
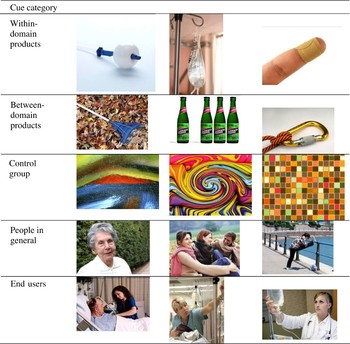
Initially 1000 pictures were chosen randomly from picture sites on the Internet and from databases with pictures from companies working in medical plastics. All pictures were in high resolution. These initial pictures were then coded by two independent coders in relation to the design problem statement at hand (see Appendix A) for whether they could be categorized as containing a dominant within- or between-domain product, and whether they contained either people or end users in context. Insofar as the images contained neither a product nor a person, they were included in the control group (in effect, this category consisted of images of abstract art). Interrater reliability for this coding had a κ value of 0.81. Only pictures that could be classified as belonging to a single category and where both coders agreed on this category were chosen for a restricted sample. From this restricted sample, 60 pictures were randomly selected for each category, amounting to a total of 300 pictures used in the experiment (see Fig. 1 for sample pictures).
Sample pictures from each image category. Note that the design domain concerned medical plastics and the end user was a nurse working in an ICU. Thus, within-domain products were from medical plastics, between-domain products were from other domains, and end users were nurses at work. [A color version of this figure can be viewed online at journals.cambridge.org/aie]

The pictures were then arranged into sets. Each set contained 30 pictures from one product category (within- or between-domain product), and 30 pictures from one people category (people in general or end users in context). A control group received 60 pictures with abstract art. The control group was shown images rather than no images to make the three conditions equal in terms of mental workload (i.e., because the images were shown during the time assigned to producing the design solution, a “no images” control condition would have had more time to work on their solution given they would not be dividing their attention between viewing pictures and solving the problem. This could have biased the results, in the favor of the control group). The ordering of the pictures was randomized.
3.1.2. Problem
The problem presented to the design students was chosen to represent a real-world innovation challenge, and was generated in cooperation with a large international company working on similar design problems in medical plastics at the moment. It was generated to be a realistic, complex, and somewhat detailed design problem with multiple specifications concerning both product use and technical functionality, and with no well-known or optimal solution readily available. The problem concerned generating a fecal collection solution for patients in intensive care units that would be functional to use for the intensive care unit (ICU) nurse (see Appendix A).
3.2. Subjects
Subjects were 63 (43 male, 20 female, mean age = 22) undergraduate engineering design students, specializing in “innovation and design,” who volunteered for participation. They were randomly assigned to conditions.
3.3. Procedure
Subjects worked individually seated in front of a 17-in. computer monitor at a distance of approximately 70 cm, and generated their design solution using pen and paper. They were instructed that they would have 30 min to complete a design problem, and that the solution should be written on a single “answer” sheet of paper, including both graphic illustrations and text explaining the design concept. Further, they were instructed that on the computer monitor would be pictures that they “could get inspiration from.” They were given the problem statement to read, and following the answer to any clarifying questions (provided by the experimenter), the slide show and time was started. In the slide show, each picture was presented for 10 s, shifting immediately to the next slide. The 10-s duration allowed enough time to scrutinize each picture in some detail, if the subjects wished to do so. The slide show was repeated three times, meaning that all pictures had been presented during the first 10 min of the slide show, and allowing the subject three tries to view each picture. As such, the picture slide show was running throughout the 30 min attributable to the experimental task. It was not possible to see the images again on request, and not possible either to view individual pictures for more than the 3 × 10 s it would appear during the slide show. After 30 min, the design solutions were collected by the experimenter.
The subjects were then given a questionnaire about their use of the pictures in the design process (“How inspiring were the pictures to you in producing your design solution?” and “How much did you use the pictures in your design solution” both on a 5-point rating scale from very little to very much), whether they could mention examples of images they had seen [“Mention some of the objects/people you saw on the images (listing multiple if possible)”—open ended], their evaluation of the usefulness of their own design solution (“Evaluate your design solution to the best of your abilities” on a 7-point rating scale ranging from useless to useful), and their guesses as to the purpose of the experiment (suspicion probe; “What do you think the purpose with this experiment was?”—open ended). The participants were also asked to indicate how many images they had looked at during the experiment on a 5-point scale ranging from none to all. Finally, participants were asked to indicate their age and gender. Upon completion of the questionnaire participants were thanked for their participation.
3.4. Evaluation of design solutions
The author and an independent coder blind to the purpose of the experiment rated each resulting design on the extent to which it contained and relied on the forms of within-domain products. This approach is similar to other attempts at estimating genealogical links with past examples (Goldschmidt, Reference Goldschmidt1995; Perttula & Sipilä, Reference Perttula and Sipilä2007). Specifically, here part sharing was used as a way of estimating property transfer. First, images of within domain products were examined, and typical design features of medical plastics products identified. Fifteen forms or materials highly prevalent in the within-domain image samples were chosen, including bandage, drop, bag, and tube, plastics, rubber, latex, and silicone. Second, each design was rated binarily for whether or not the 15 particular design features were included in the text or graphics of the solution. The 15 features were summed to a domain design measure where higher scores indicated more reliance on and use of within-domain products (i.e., more property transfers). Interrater reliability for the domain design measure was r = 0.93 (p < 0.001).
3.5. End-user evaluations
Thirteen ICU nurses with extensive real-life experience with the challenges concerning the design problem rated each of the 63 design solutions for their willingness to use the design solution. For each design they were asked to rate the statement “I would consider using this design if it was put into production” untimed on a 7-point Likert scale stretching from strongly disagree to strongly agree. The end-user evaluators were blind to picture categories and the purpose of the experiment, and received the design solutions in booklets randomized for ordering.
3.6. Results
3.6.1. Preliminary analyses
Manipulation checks showed that on a 5-point scale ranging from none to all, subjects on average reported having looked at the pictures somewhere between some and most (mean = 3.3). In no cases did subjects report not looking at the images. Furthermore, all subjects successfully named several examples of the images they viewed during the experiment. Responses to the open-ended question about what the subjects imagined the purpose of the experiment to be were examined. No participants were aware of the experimental hypotheses.
3.6.2. Test of hypotheses
Initially, a test was conducted to test whether the experimental pictures of products and people had a significant effect on outcome usefulness, compared to the control group. A t test with the end-user evaluations of willingness to use showed that the experimental groups combined had a slightly higher mean score (mean = 2.2) than did the control group, although this was not significant [mean = 1.9; t (804) = 1.824; p = 0.069].
Hypotheses H1 and H3 were tested by an analysis of covariance with the images of products (within- vs. between-domain vs. control group) and people (end users vs. people in general vs. control group) as the independent variables, and the end-users’ evaluations of their willingness to use the resulting design as the dependent variable, with end-user raters listed as a covariate. As hypothesized in H1, images of people significantly varied with willingness to use [F (1, 800) = 7.599; p < 0.006; ηp2 = 0.009]. Pairwise comparisons showed that images of end users in context (mean = 2.3) had significantly higher willingness to use scores than images of people in general (mean = 2.0; p < 0.006) or the control group (mean = 1.9; p < 0.006), and the people in general images did not significantly differ from the control group. This lends support to H1 in showing that subjects receiving images of users in their regular work context led to more willingness to use the design solutions than did the group receiving images of people in general or the control group.
As hypothesized in H3, images of products similarly significantly varied with willingness to use [F (1, 800) = 5.397; p < 0.03; ηp2 = 0.007]. Pairwise comparisons showed that images of within-domain products (mean = 2.3) had significantly higher willingness to use scores than did between-domain products (mean = 2.0; p < 0.02) or the control group (mean = 1.9; p < 0.009), whereas the between-domain products did not differ significantly from the control group. This lends support to H3 in showing that images of within-domain products led to more willingness to use the design solutions than did the images of between-domain products or images used in the control group.
Hypothesis H2 was tested by an analysis of variance (ANOVA) with the images of products (within- vs. between-domain vs. control group) as the independent variable, and the design domain measure as the dependent variable. As expected, a significant main effect for images of products was found [F (2, 60) = 7.551; p < 0.002; ηp2 = 0.20]. In pairwise comparisons within-domain product images had significantly higher design domain measures (mean = 2.2) than did both between-domain images (mean = 1.3; p < 0.02) and the control group (mean = 0.5; p < 0.001), whereas between-domain images and the control group did not differ significantly.
To test for H4 a regression analysis was conducted with the domain design measure as the independent variable, and willingness to use as the dependent variable. The design domain measure was significantly positively related to willingness to use (standardized regression coefficient β = 0.20; p < 0.001) in support of H4.
3.7. Discussion
Study 1 showed support for the hypothesis that random within-domain product images shown during the creative process can be used to increase property transfer, and that this property transfer will increase perceived usefulness of the design solution, as evaluated by end users’ willingness to use the product. As such, the within-domain product images led to more useful outcomes than did the control group or images of between-domain products. Further, support was found for the hypothesis that images of the end user would facilitate the end users’ willingness to use the resulting design over images of people in general or the control group. Given the circumstances that the experiment contained a realistic design problem, and made use of random images not specifically tailored for the design problem, it is highly encouraging that significant effects could still be detected. Apparently images of end users and within-domain products are effective in improving the usefulness of the resulting design product. It should be noted, however, that the end users’ average evaluation of their willingness to use the resulting design products was somewhat low. This probably testifies to the fact that student designers without specific knowledge of the design domain in question were used in the experiment, and further, that they were given a restricted amount of time for the task. Utilizing expert designers and providing them with more time may increase willingness to use scores in future experiments.
Study 1 did not test whether there were differences in the level of attention the designers would devote to each image category, nor to whether they saw some of the images as more inspiring than others. Theoretically, there is reason to believe that images of within-domain products may be special here. Popularly speaking, within-domain images may in effect be so effective at grapping the designer's attention as to overshadow the possible effect of other image categories. This explanation would be in line with POLR researchers arguing that when several routes to problem solving can be taken, the first choice will be to take the POLR. Perhaps within-domain products are simply low in resistance when it comes to design thinking when compared to the other picture categories. In a similar line, Dugosh and Paulus (Reference Dugosh and Paulus2005) argued that common stimuli (in the form of ideas) should overlap more than unique ones with the subject's associated network, and showed in a brainstorming experiment that common stimuli led to new ideas more often. Furthermore, they argued, common stimuli may be more valid and have more associative value than unique ones.
It is possible that the within-domain product pictures inadvertently were competing for attention with the people image categories, rather than being complementary to them. Even though effects were found for the end-user image category, it is possible that this effect would have been stronger without the presence of the within-domain product image category. Perhaps the tendency for within-domain products to lead to property transfers is so strong (has so little path resistance) as to reduce the effect of including the user. A second experiment was carried out to further test this hypothesis, this time focusing on the extent to which the image categories competed for attention and inspiration because of paths of resistance.
H5a: Random within-domain product images will attract more attention than images of between-domain products, end users, people in general, or abstract art.
H5b: Random within-domain product images will more often be chosen as the most inspirational when compared to images of between-domain products, end users, people in general, or abstract art.
4. STUDY 2
The experiment was a five (end users vs. people in general vs. within-domain product vs. between-domain product vs. abstract art) repeated measures design, with picture categories as the independent measure and response time and choice of which image is the most inspirational in line-ups with all five categories present as the dependent measures.
4.1. Materials
The same pool of images and materials used in study 1 was employed.
4.2. Subjects
Subjects were 16 male (mean age = 23) undergraduate engineering design students.
4.3. Procedure
Subjects worked individually in front of a computer and generated their design solution using pen and paper. Upon reading the design problem, they were asked to go self-paced through a number of images that they “could get inspiration from.” Subjects turned to the next image by pressing the spacebar, measuring response time. Each subject viewed 150 images. After viewing all images, the subjects were given 10 min to write down their design solution. Then the subjects were shown the same images as before, but this time in 30 lineups of five images each (consisting of one random image from each category), among which they had to select the one image they felt inspired them the most in their design solution. The line-up picture ordering (i.e., which category was shown first, second, etc.) was randomized. For each subject, we tallied how many times each category was chosen. Finally, the participants completed an open-ended question that asked them what they thought the study was about (suspicion probe) and their age and gender.
4.4. Results
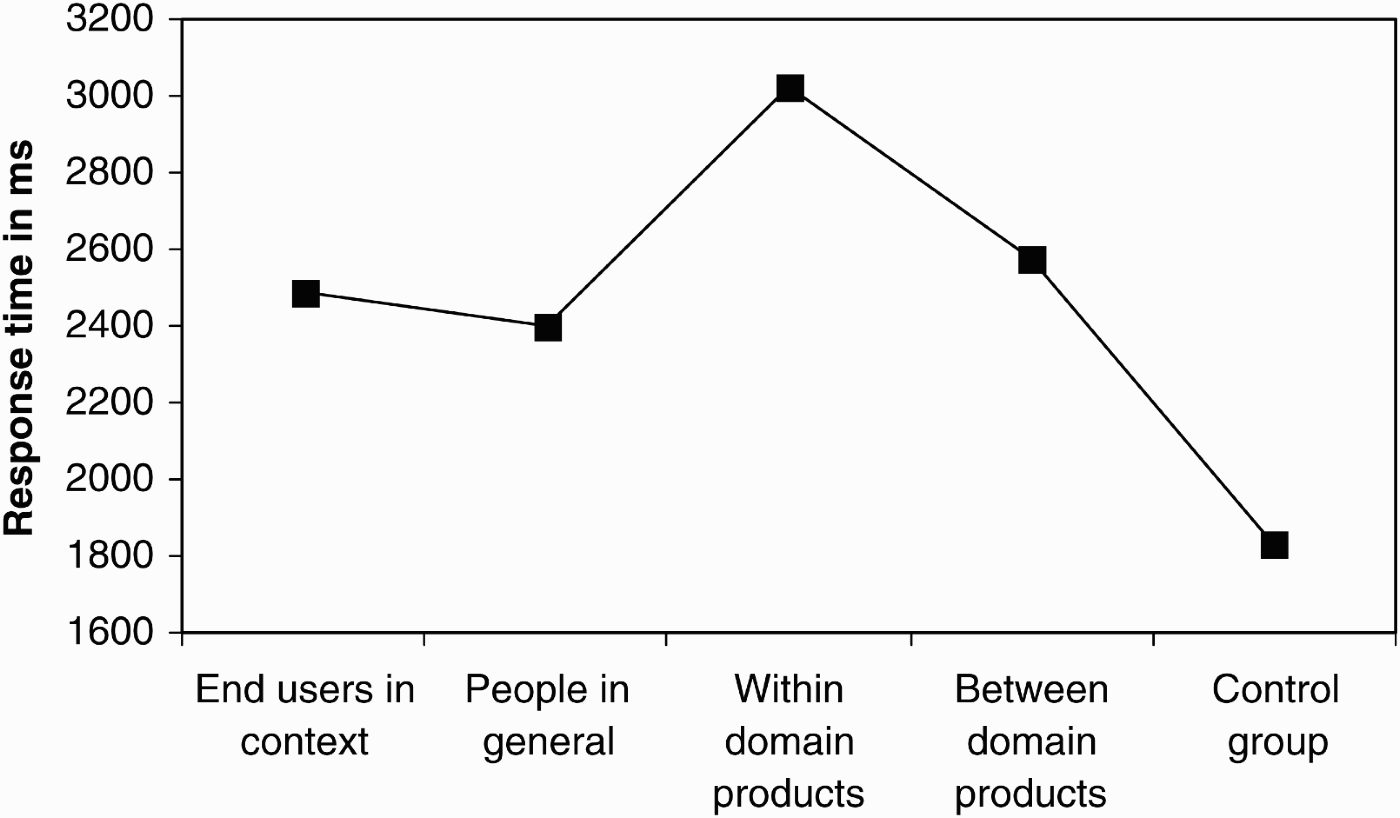
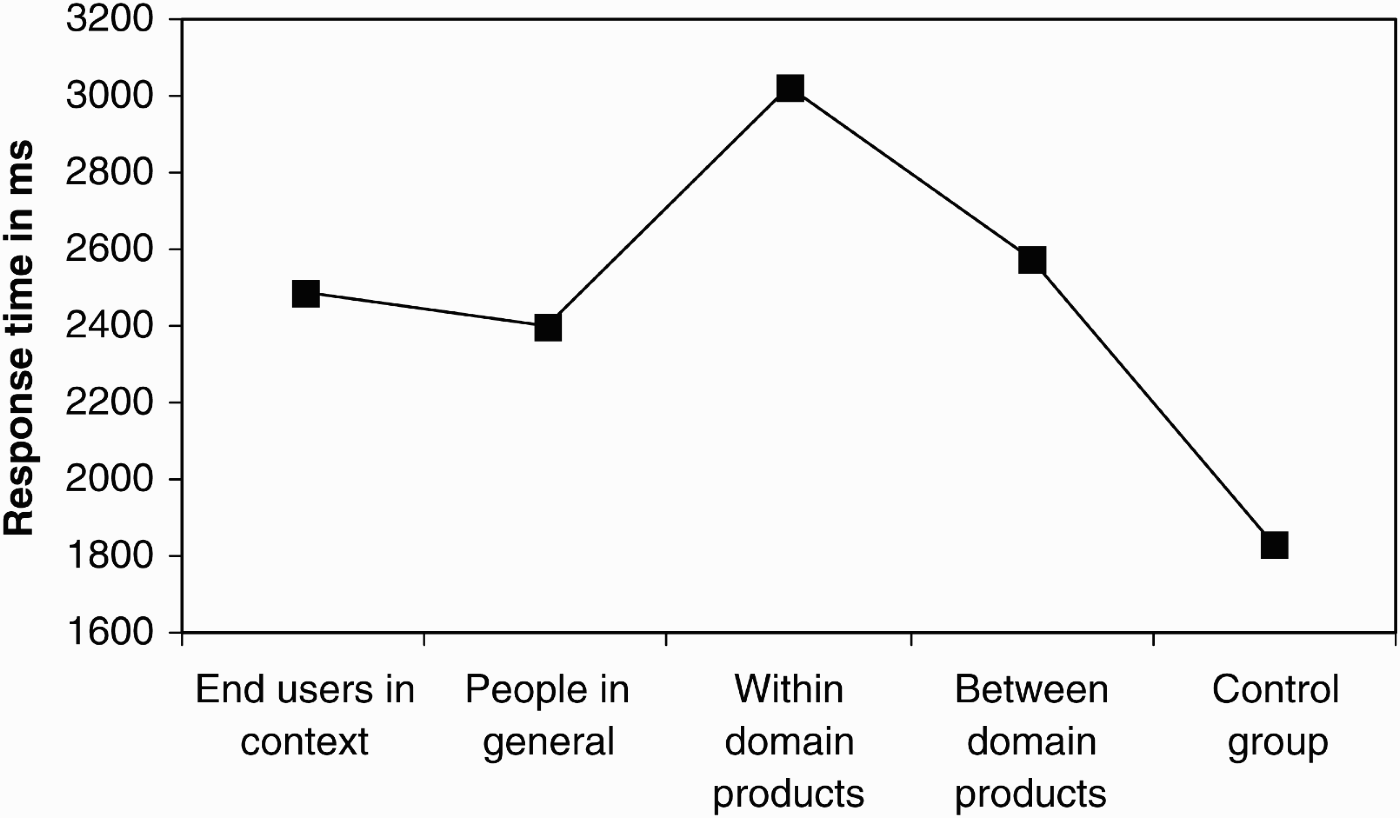
A repeated measures ANOVA [F (4, 60) = 21.56; p < 0.001; ηp2 = 0.59] of response time in the five image categories was run to test H5a. Within-domain products (mean = 3.0 s) were looked at significantly longer than any other picture category (ps < 0.02). The abstract art pictures used in the control group (mean = 1.8 s) were looked at less than any other picture category (ps < 0.001). The remaining three categories (between-domain products, mean = 2.6 s; people in general, mean = 2.4 s; end users in context, mean = 2.5) did not differ significantly from each other (see Fig. 2). This result is in support of hypothesis H5a.
The response time by image categories in study 2.
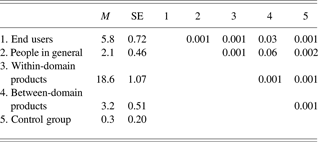
A repeated measures ANOVA [F (4, 60) = 98.748; p < 0.001; ηp2 = 0.87] of the tallies of how many images in each category that were chosen as most inspirational in the random line-ups was run to test hypothesis H5b. All pairwise comparisons are provided in Table 1. Within-domain products were chosen as the most inspirational significantly more often than any other group. The second most inspirational was the end-users category with higher inspiration scores than the remaining three categories. People in general and between-domain products did not differ significantly from each other, but they both superseded the abstract art images that had the fewest inspirational selections. This result is strongly in support of H5b.
Pairwise comparisons of number of pictures selected as most inspirational in five image line-ups by picture category in experiment 2
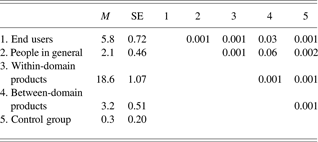
The values are means (M), standard errors (SE), and p values for pairwise comparisons of picture categories.
Because the subjects received two nonoverlapping sets of 150 images each, it was possible to do a reliability analysis between sets. In all sets, for both response time and selection line-ups, the within-domain product category had the highest mean score of all categories. Furthermore, in all but a single pairwise comparison, the within-domain product category was significantly higher than all other categories, even with the halved sample size. This attests to the high reliability of the strong designer preference for the within-domain product category over the other categories.
5. GENERAL DISCUSSION
Study 1 showed that random images of end users and within-domain products displayed during the design process led to increased usefulness in the resulting design solution as evaluated by end users’ level of willingness to use. Counter to previous studies focusing on the negative impact of exemplars on creative outcomes through decreased originality (e.g., Ward, Reference Ward1994; Dahl & Moreau, Reference Dahl and Moreau2002; Ward et al., Reference Ward, Patterson, Sifonis, Dodds and Saunders2002), the present experiments instead found a beneficial effect on creative outcome usefulness. Two different paths from image input to outcome usefulness were suggested. One path concerned within-domain products that lead to increased property transfer, making the resulting design solution more structurally similar to other within-domain products. The increased property transfer then led to increased usefulness in the resulting design, as evaluated by end-users’ level of “willingness to use.” The other path illustrated that images of end users in their regular context lead to an increase in users’ evaluations of willingness to use. As such, empirical support was found for both theoretically derived paths. Study 2 revealed that the image categories competed for the designers’ attention and inspiration, with within-domain products as the single most enticing category. The designers looked significantly longer at the within-domain product images than any other single image category, and they chose within-domain product images to be by far the most inspirational to their design solution.
Thus, the present set of experiments has shown a novel approach to ensure product usefulness in NP innovation: providing random images of the end users to designers during the design process is likely to lead to design products that are more useful to the end user.
The present research has focused on the usefulness of design objects, at the expense of looking at the other dimension hailed to be critical in creativity: originality or novelty. A cautionary note seems in order concerning the link to the distinction between radical and incremental innovations. Although elevating creative outcome usefulness may help ensure that the design object becomes functional for the user, it may not help the product stand out from the competition (e.g., by creating widely distinct and different solutions). As noted, it may be possible that the property transfer, identified here as a beneficial element in creativity (by increasing usefulness) may in effect also reduce the originality of the resulting solution. Using random stimuli in the creative process to increase within-domain property transfer may in effect thus lead to solutions that are only marginally original albeit highly useful (i.e., what is usefully termed incremental innovations). Previous research on exemplar influence on originality seems to point in that direction.
5.1. Contributions to managerial practice
The present experiment has taken a first step in trying to understand how random images may promote usefulness in creative design processes. However, it also carries practical implications for the management of product development and design processes. The technique pointed to in the present article is easy to apply: by strategically using random input in the early (idea-generating) stages of product innovation, it may be possible to increase the chances of reaching a useful creative outcome. The random input pointed to here concerns the use of stimuli of people and products. Furthermore, “product” may be specified to mean within-domain products that are effective in ensuring property transfers, thus increasing outcome usefulness. Images of people may focus on the end user, thus ensuring user inclusion in the resulting design and enhancing the chance of getting useful results. Strategically, the input of within-domain products should not be used in combination with the user input, as the effect of randomly cuing users may be swamped by the overshadowing within-domain product category. One may imagine all sorts of ways these stimuli may be implemented in design teams seeking useful results, from screen savers to posters to video installations to merely bringing a folder of suitable pictures to the design meeting (just to mention a few obvious applications using images as stimuli).
Concerning when to apply this methodology, a cautionary note seems in order: insofar as the purpose of the design process is to create radical innovations, then perhaps the presently identified approach of raising within-domain property transfer is not the way to go, unless originality of the outcome is sought or ensured in other ways (e.g., through other creative techniques). Cuing for property transfer with random within-domain products may in effect lead to only marginally original products or incremental innovations. Note that even though other techniques are applied aiming at enhancing originality, it remains possible that if they are used in combination with within-domain products, the alternative techniques may lose the battle of the designer's attention and inspiration to the enticing within-domain product category. Designers, like other creative professionals, may walk along the POLR in such cases.
6. LIMITATIONS AND FUTURE RESEARCH
Like any experiment, the present studies suffer from a number of limitations. Although the design problem used in the present study was realistic (as opposed to the artificially simple design problems usually employed in design experiments), the present experiment still made use of student designers without the experience of the product innovation professional. Furthermore, the time constraints imposed on coming up with a design were very tight (30 min); although it is not hypothesized that increasing design solution time would change the differences between experimental groups, it would be interesting to see whether a longer more realistic design period (with increased spacing between the random input) would change the present results. Future research may take several directions. The present study hypothesized that elements in the processes of analogical transfer and user mental simulation were causing the resulting effects of creative outcome usefulness. However, the types or degree of analogical transfer and mental simulation were not measured in the present study. Further research may apply think-aloud protocols to assess whether the random image categories indeed lead to the proposed mental processes. Finally, it should be examined whether it is possible to identify ways in which random stimuli may increase outcome originality and usefulness simultaneously.
Bo T. Christensen is an Associate Professor at Copenhagen Business School. He holds a PhD in cognitive psychology from the University of Aarhus, Denmark. He utilizes a cognitive psychology perspective to conduct research on design and other creative processes, using both experimental and ethnographic methods. Dr. Christensen has published in such journals as Design Studies, Memory & Cognition, Applied Cognitive Psychology, and Creativity Research Journal.
APPENDIX A: PROBLEM STATEMENT
A large producer of medical products has identified the need for a product that may help bedridden patients in ICUs. These patients can be of any age, and have typically been involved in accidents or serious illnesses. Therefore, they are mostly unconscious, immobile, and attached to medical devices such as heart rate monitors, respirators, and IVs. Because of the condition of the patients, they are normally not in control of their muscles; therefore, uncontrollable and liquid feces is a problem.
Furthermore, it is important that the product takes into consideration the busy workday of the ICU nurses who have to care of many different patients. It is therefore a big advantage if the product is easy, intuitive, and fast to use for the nurse and does not require time-consuming or hard to use devices to work. Studies of the needs and work life in ICUs indicate that the following criteria would be important to realize an innovative and efficient product. The product should be practical, safe to use, and take into consideration the patient's dignity and discretion.
You are asked to develop a product that may help solve the problem with the patient's feces and that takes both the patient's condition and the work of the ICU nurse into consideration.
Supplementary information: Bedsores have been identified as a frequently occurring problem, and the product should allow the patient to be turned on the side or solve this problem in other ways. Ideally, the patient should be able to sit up in bed with the product. Hygiene is also a major problem because bacteria in the feces create skin problems. The feces is not always liquid, and lumps may be up to approximately 2 cm. Furthermore, the volume of the feces varies a lot but is expected to be a maximum of 3 L/day.