Introduction
Scleractinian corals are responsible for building and maintaining the three-dimensional calcium carbonate matrix of the coral reef (Erez et al., Reference Erez, Reynaud, Silverman, Schneider, Allemand, Dubinsky and Stambler2011). The interactions between the coral host and its microalgal symbionts from family Symbiodiniaceae are crucial for the stability of the coral holobiont. However, the symbiotic relationship between the coral host and its microalgal symbionts is vulnerable to disturbances such as rising sea surface temperatures that accompany climate change (Hughes et al., Reference Hughes, Baird, Bellwood, Card, Connolly, Folke, Grosberg, Hoegh-Guldberg, Jackson, Kleypas, Lough, Marshall, Nyström, Palumbi, Pandolfi, Rosen and Roughgarden2003; Baird et al., Reference Baird, Bhagooli, Ralph and Takahashi2009; Hoegh-Guldberg & Bruno, Reference Hoegh-Guldberg and Bruno2010). Various factors contribute to the susceptibility of corals to stressors and the overall stress response. In the case of thermal stress, pre-existing variations due to acclimatization (Bellantuono et al., Reference Bellantuono, Hoegh-Guldberg and Rodriguez-Lanetty2011; Hume et al., Reference Hume, D'Angelo, Burt, Baker, Riegl and Wiedenmann2013), symbiont composition (Cziesielski et al., Reference Cziesielski, Liew, Cui, Schmidt-Roach, Campana, Marondedze and Aranda2018), and genetic variability (Bay & Palumbi, Reference Bay and Palumbi2014) all contribute to differences in susceptibility. The upregulation of stress-related genes prior to exposure to stress, or frontloading (Barshis et al., Reference Barshis, Ladner, Oliver, Seneca, Traylor-Knowles and Palumbi2013), may increase the resilience of corals that have been exposed to elevated temperatures for either short-term (Bellantuono et al., Reference Bellantuono, Hoegh-Guldberg and Rodriguez-Lanetty2011) or long-term (Hume et al., Reference Hume, D'Angelo, Burt, Baker, Riegl and Wiedenmann2013) periods prior to exposure to bleaching temperatures. The array of genes expressed by the host and symbionts in response to thermal stress, including genes involved in antioxidant systems, heat-shock proteins, calcium homeostasis, cytoskeletal reorganization, and genes with photoprotective properties such as fluorescent proteins (Salih et al., Reference Salih, Larkum, Cox, Kühl and Hoegh-Guldberg2000; Desalvo et al., Reference Desalvo, Voolstra, Sunagawa, Schwarz, Stillman, Coffroth, Szmant and Medina2008; Baird et al., Reference Baird, Bhagooli, Ralph and Takahashi2009; Mayfield et al., Reference Mayfield, Chan, Putnam, Chen and Fan2012; Deschaseaux et al., Reference Deschaseaux, Beltran, Jones, Deseo, Swan, Harrison and Eyre2014; Pinzon et al., Reference Pinzon, Kamel, Burge, Harvell, Medina, Weil and Mydlarz2015) support further differences in the observed response across coral species and even among individuals of the same species (Parkinson et al., Reference Parkinson, Banaszak, LaJeunesse and Baums2015). Of particular interest in this study are the fluorescent proteins, which are reported to confer various protective functions to the coral holobiont against environmental stressors (Schlichter et al., Reference Schlichter, Fricke and Weber1986; Salih et al., Reference Salih, Larkum, Cox, Kuhl, Hoegh-Guldberg, Greenwood and Hall1998, Reference Salih, Larkum, Cox, Kühl and Hoegh-Guldberg2000, Reference Salih, Cox, Szymczak, Coles, Baird, Dunstan, Mills and Larkum2006; Mazel et al., Reference Mazel, Lesser, Gorbunov, Barry, Farrell, Wyman and Falkowski2003; Bou-Abdallah et al., Reference Bou-Abdallah, Chasteen and Lesser2006; Matz et al., Reference Matz, Labas and Ugalde2006; Palmer et al., Reference Palmer, Modi and Mydlarz2009; Roth et al., Reference Roth, Latz, Goericke and Deheyn2010; Smith et al., Reference Smith, D'Angelo, Salih and Wiedenmann2013; Gittins et al., Reference Gittins, D'Angelo, Oswald, Edwards and Wiedenmann2015; Aihara et al., Reference Aihara, Maruyama, Baird, Iguchi, Takahashi and Minagawa2019).
The first green fluorescent protein (GFP) was discovered in the jellyfish, Aequorea victoria, as a component of a bioluminescent system with aequorin and luciferin (Shimomura, Reference Shimomura2005). Structural characterization of GFP revealed an 11-stranded β-barrel flanked by lids on both sides, enclosing a central α-helix (Ormö et al., Reference Ormö, Cubitt, Kallio, Gross, Tsien and Remington1996). The chromophore structure consists of a few well-conserved amino acid residues within the β-barrel. The glycine at position 67 and the tyrosine residue at position 66 are found in all naturally forming fluorescent proteins regardless of emitted colour (Barondeau et al., Reference Barondeau, Kassmann, Tainer and Getzoff2006; Chudakov et al., Reference Chudakov, Matz, Lukyanov and Lukyanov2010; Stepanenko et al., Reference Stepanenko, Stepanenko, Shcherbakova, Kuznetsova, Turoverov and Verkhusha2011, Reference Stepanenko, Stepanenko, Kuznetsova, Verkhusha and Turoverov2013). The residue at position 65 varies greatly among GFP-like proteins and affects the resulting chemical structure of the chromophore, as well as its spectral properties (Stepanenko et al., Reference Stepanenko, Stepanenko, Shcherbakova, Kuznetsova, Turoverov and Verkhusha2011). The chemical environment surrounding the chromophore also affects the spectral properties of the protein (Heim et al., Reference Heim, Prasher and Tsien1994; Follenius-Wund et al., Reference Follenius-Wund, Bourotte, Schmitt, Iyice, Lami, Bourguignon, Haiech and Pigault2003). Since the discovery of GFP, a variety of proteins with similar structures have been discovered in many other species (Shagin et al., Reference Shagin, Barsova, Yanushevich, Fradkov, Lukyanov, Labas, Semenova, Ugalde, Meyers, Nunez, Widder, Lukyanov and Matz2004; Stepanenko et al., Reference Stepanenko, Stepanenko, Kuznetsova, Verkhusha and Turoverov2013). The most abundant and colour diverse set of FPs, with a spectral range spanning cyan, green and red, as well as non-fluorescent chromoproteins, are found in class Anthozoa of Phylum Cnidaria (Verkhusha & Lukyanov, Reference Verkhusha and Lukyanov2004; Alieva et al., Reference Alieva, Konzen, Field, Meleshkevitch, Hunt, Beltran-Ramirez, Miller, Wiedenmann, Salih and Matz2008).
Fluorescent proteins contribute to the diversity of colours observed in coral reef organisms (Dove et al., Reference Dove, Hoegh-Guldberg and Ranganathan2001) and have been ascribed various roles. For example, green fluorescence emitted by GFPs promote symbiont phototaxis towards corals (Aihara et al., Reference Aihara, Maruyama, Baird, Iguchi, Takahashi and Minagawa2019) while cyan and green fluorescence are thought to counterbalance the brown colouration of symbiont pigments to make corals appear less palatable to herbivorous fishes (Matz et al., Reference Matz, Labas and Ugalde2006). FPs have also been linked to protective functions, which include photoprotection (Salih et al., Reference Salih, Larkum, Cox, Kuhl, Hoegh-Guldberg, Greenwood and Hall1998, Reference Salih, Larkum, Cox, Kühl and Hoegh-Guldberg2000, Reference Salih, Cox, Szymczak, Coles, Baird, Dunstan, Mills and Larkum2006; Roth et al., Reference Roth, Latz, Goericke and Deheyn2010; Smith et al., Reference Smith, D'Angelo, Salih and Wiedenmann2013) and photoacclimation (Roth et al., Reference Roth, Latz, Goericke and Deheyn2010; Smith et al., Reference Smith, D'Angelo, Salih and Wiedenmann2013; Gittins et al., Reference Gittins, D'Angelo, Oswald, Edwards and Wiedenmann2015). Autofluorescent coral species, such as Faviids, Agariciids and some Poritids, usually possess dense layers of fluorescent protein granules concentrated in large clusters above the symbionts to form a pigment screen that may protect against intense illumination (Salih et al., Reference Salih, Larkum, Cox, Kuhl, Hoegh-Guldberg, Greenwood and Hall1998), while these granules were found among or below the symbionts in dim light environments suggesting a light-enhancing role for photosynthesis through wavelength transformation and back scattering (Schlichter et al., Reference Schlichter, Fricke and Weber1986). The abundance of fluorescent proteins in corals living in both high light and dim light environments support a conserved, integral role of these proteins in managing the internal light environment of the coral holobiont through photoprotection and photoacclimation (Roth et al., Reference Roth, Latz, Goericke and Deheyn2010). Corals exhibit intraspecific variation in FP expression among individuals (Gittins et al., Reference Gittins, D'Angelo, Oswald, Edwards and Wiedenmann2015) and subpopulations (Takahashi-Kariyazono et al., Reference Takahashi-Kariyazono, Sakai and Terai2018), and across developmental stages (Kenkel et al., Reference Kenkel, Traylor, Wiedenmann, Salih and Matz2011), even under identical light environments. Variation among similar individuals may be due to differences in the number of FP gene copies or polymorphisms in the genome (Takahashi-Kariyazono et al., Reference Takahashi-Kariyazono, Sakai and Terai2018), as well as to differences in the regulation of FP expression (Gittins et al., Reference Gittins, D'Angelo, Oswald, Edwards and Wiedenmann2015).
Fluorescent proteins possess antioxidant properties and can eliminate reactive oxygen species and peroxides (Mazel et al., Reference Mazel, Lesser, Gorbunov, Barry, Farrell, Wyman and Falkowski2003; Bou-Abdallah et al., Reference Bou-Abdallah, Chasteen and Lesser2006; Palmer et al., Reference Palmer, Modi and Mydlarz2009) that are produced as a consequence of elevated temperatures and are the primary cause of coral bleaching (Lesser, Reference Lesser2006; Gardner et al., Reference Gardner, Raina, Ralph and Petrou2017). Purified recombinant GFP protein was demonstrated to have superoxide radical quenching activity that increased linearly with protein concentration (Bou-Abdallah et al., Reference Bou-Abdallah, Chasteen and Lesser2006). In addition, a significant positive correlation between in vivo peroxide scavenging rates and fluorescent protein concentration has been observed in Caribbean corals (Palmer et al., Reference Palmer, Modi and Mydlarz2009). Different fluorescent types of FPs exhibit varying levels of peroxide scavenging activity (Palmer et al., Reference Palmer, Modi and Mydlarz2009), suggesting that the FP complement in corals may be an important determinant of coral stress tolerance. However, the relationship between fluorescence, fluorescent protein concentrations, and stress has been studied in only a few coral species (Roth & Deheyn, Reference Roth and Deheyn2013). Further studies comparing the FP gene complement and FP expression in corals that are known to be susceptible or tolerant to stressors, such as elevated temperature, remain to be conducted.
This study thus aimed to identify FP transcripts in the corals Acropora digitifera (Dana, 1846), Favites colemani (Veron, 2000), Montipora digitata (Dana, 1846) and Seriatopora caliendrum (Ehrenberg, 1834) and to determine the response of selected transcripts to elevated temperature. A total of 16 transcripts putatively encoding FPs of different spectral types were identified by homology search from the transcriptomes of these corals. Real-time PCR (qPCR) revealed that the expression of selected FP transcripts varied among coral species subjected to elevated temperature conditions but did not show common trends correlating with duration of exposure.
Materials and methods
Coral collection and acclimation
Three colonies each of Acropora digitifera (16'17.287N 120'00.448E), Favites colemani (16'24.708N 119'54.270E), Montipora digitata (16'26.513N 119'56.494E) and Seriatopora caliendrum (16'22.293N 120'00.228E) were collected in November 2016 from various sites within the Bolinao-Anda Reef Complex, north-western Philippines, where each coral genus is abundant. These coral species are ranked based on increasing thermal bleaching susceptibility as follows: F. colemani < A. digitifera < M. digitata < S. caliendrum (Da-Anoy et al., Reference Da-Anoy, Cabaitan and Conaco2019). Based on regular monitoring by the Bolinao Marine Laboratory, sea surface temperatures within the reef complex range from 25–32 °C with annual mean temperature of 28.89 ± 0.90 °C and a maximum of 31–33 °C during the summer season. Shallow collection sites (2–9 m) had similar temperature profiles but some variation in light (~400–1250 lux). Sample collection was conducted with the permission of the Philippines Department of Agriculture Bureau of Fisheries and Aquatic Resources (DA-BFAR Gratuitous Permit no. 0102-15). Colonies at least 10–15 m apart horizontally were collected to minimize genotypic similarity, although validation of genotypes was not conducted. Corals were fragmented into 2.5–5.0 cm long nubbins and allowed to heal for 2 weeks in outdoor tanks with running seawater maintained at 28 ± 1 °C and illumination under low photosynthetic photon flux density of ~80–90 μmol m−2 s−1 on a 12:12 h light-dark cycle. Fragments were tagged to keep track of their colony of origin. Healed fragments were acclimated for 2 weeks in indoor experimental tanks with running seawater maintained at 28 ± 1 °C and illumination of ~80 μmol m−2 s−1 on a 12:12 h light-dark cycle.
Thermal stress experiment
Thermal stress experiments were conducted in 40 l tanks with constantly aerated, 10 μm-filtered flow-through seawater, as described in Da-Anoy et al. (Reference Da-Anoy, Cabaitan and Conaco2019). Two independent replicate tanks were used for each temperature treatment. Each tank received seawater from chilled reservoirs maintained at 27 °C and the temperature in individual experimental tanks was adjusted using submersible thermostat heaters. Flow rate was maintained at ~5–8 l h−1 with additional mixing provided by 600 l h−1 pumps. All setups received illumination under low photosynthetic photon flux density of ~80 μmol m−2 s−1 on a 12:12 light-dark cycle to avoid light stress. Light and temperature in each experimental tank were monitored using submersible loggers (Onset HOBO). 10–12 coral fragments of each species were quickly transferred into each experimental tank set at either elevated temperature (32 ± 1 °C, treatment) or ambient temperature (28 ± 1 °C, control). Although the thermal treatment does not approximate what happens in nature, it allows testing of the robustness of the response of each species to acute temperature shock, as has been done in other studies (Barshis et al., Reference Barshis, Ladner, Oliver, Seneca, Traylor-Knowles and Palumbi2013). Coral fragments were collected after 4, 24, 48 and 72 h and flash frozen in liquid nitrogen for storage and transport.
RNA extraction and sequencing
Coral fragments frozen in liquid nitrogen were ground into a fine powder using a mortar and pestle. Total RNA was extracted using TRIzol Reagent (Invitrogen) following the manufacturer's instructions. Contaminating DNA was removed using the TURBO DNA-free Kit (Invitrogen). RNA concentration was measured using a NanoDrop 2000c spectrophotometer (ThermoScientific) and quality was checked by gel electrophoresis. Libraries were prepared using the Illumina TruSeq RNA Sample Prep Kit. A total of 12 libraries were constructed for each species with three replicates each of the control and heated samples from the 4 and 24 h timepoints. Acropora digitifera and S. caliendrum libraries were sequenced on the HiSeq 2500 platform at BGI Genomics, Hong Kong, while M. digitata and F. colemani were sequenced on the HiSeq 4000 platform at Macrogen, South Korea. Sequencing generated 100 bp paired-end reads. Transcriptomes were assembled de novo using Trinity (Grabherr et al., Reference Grabherr, Haas, Yassour, Levin, Thompson, Amit, Adiconis, Fan, Raychowdhury, Zeng, Chen, Mauceli, Hacohen, Gnirke, Rhind, di Palma, Birren, Nusbaum, Lindblad-Toh, Friedman and Regev2011). Transcript abundance estimation was performed by mapping individual paired-end reads back to the reference transcriptome assembly using RNASeq by Expectation Maximization (RSEM) (Li & Dewey, Reference Li and Dewey2011) with the Bowtie alignment method (Langmead et al., Reference Langmead, Trapnell, Pop and Salzberg2009). Analysis of differentially expressed genes was conducted using the edgeR (Robinson et al., Reference Robinson, McCarthy and Smyth2010) package in R. Transcript abundance expressed as transcripts per million reads (TPM) was generated in RSEM and used for visualization of FP gene expression. De novo transcriptome assemblies have been deposited at DDBJ/EMBL/GenBank under the following accessions: GIVI00000000 (A. digitifera), GIVN00000000 (F. colemani), GIVM00000000 (M. digitata) and GIVG00000000 (S. caliendrum). Sequence reads are available from NCBI under the following BioProject accessions: PRJNA421253 (A. digitifera), PRJNA422022 (F. colemani), PRJNA422015 (M. digitata) and PRJNA422012 (S. caliendrum).
Identification of putative FPs in corals
Known coral FP sequences from Alieva et al. (Reference Alieva, Konzen, Field, Meleshkevitch, Hunt, Beltran-Ramirez, Miller, Wiedenmann, Salih and Matz2008) were used as query to identify similar sequences in the translated transcriptomes of A. digitifera, F. colemani, M. digitata and S. caliendrum using the blastp algorithm of Basic Local Alignment Search Tool (BLAST) at an E-value cutoff of 1 × 10⁻⁵. Peptides were aligned in BioEdit (Hall, Reference Hall1999) using ClustalW (Thompson et al., Reference Thompson, Higgins and Gibson1994) (Supplementary File S1). Alignments were visualized using CLC Sequence Viewer 8 (QIAGEN Bioinformatics) and used to identify the presence of a chromophore region, along with diagnostic residues for chromophore maturation and structure stability. Domains were identified by mapping predicted peptides against the Pfam 32.0 seed database (El-Gebali et al., Reference El-Gebali, Mistry, Bateman, Eddy, Luciani, Potter, Qureshi, Richardson, Salazar, Smart, Sonnhammer, Hirsh, Paladin, Piovesan, Tosatto and Finn2019) using HMMER v3.2.1 (Eddy, Reference Eddy1998) accessed with Cygwin v2.11.2 (Lazenby, Reference Lazenby2000). To estimate the average expression of FPs and allow comparisons across species, we obtained the log2-transformed expression value for each FP (TPMFP) normalized against the average expression value of selected reference genes (mean TPMREF) in each sample using the equation below.
 $${\rm Average}\;{\rm FP}\;{\rm expression} = \left({{\rm lo}{\rm g}_ 2{\rm \;}\left({\left({\displaystyle{{{\rm TP}{\rm M}_{{\rm FP}}} \over {{\rm mean}\;{\rm TP}{\rm M}_{{\rm REF}}}} \times 10\comma \;000} \right) + 1} \right)} \right)$$
The list of reference genes and expression normalization method were adapted from Takahashi-Kariyazono et al. (Reference Takahashi-Kariyazono, Sakai and Terai2018). Transcripts corresponding to each reference gene were identified using corresponding accessions from EggNOG (Jensen et al., Reference Jensen, Julien, Kuhn, von Mering, Muller, Doerks and Bork2008) or COG (Tatusov et al., Reference Tatusov, Galperin, Natale and Koonin2000) (Table S1). Only reference genes common across all four coral species were included in the analysis.
Phylogenetic analysis
Nucleotide sequences of FP genes were aligned with other FP sequences retrieved from Alieva et al. (Reference Alieva, Konzen, Field, Meleshkevitch, Hunt, Beltran-Ramirez, Miller, Wiedenmann, Salih and Matz2008), the NCBI non-redundant nucleotide database, and from the ReefGenomics database (Liew et al., Reference Liew, Aranda and Voolstra2016) (Table S2). Nucleotide sequences were aligned using ClustalW (Thompson et al., Reference Thompson, Higgins and Gibson1994) and ambiguous positions were trimmed using Gblocks (Castresana, Reference Castresana2000). A total of 130 sequences were included in the alignment (Supplementary File S2). The appropriate model of evolution was identified as GTR + G + I (Tavare, Reference Tavare1986) as indicated by MEGA7 (Kumar et al., Reference Kumar, Stecher and Tamura2016). Phylogenetic analysis was performed using MrBayes (Huelsenbeck & Ronquist, Reference Huelsenbeck and Ronquist2001) with arthropod FP sequences as outgroup. The MCMC chain was run for 1,000,000 iterations with a sample frequency of 100 resulting in 10,000 trees, of which the first 2500 were discarded while summarizing the data.
Quantitative real-time PCR assay (qPCR)
cDNA was produced by reverse transcription using the GoScript™ (Promega) kit. Briefly, 3 μl of total RNA was mixed with 1 μl each of 500 μg ml−1 oligo(dT) and random hexamer primers, incubated at 70 °C for 5 min then on ice for 5 min. 15 μl of reverse transcription reaction mix was added (4.5 μl nuclease-free water, 4 μl 10 × GoScript™ reaction buffer, 4 μl 25 mM MgCl2, 1.0 μl 0.5 mM nucleotide mix, 0.5 μl 40 U μl−1 Recombinant RNasin® Ribonuclease Inhibitor, and 1 μl GoScript™ Reverse Transcriptase) and samples were incubated at 25 °C for 5 min, then at 42 °C for 1 h on a PCR heat block. cDNAs were stored at −20 °C. Primers for qPCR were designed using Primer-BLAST (Ye et al., Reference Ye, Coulouris, Zaretskaya, Cutcutache, Rozen and Madden2012) against selected FP transcripts exhibiting the highest mean expression in each coral species (Table S3). Note that FP transcripts in A. digitifera and S. caliendrum have overlapping sequences and can be amplified by the same primer set for each species. qPCR reactions were performed on a CFX96 Touch™ Real-Time PCR Detection System with activation at 95 °C for 2 min, denaturation at 95 °C for 30 s, and annealing/elongation at 60 °C for 1 min. Each reaction contained 5 μl of 2 × GoTaq® (Promega) qPCR Master Mix, 0.5 μl each of 10 μM forward and reverse primers, 1 μl template cDNA, and 3 μl nuclease-free H2O. Three biological replicates and three technical replicates were used in the quantitation of each gene alongside negative controls. Primer efficiency and primer specificity were assessed using the dilution curves and melt curves, respectively. The abundance of target transcripts was determined from primer-specific relative standard curves generated using 10-fold serial dilutions of coral cDNA (Figure S1). Target transcript abundances were normalized to actin as a reference gene. Actin has previously been used as a reference gene in other cnidarian gene expression studies (Rodriguez-Lanetty et al., Reference Rodriguez-Lanetty, Phillips and Weis2006; Gajigan & Conaco, Reference Gajigan and Conaco2017) and its expression was unchanged in the temperature treatments. Mann–Whitney U tests (Mann & Whitney, Reference Mann and Whitney1947) were used to compare the relative fold change in expression of treated vs control samples. Statistical analyses were conducted in R v. 3.5.1 (R Core Team, 2013) using the base statistical package.
Results
Identification of putative FPs in corals
Eight FP transcripts were identified in F. colemani, two in A. digitifera, three in M. digitata and three in S. caliendrum. Some transcripts had similar sequences and common best BLAST hits (Table 1) indicating that they are transcript fragments from the same gene. Most of the transcripts encoded partial FPs with predicted peptide lengths ranging from 119–280 amino acids, which may be attributed to incomplete assembly of sequences in the transcriptome. Nevertheless, each of the peptides had a domain with significant similarity (E-value ≤ 6.70 × 10⁻²⁰) to GFP (PF01353.22) in the PFAM database.
Top nucleotide BLAST alignments of the putative FP coding sequences from A. digitifera, F. colemani, M. digitata and S. caliendrum against the NCBI non-redundant database and HMMER domain matches of the translated sequences to the Pfam 32.0 seed database

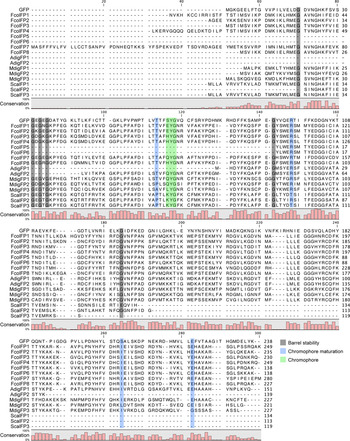
Alignment of the 16 FP peptides revealed extensive sequence similarity to Aequorea victoria GFP (P42212) (Figure 1). Glycine residues necessary for the stability of the β-barrel structure (Fu et al., Reference Fu, Kanno, Liang, Matzke and Matzke2015) were observed in most of the FP sequences, although some positions were not represented in the partial sequences of FcolFP7, ScalFP1 and ScalFP2. Residues necessary for chromophore maturation, specifically Thr62 (Yang et al., Reference Yang, Moss and Phillips1996), Arg96 (Sniegowski et al., Reference Sniegowski, Lappe, Patel, Huffman and Wachter2005), Ser205 (Ormö et al., Reference Ormö, Cubitt, Kallio, Gross, Tsien and Remington1996) and Glu222 (Sniegowski et al., Reference Sniegowski, Lappe, Patel, Huffman and Wachter2005) were also found in the majority of the FP sequences. Chromophore residues aligning with positions 65–67 of GFP, which are essential for fluorescence (Barondeau et al., Reference Barondeau, Kassmann, Tainer and Getzoff2006; Stepanenko et al., Reference Stepanenko, Stepanenko, Shcherbakova, Kuznetsova, Turoverov and Verkhusha2011, Reference Stepanenko, Stepanenko, Kuznetsova, Verkhusha and Turoverov2013), were present in all sequences except in the incomplete sequences of AdigFP1, FcolFP5 and FcolFP6.
Alignment of the fluorescent protein (FP) peptide sequences from Acropora digitifera, Favites colemani, Montipora digitata and Seriatopora caliendrum with Aequorea victoria GFP. Positions necessary for FP activity, including the putative chromophore triad (green box), glycine residues for structural integrity (grey boxes), and residues needed for chromophore maturation (blue boxes), are shown. A histogram indicating the conservation at each position is shown below the sequence alignment. See Supplementary Material File S1 for the peptide alignment.

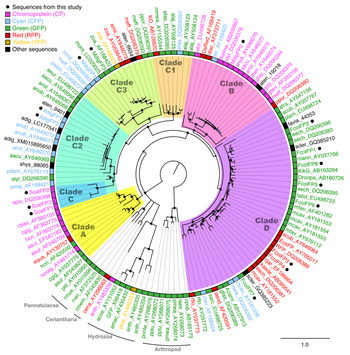
Although the presence of specific chromophore residues can be informative in predicting the spectral properties of an FP, interactions within the β-barrel (Stepanenko et al., Reference Stepanenko, Stepanenko, Kuznetsova, Verkhusha and Turoverov2013) and external factors such as pH (Chudakov et al., Reference Chudakov, Matz, Lukyanov and Lukyanov2010) also affect the resulting excitation and emission spectra. Thus, in this study we looked at both chromophore sequences and phylogenetic evidence to infer the potential spectral properties of candidate coral FPs. Phylogenetic analysis of the 16 coral FPs identified in this study revealed their affiliation with different FP clades (Figure 2) that represent groupings based on both taxonomy and predicted fluorescence types (Alieva et al., Reference Alieva, Konzen, Field, Meleshkevitch, Hunt, Beltran-Ramirez, Miller, Wiedenmann, Salih and Matz2008). A total of eight FP transcripts were found in the transcriptome of F. colemani, with 6 complete and 2 incomplete sequences. All the transcripts clustered in clade D with other faviid FPs. FcolFP1 was 99% identical to a green FP from an unknown scleractinian coral (GQ385210.1: Gruber et al., Reference Gruber, DeSalle, Lienau, Tchernov, Pieribone and Kao2009) and a green FP from Echinophyllia echinata (DQ206383: Alieva et al., Reference Alieva, Konzen, Field, Meleshkevitch, Hunt, Beltran-Ramirez, Miller, Wiedenmann, Salih and Matz2008). FcolFP2 closely clustered with another faviid sequence from ReefGenomics (Favia sp. 44353: Bhattacharya et al., Reference Bhattacharya, Agrawal, Aranda, Baumgarten, Belcaid, Drake, Erwin, Foret, Gates, Gruber, Kamel, Lesser, Levy, Liew, MacManes, Mass, Medina, Mehr, Meyer, Price, Putnam, Qiu, Shinzato, Shoguchi, Stokes, Tambutté, Tchernov, Voolstra, Wagner, Walker, Weber, Weis, Zelzion, Zoccola and Falkowski2016) and its sequence was 92.4% identical to a green fluorescent FP from Platygyra lamellina (EU498724.1: Alieva et al., Reference Alieva, Konzen, Field, Meleshkevitch, Hunt, Beltran-Ramirez, Miller, Wiedenmann, Salih and Matz2008). FcolFP5 and FcolFP6 grouped with green FPs from E. echinata (DQ206395: Alieva et al., Reference Alieva, Konzen, Field, Meleshkevitch, Hunt, Beltran-Ramirez, Miller, Wiedenmann, Salih and Matz2008) and Favites abdita (EU498723: Alieva et al., Reference Alieva, Konzen, Field, Meleshkevitch, Hunt, Beltran-Ramirez, Miller, Wiedenmann, Salih and Matz2008). FcolFP7, the longest translated sequence described in this study at 280 aa, had a nucleotide sequence with 85.1% identity to green FP from an unknown scleractinian coral (GQ385223.1: Gruber et al., Reference Gruber, DeSalle, Lienau, Tchernov, Pieribone and Kao2009) and grouped with cyan FPs from Montastraea cavernosa (AY181556) and Mycedium elephantotus (DQ206382). FcolFP8 clustered with green FPs KikG from Dipsastraea favus (AB193294) and Montastraea annularis (AY037766). FcolFP3 and FcolFP4 both clustered closely with a red FP from M. elephantotus (DQ206386: Alieva et al., Reference Alieva, Konzen, Field, Meleshkevitch, Hunt, Beltran-Ramirez, Miller, Wiedenmann, Salih and Matz2008). Both FcolFP1 and FcolFP2 have the EYG chromophore, while FcolFP3, FcolFP4 and FcolFP8 have HYG, and FcolFP7 has QYG (Figure 1). These data suggest that FcolFP1, FcolFP2, FcolFP5, FcolFP6, FcolFP7 and FcolFP8 are transcripts for green fluorescent proteins while FcolFP3 and FcolFP4 encode red fluorescent proteins.
Bayesian phylogenetic tree showing the relationship amongst fluorescent proteins. FPs with known spectral type are shown in colour (green, GFP; red, RFP; cyan, CFP; yellow, YFP; pink, chromoprotein). Sequences described in this study are marked by black dots and coloured based on their predicted spectral type. Other FP sequences retrieved from the Reefgenomics 20-species comparative database are shown in black text. Clades are based on designations by Alieva et al. (Reference Alieva, Konzen, Field, Meleshkevitch, Hunt, Beltran-Ramirez, Miller, Wiedenmann, Salih and Matz2008). Circles at the nodes indicate posterior probability >0.75. Arthropod FPs are shown as the outgroup. See Supplementary Material Table S2 for the list of accession numbers and species and Supplementary Material File S2 for the trimmed nucleotide alignment.

The two FP transcripts from A. digitifera, AdigFP1 and AdigFP2, clustered among other Acropora cyan FP sequences in clade C2 (Figure 2). These FPs displayed significant sequence similarity to a predicted FP from the genome of A. digitifera (XM_015895650), a short/middle wavelength-emitting fluorescent protein FP2 S1603 2 (LC177541.1) identified from the same species (Takahashi-Kariyazono et al., Reference Takahashi-Kariyazono, Gojobori, Satta, Sakai and Terai2016), and to cyan FPs from A. nobilis (AY646071, AY646072: Alieva et al., Reference Alieva, Konzen, Field, Meleshkevitch, Hunt, Beltran-Ramirez, Miller, Wiedenmann, Salih and Matz2008). The sequences of AdigFP1 and AdigFP2 were also similar to amFP486 (XM_029357520.1), a cyan fluorescent protein from A. millepora (Table 1). Similar to its closest neighbouring cyan FPs in clade C2, AdigFP2 has a QYG chromophore (Figure 1). Altogether, these data suggest that AdigFP1 and AdigFP2 encode cyan fluorescent proteins.
Three transcripts potentially encoding full-length FPs were found in the transcriptome of M. digitata. MdigFP1 and MdigFP2 grouped into clade C3 (Figure 2). MdigFP1 was most closely affiliated with cyan FPs from M. millepora (DQ206392) and M. efflorescens (DQ206381: Alieva et al., Reference Alieva, Konzen, Field, Meleshkevitch, Hunt, Beltran-Ramirez, Miller, Wiedenmann, Salih and Matz2008). The MdigFP2 sequence was 98.8% identical to a chromoprotein from M. efflorescens (DQ206377.1: Alieva et al., Reference Alieva, Konzen, Field, Meleshkevitch, Hunt, Beltran-Ramirez, Miller, Wiedenmann, Salih and Matz2008; Table 1) and it grouped with other chromoproteins in clade B (Figure 2). MdigFP3, on the other hand, clustered with a green FP from Montipora sp. (LC029025: Takahashi-Kariyazono et al., Reference Takahashi-Kariyazono, Satta and Terai2015). MdigFP1 and MdigFP2 have the QYG chromophore whereas MdigFP3 has LYG (Figure 1). These data suggest that MdigFP1, MdigFP2 and MdigFP3 encode a cyan FP, a chromoprotein, and a green FP, respectively.
The three partial transcripts from S. caliendrum encoded incomplete FPs, all with significant BLAST matches to a chromoprotein from Stylophora pistillata (DQ206398.1: Alieva et al., Reference Alieva, Konzen, Field, Meleshkevitch, Hunt, Beltran-Ramirez, Miller, Wiedenmann, Salih and Matz2008) and a fluorescent chromoprotein homologue of amFP486 also from S. pistillata (XM_022922450.1; Table 1). Their respective nucleotide sequences clustered on the branch marked clade C within clade C2. Like the sequence from S. pistillata, all three S. caliendrum sequences possessed the KYG chromophore (Figure 1). As such, these data suggest that these transcripts encode the same chromoprotein.
Quantitation of FP expression and changes during thermal stress
At ambient temperature conditions, the F. colemani green FP transcripts exhibited the greatest abundance compared with FP transcripts in other coral species (Figure 3A). In coral fragments that had been subjected to 32 ± 1 °C or 28 ± 1 °C for 4, 24, 48 and 72 h, the selected FPs exhibited different expression patterns (Figure 3B). The green FP transcript FcolFP7 was upregulated by 134-fold at 24 h, remained highly expressed by 20-fold at 48 h, but was downregulated by 0.004-fold at 72 h of exposure. Expression of A. digitifera cyan FP transcripts were significantly upregulated by 11.33-fold in heated samples relative to controls at 4 h of exposure then were downregulated at 24 h, with a 0.33-fold decrease in expression at 48 h, before returning to basal levels. The M. digitata green FP transcript MdigFP3 was already downregulated at 24 h, with a 0.06-fold reduction in expression by 48 h, before returning to near basal levels at 72 h. The S. caliendrum transcripts remained close to basal levels throughout the temperature exposure but showed a significant 8.10-fold upregulation in heated samples relative to controls at the 48 h time point. Significant changes in expression did not correspond to changes in photochemical efficiency reported in the study of Da-Anoy et al. (Reference Da-Anoy, Cabaitan and Conaco2019) (Table S4).
Expression of FP transcripts in coral species. Species have been ordered by thermal bleaching susceptibility (leftmost, least susceptible; rightmost, most susceptible). (A) Average expression of FP transcripts based on transcriptome data from corals maintained at the control temperature of 28 °C. Values (N = 6) are presented as log2 of transcripts per million (TPM) + 1. TPM values for each transcript were normalized to the mean expression of reference genes. The species from where the transcripts were identified is indicated above the graph. (B) Average expression of selected transcripts in corals subjected to elevated temperature. Transcripts amplified by the qPCR primers are indicated above the graph. Some primer pairs target similar transcripts, and were thus grouped together. Values are presented as log2 fold change in expression for samples subjected to 32 °C treatments relative to 28 °C controls for 4, 24, 48 and 72 h (N = 3). Expression values were normalized to the actin transcript as reference. Asterisks indicate statistically significant comparisons between treatment and control groups (Mann–Whitney U test, α = 0.10). Bars are coloured according to predicted fluorescence types. Error bars indicate standard deviation.

Discussion
In this study, we identified a total of 16 transcripts coding for FPs in the adult transcriptomes of four scleractinian corals. Based on their chromophore sequences and phylogenetic clustering, these FP transcripts are predicted to encode FPs with different spectral properties. Although many of the sequences obtained from de novo transcriptome assembly were partial or incomplete, structural glycine residues (Fu et al., Reference Fu, Kanno, Liang, Matzke and Matzke2015) were highly conserved, indicating that the protein products would be able to form stable barrel structures. In addition, most of the sequences possessed the conserved tyrosine and glycine amino acids within the chromophore triad (Chudakov et al., Reference Chudakov, Matz, Lukyanov and Lukyanov2010; Stepanenko et al., Reference Stepanenko, Stepanenko, Shcherbakova, Kuznetsova, Turoverov and Verkhusha2011, Reference Stepanenko, Stepanenko, Kuznetsova, Verkhusha and Turoverov2013).
Fluorescent proteins in A. digitifera have been thoroughly examined (Takahashi-Kariyazono et al., Reference Takahashi-Kariyazono, Sakai and Terai2018), while fluorescent colourmorphs and three different FPs have been observed in M. digitata (Klueter et al., Reference Klueter, Loh, Hoegh-Guldberg and Dove2006). However, little is known about the FPs of F. colemani and S. caliendrum. The number of FP sequences per species that we identified is relatively fewer than the 25 fluorescent protein genes, including short, middle and long wavelength-emitting proteins, and non-fluorescent GFP-like proteins, that were identified in the genome of A. digitifera (Takahashi-Kariyazono et al., Reference Takahashi-Kariyazono, Gojobori, Satta, Sakai and Terai2016, Reference Takahashi-Kariyazono, Sakai and Terai2018). Identification of fewer FPs transcripts from the de novo transcriptome assemblies may be due to varied expression of FPs depending on life stage (Roth et al., Reference Roth, Fan and Deheyn2013; Takahashi-Kariyazono et al., Reference Takahashi-Kariyazono, Sakai and Terai2018), tissue type (Salih et al., Reference Salih, Larkum, Cox, Kuhl, Hoegh-Guldberg, Greenwood and Hall1998) or environmental conditions (Roth et al., Reference Roth, Latz, Goericke and Deheyn2010; Hume et al., Reference Hume, D'Angelo, Burt, Baker, Riegl and Wiedenmann2013). For example, Seriatopora hystrix exhibits a shift from green to cyan FPs as it develops from larvae to adult (Roth et al., Reference Roth, Fan and Deheyn2013). Corals also exhibit fluorescent colour polymorphisms among individuals, subpopulations and across developmental stages (Kenkel et al., Reference Kenkel, Traylor, Wiedenmann, Salih and Matz2011; Strader et al., Reference Strader, Aglyamova and Matz2016; Takahashi-Kariyazono et al., Reference Takahashi-Kariyazono, Sakai and Terai2018). Such variation among similar individuals may be attributed to presence-absence polymorphisms or gene dosage effects, and are thought to contribute to the ability of corals to acclimatize to variable light environments (Gittins et al., Reference Gittins, D'Angelo, Oswald, Edwards and Wiedenmann2015; Takahashi-Kariyazono et al., Reference Takahashi-Kariyazono, Sakai and Terai2018). As such, it is possible that the corals in this study possess more FP variants that are not constitutively expressed, warranting further analysis of their genomes, as well as expression in other tissues and growth conditions.
The diversity and level of expression of FP transcripts in the corals that were examined in this study coincided with their reported susceptibility to bleaching (Da-Anoy et al., Reference Da-Anoy, Cabaitan and Conaco2019; Marshall & Baird, Reference Marshall and Baird2000). Among these corals, F. colemani and M. digitata expressed the most diverse set of FPs, with representatives of different spectral types. The temperature-tolerant species, F. colemani, also had a larger and more abundant complement of green FP transcripts, whereas only one green FP transcript was found in M. digitata and none in A. digitifera and S. caliendrum. Although it is well-known that many host and symbiont characteristics contribute to the overall resilience of corals, it is possible that FPs also contribute to this characteristic through their ROS scavenging (Bou-Abdallah et al., Reference Bou-Abdallah, Chasteen and Lesser2006; Palmer et al., Reference Palmer, Modi and Mydlarz2009) and light scattering properties (Lyndby et al., Reference Lyndby, Kühl and Wangpraseurt2016). In addition, green fluorescence has been shown to enhance symbiont phototaxis (Aihara et al., Reference Aihara, Maruyama, Baird, Iguchi, Takahashi and Minagawa2019). Thus, the presence of multiple green FP transcripts in F. colemani may reduce thermal stress susceptibility by providing the coral with an enhanced mechanism for recovery of symbionts in the event of bleaching.
The expression of transcripts encoding FP homologues varied in response to elevated temperatures and duration of exposure. However, their expression patterns did not necessarily reflect observed changes in symbiont photosynthetic efficiency in the corals (Da-Anoy et al., Reference Da-Anoy, Cabaitan and Conaco2019). Upregulation of fluorescent proteins after the onset of the temperature treatment, as seen in A. digitifera and F. colemani, may be due to the increased rate of cellular processes at warmer temperatures and may contribute to the mitigation of reactive oxygen species that are generated under these conditions. In fact, these corals were able to withstand 3 days of constant exposure to 32 °C with no apparent detrimental effect (Da-Anoy et al., Reference Da-Anoy, Cabaitan and Conaco2019). In contrast, the green fluorescent protein transcript MdigFP3 in M. digitata was significantly downregulated at 48 h of exposure, coinciding with a reduction in symbiont density (Da-Anoy et al., Reference Da-Anoy, Cabaitan and Conaco2019). This expression profile mirrors reports on GFP downregulation in other coral species subjected to temperature stress (Smith-Keune & Dove, Reference Smith-Keune and Dove2007; Roth & Deheyn, Reference Roth and Deheyn2013). On the other hand, S. caliendrum FP transcripts, which belong to the chromoprotein family, were significantly upregulated at 48 h of exposure to higher temperature, coinciding with the decrease in photosynthetic efficiency and symbiont density prior to bleaching (Da-Anoy et al., Reference Da-Anoy, Cabaitan and Conaco2019). The upregulation of transcripts encoding chromoproteins, which are predicted to possess efficient ROS scavenging properties (Palmer et al., Reference Palmer, Modi and Mydlarz2009), may be an additional protective response in the coral. Seriatopora caliendrum has been noted to be more susceptible to thermal stress (Da-Anoy et al., Reference Da-Anoy, Cabaitan and Conaco2019; Marshall & Baird, Reference Marshall and Baird2000), partly due to their thinner tissue layers and the light scattering properties of their skeleton.
Other studies have shown variable responses of fluorescent proteins to temperature exposure. Cyan fluorescence in Porites lobata diminished after 17 days of exposure to 31.5 °C (Hume et al., Reference Hume, D'Angelo, Burt, Baker, Riegl and Wiedenmann2013). A green fluorescent protein in A. millepora, AmA1a, was significantly downregulated after 6 h at 32 °C and 33 °C (Smith-Keune & Dove, Reference Smith-Keune and Dove2007). Green fluorescence and GFP protein concentration both decreased with declining coral health before onset of bleaching due to temperature stress in A. yongei (Roth & Deheyn, Reference Roth and Deheyn2013). In contrast, a chromoprotein gene in A. millepora, AmCh, was upregulated in samples undergoing natural bleaching compared with healthy corals (Seneca et al., Reference Seneca, Foret, Ball, Smith-Keune, Miller and van Oppen2009). These findings suggest that patterns of expression of FPs may be specific to fluorescent type and that FPs may play different roles in corals. Quantification of the expression of different types of FPs, as well as changes in fluorescence or colour intensity, in corals subjected to different environmental conditions are needed to gain further insights into the role of these proteins in the coral stress response.
In this study, we identified a diverse array of 16 fluorescent protein transcripts representing 12 unique genes in four adult scleractinian corals. Among the four coral species, the bleaching resistant species F. colemani had the greatest number of identified FP genes. Different types of FPs exhibited distinct expression trends in corals subjected to elevated temperature. The constitutive expression of fluorescent protein transcripts in some coral species may provide additional protection against the detrimental effects of thermal stress through their reported ROS scavenging properties, as well as their ability to attract symbionts. Together with their reported photoprotective functions, these findings suggest that FPs may contribute to the tolerance of corals to thermal stress. However, it should be noted that, because we are working with de novo assembled transcriptomes that may contain fragmented sequences, the putative fluorescent and non-fluorescent types of FPs that were identified in this study may be incomplete. Further work would be required to retrieve the complete sequences of these genes and to characterize their spectral properties. Analyses of fluorescent protein abundance, localization and antioxidant activity, and their role in symbiont phototaxis in the corals, would also be important future steps to determine their range of functions within the coral holobiont.
Supplementary material
The supplementary material for this article can be found at https://doi.org/10.1017/S0025315421000059
Acknowledgements
The authors extend their gratitude to the staff of the Bolinao Marine Laboratory and the Marine Molecular Biology Laboratory of the University of the Philippines Diliman for assistance with coral collection and experiments.
Financial support
This study was funded in part by a research grant from the Department of Science and Technology Philippine Council for Agriculture, Aquatic, and Natural Resources Research and Development (C.C.) and a thesis writing grant from the University of the Philippines Marine Science Institute (E.G.D.).