Introduction
The organic industry in the USA has experienced continued growth since the inception of the United States Department of Agriculture's (USDA's) National Organic Program in 2002. Sales of organic fruits and vegetables comprise a large share of the total organic market in the USA, representing 38% of sales of organic products and 11% of total vegetable sales 1 . Wisconsin continues to be a leader in the organic marketplace, ranking third in the nation for the number of organic vegetable and melon farmsReference Silva, Paine, Barnidge, Carusi and McNair 2 .
Organic fruit and vegetable farmers utilize a variety of marketing outlets to sell their produce, including direct and indirect channels. Direct marketing channels are characterized by farmers selling their goods directly to consumers without the involvement of a wholesaler or retailer and include roadside farm stands, farmers' markets and community-supported agriculture (CSA) operations. Direct marketing channels increasingly draw interest from the US consumers, especially as the demand for locally produced food increases. In 2012, 7864 farmers’ markets were active throughout the USA, a 10% increase from 2011 3 . Similarly, CSA, the marketing strategy in which consumers buy ‘shares’ in the farm prior to the farming season and regularly receive a portion of the farm's harvest, has also grown in recent years. With only an estimated 50 CSA farms located in the USA in 1990, the number of CSA farms reached 12,549 in 2007, 545 of which are located in Wisconsin 4 .
Federal programs have been established to support both smaller, direct market farms and organic producers. In 2009, the United States Department of Agriculture–Agricultural Marketing Service (USDA-AMS) created the ‘Know Your Farmer, Know Your Food’ initiative to ‘promote sustainable local and regional food systems that will support small and mid-sized farms and ranches, strengthen rural communities, promote healthy eating and protect our natural resources’ 5 . The USDA-AMS also began the Farmers’ Market Promotion Program to provide funding to improve or expand existing farmers’ markets, roadside stands, community-supported agriculture and other direct-to-consumer marketing of specialty crops 6 . The USDA National Organic Program's National Organic Certification Cost Share Program provides financial assistance to organic farmers to help defray the cost of organic certification 7 . The existence of these federal programs, as well as various state and local programs, implies a policy goal of increasing the visibility and the success of smaller, direct market farms and organic producers. Economic viability through generating satisfactory profits is a key part of the success of farms of this sort. However, data supporting direct marketing as a potential opportunity for organic farmers to create positive returns is variable.
Using a case-study approach focused on diversified organic vegetable farms, HardestyReference Hardesty 8 found that wholesale marketing, versus direct marketing channels, generated the highest net returns for the farms included in their study (between 65 and 72% per dollar of sales); returns for CSA farms ranged between 57 and 65% per dollar of sales and farmers' markets generated the lowest returns (between 20 and 65% per dollar of sales). Similarly, OstromReference Ostrom, Hinrichs and Lyson 9 and Tegtmeier and DuffyReference Tegtmeier and Duffy 10 have found that most CSA farmers, many of whom market their product as organic, do not feel that they are earning adequate returns. Contradicting this findings are the results of a study by LeRoux et al.Reference LeRoux, Schmit, Roth and Streeter 11 ; using four case-study farms in New York managed both organically and conventionally, they found that CSAs generated an 87% net return per dollar of sales, compared to 67% for farmers' markets and 58% for wholesale.
Improving the quality of life for farmers is seen as a foundation for rural development activitiesReference Morgan, Lambe and Freyer 12 . In addition, enhancement of the quality of life of both farmers and society is explicitly stated as a key characteristic of sustainable agricultural systems, as defined by the United States Congress (US Code Title 7, Section 3103) 13 . Despite recognition of its importance, we found that few empirical assessments of factors influencing the quality of life of farmers both in the USA and globally exist. In part, the lack of research regarding quality of life may arise from the subjective nature of this term; quality of life is a personal measurement and significantly influenced by other subjective factors such as happiness, life satisfaction and well-beingReference Meares 14 , Reference Arbuckle and Kast 15 . The research that has been conducted strongly suggests that higher levels of quality of life are associated with beneficial individual and societal outcomesReference Arbuckle and Kast 15 .
Despite the influence of sales outlets on farmers’ profitability and quality of life, few formal studies have been conducted to examine the impacts of marketing channels on these factors. Data from studies assessing market outlet choices for diversified vegetable producers indicate that these decisions indeed impact the farmers’ perceptions of quality of life. According to the survey conducted by LeRoux et al.Reference LeRoux, Schmit, Roth and Streeter 11 , farmers tended to be adverse to entering wholesale markets due to the perceived additional stress associated with the higher levels of product preparations, specifications and volumes, as well as the stress associated with the interactions with distributors. Alternatively, direct market channels were perceived to be associated with less stress, particularly the CSA channel. This study aims to fill in this gap by quantitatively examining the determinants of market channel choices and the connections between market channel choices and farmer satisfaction with farm profitability and quality of life for certified organic vegetable producers in Wisconsin. Our findings can provide more informed programmatic, educational and policy decisions regarding the support of direct market channels.
Methodology
Survey data collection and description
This study used a mail survey to collect information on farmer satisfaction with their quality of life and farm profitability and factors believed to be important covariates. The survey asked farmers for farmer demographic information (e.g., gender, age, education) and farm characteristics (e.g., farm size, market channels, number/type of employees and farm financing). In addition, farmers were asked to rate their satisfaction with their farm's profitability and with their quality of life as very dissatisfied, dissatisfied, neutral, satisfied or very satisfied. As per MearesReference Meares 14 , quality of life was determined by individual farmers’ perceptions, rather than attempting to use a standard definition.
Addresses for 240 certified and exempt organic vegetable producers in Wisconsin were obtained from the USDA's National Organic Program in January of 2011. Initial mailing of survey packets began in mid-February of 2011, with farmers receiving a cover letter, the four-page survey and a postage-paid return envelope. A postcard was sent again to each address 3 weeks following the initial mailing. Two weeks after postcards were sent, the survey packet was again mailed to all non-respondents, with a final postcard reminder mailed 2 weeks after the second survey mailing. In total, 135 surveys were returned (56% response rate), with 97 reporting that they were active organic vegetable farmers in Wisconsin.
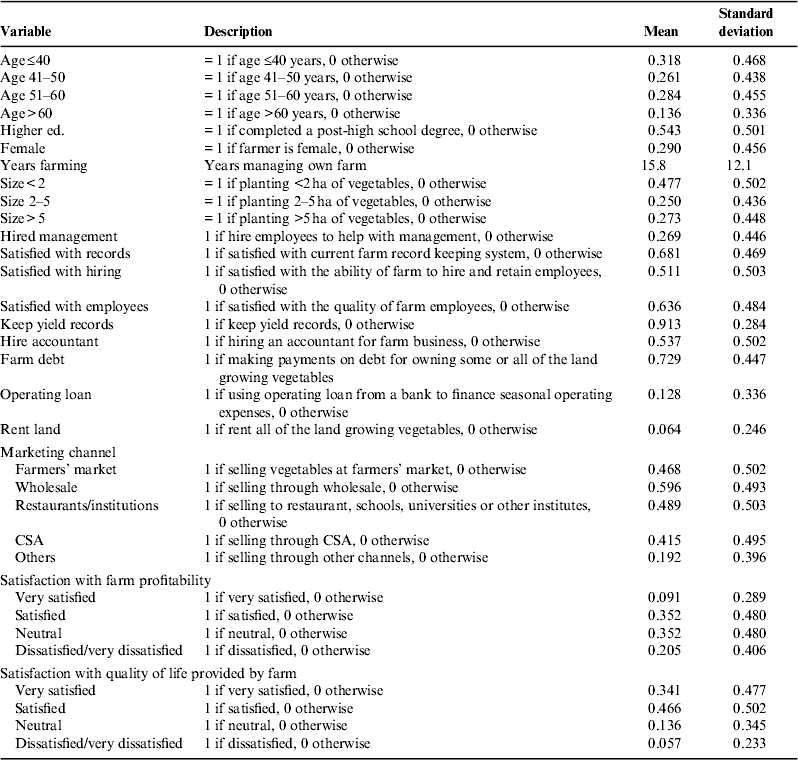
Table 1 lists the specific variables from the survey used for this analysis and their descriptive statistics. Farmer demographic information included farmer age, educational achievement, gender and years of experience managing a farm. Farmers reported their age as less than 30, 30–39, 40–49 and 50–59 years or more than 60 years, with responses coded as indicator variables equal to 1 for farmers in the appropriate age category and 0 otherwise.
Statistical description of survey responses.

Educational achievement was coded as an indicator variable if the farmer indicated completion of any post-high school education, including a vocational/technical certificate, or a 4-year or more advanced degree, with slightly more than half of the farmers having completed some post-high school education. Gender was described by an indicator variable equal to 1 if the farmer was female and 0 otherwise. Farmer experience was measured with the reported years managing a farm. Finally, an indicator variable equaled 1 if the farmer reported off-farm income and 0 otherwise.
For farm characteristics, farmers reported their vegetable planted area in one of four sizes: less than 2, 2–5, 5–10 ha and greater than 10 ha, with responses coded as indicator variables equal to 1 for farms of the corresponding size and 0 otherwise. The survey also asked if the farmer hired employees to help with management. Farmers were asked to rate their satisfaction with hiring and retaining employees and with the quality of employees as very satisfied, satisfied, neutral, dissatisfied and very dissatisfied. Farmers were also asked to rate their satisfaction with their farm record-keeping system in the same manner. For regression analysis, indicator variables were generated from those questions, with the corresponding variable taking a value of 1 if the answer to the question was satisfied or very satisfied and 0 otherwise. In terms of farm financial issues, farmers indicated whether all of the land they used for vegetable production was rented, whether or not they were making payments on debt for the land where they were growing vegetables and whether or not they used a bank for a seasonal operating loan for their vegetable operation.
Statistical analysis
In the statistical analysis, we first examine the factors affecting farmers’ marketing channel choices. Response options for marketing channel participation are one or more of the five market choices. For such responses, a multivariate probit model is appropriateReference Greene 16 . A univariate probit model predicts the probability that a farmer chooses a specific market channel using the explanatory variables. However, it seems likely that correlations exist across responses to each separate market channel. For example, farmers marketing vegetables at farmers’ markets may also likely participate in CSA. A multivariate probit model allows for such correlations across responses by simultaneously estimating each individual probit equation with a cross-equation correlation matrix for the error terms. Secondly, we investigate how market channel choices and other factors affect farmers’ satisfaction with farm profitability and farmers’ satisfaction with their quality of life. Responses to the satisfaction with farm profitability are ordered from very dissatisfied to very satisfied and farmers could only mark one response for each question. An ordered choice model is appropriate for such responses in order to account for this ordering of optionsReference Greene 16 . Responses to the satisfaction with their quality of life are also ordered from dissatisfied to very satisfied (no farmer responded ‘very dissatisfied’). Therefore, the same ordered choice method can be used. We estimate the two ordered choice models individually using an ordered probit model.
Multivariate probit model
As farmers can choose multiple marketing channels and the choices may be correlated, we use multivariate probit model to estimate the effects of a set of explanatory variables on different marketing channels choices. The multivariate probit model can be expressed as follows:
 $$\eqalign{& y_{im}^* = \sum\limits_i {\beta _{im} X_{im} + \varepsilon _{im}} \cr & y_{im} = \left\{ {\matrix{ { 1,} & {{\rm if}\;y_{im}^* \gt 0} \cr { 0,} & {{\rm otherwise}} \cr}} \right.} $$
Here
 $y_{im}^* $
are latent variables with m=1, …, 5 indicating the choices of marketing channels, including (1) farmers' market, (2) wholesale, (3) restaurants/institutions, (4) CSA and (5) others such as internet, roadside stand, farm sales and auction; y
im
is equal to 1 if the ith farmer chooses the mth marketing channel and 0 otherwise; ε
im
are error terms following a multivariate normal distribution with zero mean and correlation matrix
 $$\Sigma = \left( { \matrix{ 1 & {\rho _{12}} & \ldots & {\rho _{15}} \cr {\rho _{12}} & 1 & \ldots & {\rho _{25}} \cr \vdots & \vdots & \ldots & \vdots \cr {\rho _{15}} & {\rho _{25}} & \ldots & 1 \cr}} \right)$$
Finally, the explanatory variables X im include gender, age, education, years of farm experience and size; and β im are the corresponding parameters to estimate. The multivariate probit model is estimated using the CMP command with the GHK algorithm in Stata/SE 13.0 17 .
Ordered probit model
The survey specifically asked ‘How satisfied are you with the quality of life provided by your farm?’ and ‘How satisfied are you with your farm's profitability?’ In this study, each farmer i had five options (very dissatisfied, dissatisfied, neutral, satisfied and very satisfied) to indicate their satisfaction with their farm's profitability and their quality of life. (The choice of very dissatisfied is combined with dissatisfied in the empirical analysis for the reason of having very few observations, as explained in the Descriptive Statistics section.) For farm profitability (j=1) or quality of life (j=2), their observed choices were coded such that y ij =0 indicates that farmer i chose ‘very dissatisfied or dissatisfied,’ y ij =1 indicates that farmer i chose ‘neutral,’ y ij =2 indicates that farmer i chose ‘satisfied,’ and y ij =3 indicates that farmer i chose ‘very satisfied.’ We utilize an ordered probit model to analyze response to the two questions separately.
An ordered probit model assumes that each farmer has a continuously varying strength of preferences U ij * that remains unobserved, but determines each farmer's reported choice y ij (GreeneReference Greene 16 ). The ordered probit model for farm profitability and farm quality of life can be expressed, respectively, as followsReference Greene and Hensher 18 :
 $$\eqalign{U_{i,1}^* = & \beta '_1 X_{i,1} + \varepsilon _{i,1} \cr U_{i,2}^* = & \beta '_2 X_{i,2} + \varepsilon _{i,2}} $$
Here X i,j is the vector of explanatory variable for farmer i's satisfaction with profitability (X i,1) and satisfaction with quality of life (X i,2) and β j is a parameter vector to estimate with j=1 or 2 indicating satisfaction with profitability and quality of life, respectively. Each farmer's observed choice y ij is determined by U i,j * as follows:
 $$y_{ij} = \left\{ {\matrix{ 0 & {{\rm if}\; - \infty \lt U_{ij}^* \le u_{1j}} \cr 1 & {{\rm if}\;u_{1j} \lt U_{ij}^* \le u_{2j}} \cr 2 & {{\rm if}\;u_{2j} \lt U_{ij}^* \le u_{3j}} \cr 3 & {{\rm if}\;u_{3j} \lt U_{ij}^* \le \infty} \cr}} \right.$$
where the u k j for k=1, …, 3 are thresholds dividing the range of the unobserved utility U ij * into four regions that map into the observed values for y ij . Finally, the error terms ε ij follow a normal distribution N[0, 1].
The vector X i,1 includes variables on farmer's gender, education, age, years of farming experience, farm's land ownership, size, market channels, employee hiring, farm finance, record keeping and farmer's satisfaction with farm quality of life. When examining factors associated with reported satisfaction with the quality of life their farms provide, we also include their reported satisfaction with their farm's profitability as a covariate, along with all the same variables included in the analysis of satisfaction with their farm's profitability except variables on maintaining yield records and hiring an accountant. The ordered probit model was estimated by using oprobit in Stata/SE 13.0 17 .
Results and Discussion
Descriptive statistics
Table 1 reports the descriptive statistics for the variables used in the analysis. Twenty-nine percent of the 94 valid survey respondents were women. About 79% of the farmers were about equally dispersed in the middle three age categories (30's, 40's and 50's), with less than 7% of the farmers less than 30 years old. Therefore the empirical estimation combines farmers with ages less than 30 years and those between 30 and 40 years into a single group. The average reported number of years managing a farm was 16. Fifty-four percent of farmers responding had post-high school degree. Almost half of the farmers reported less than 2 ha of vegetable production, whereas 25% reported 2–5 ha. About 18% reported farms with more than 10 ha of vegetable production. As less than 10% of farms were 5–10 ha in size, we combined this group of farms with those having more than 10 ha of vegetables. Almost three-fourths of farmers reported making payments on debt for their land, but only 12.8% used bank loans to finance seasonal operating expenses. Moreover, only 6.4% rented all the land used for their vegetable production; 25% of farmers reported hiring employees to assist with management.
About 60% of the respondents participated in wholesale markets, and slightly less than half direct marketed to restaurants or institutions, with 47% using farmers' markets and more than 40% using CSA. Slightly less than 20% reported using ‘other’ marketing channels; answers submitted for this category varied, but included internet, roadside stands, farm sales, sales directly to family and friends, and sales at produce auctions.
In terms of reported satisfaction with their farm's profitability, over one-third were satisfied and another third neutral, but almost 20% reported being dissatisfied. At the extremes, 9% were very satisfied while 2% were very dissatisfied. In terms of reported satisfaction with their quality of life, over 80% were either very satisfied or satisfied, in contrast to about 6% being dissatisfied and none very dissatisfied. The reported satisfaction with their farm's profitability and quality of life are correlated (correlation coefficient of 0.43), with 34 out of 94 farmers having exactly same rating for both quality of life and profitability. The empirical estimation combined the group of very dissatisfied farmers and those dissatisfied since there were few farmers very dissatisfied with either farm's profitability and farm quality of life.
Relationship between choice of marketing channels and farm characteristics
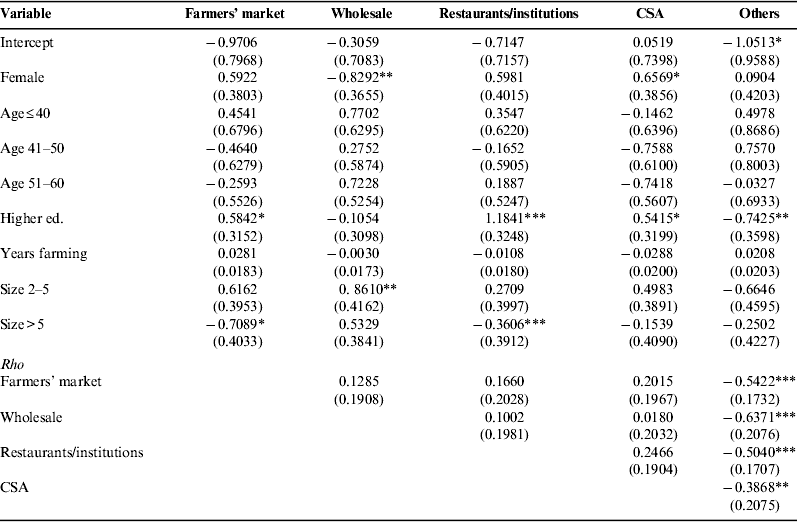
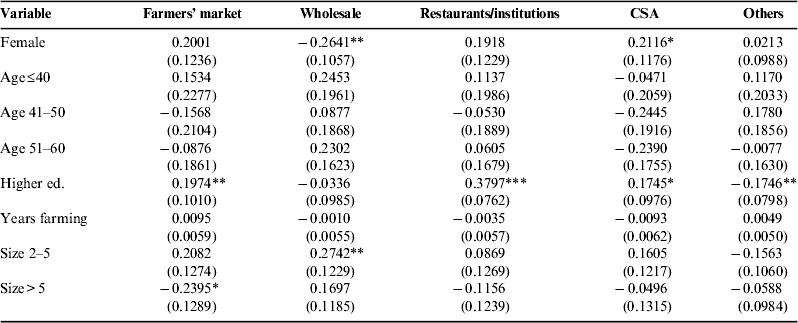
The estimated parameters for the multivariate probit model of market channel choices are reported in Table 2. Parameters for gender, education and size are statistically significant. However, because the effect of each regressor on the probability of choosing a particular marketing channel does not equal the estimated coefficient, Table 3 reports the marginal effects for each regressor to indicate how each variable affects the probability of choosing a particular marketing channel relative to the base case defined by the intercept, which here is a male farmer over the age of 60 with no higher education, no farming experience and a farm less than 2 ha in sizeReference Greene 16 . For continuous variables, the marginal effect indicates the change in the probability of choosing a particular marketing channel given a 1 unit change in the explanatory variable with all other explanatory variables fixed. For an indicator or ordered variable, the marginal effect measures how the probability changes when the explanatory variable changes from 0 to 1 or from one rank to the next. Significance levels of the marginal effects in Table 3 were estimated using the delta methodReference Greene 16 .
Coefficient estimates for multivariate probit model of marketing channel choices.

Notes: standard errors in parentheses; *, ** and *** denote significance at a 10, 5 and 1% significance level, respectively.
Marginal effects of variables on marketing channel choices based on estimated multivariate probit model.

Notes: standard errors in parentheses; *, ** and *** denote significance at a 10, 5 and 1% significance level, respectively.
Results in Table 3 show that gender, educational attainment and farm size impact farmer choices of market channels. Compared to farmers completing only high school, farmers completing post-secondary education were 20% more likely to sell into farmers' markets, 17% more likely to sell through CSA, 38% more likely to sell into restaurants/institutions, and 17% less likely to sell into ‘other’ channels. Women farmers were 21% more likely to sell through CSA than male farmers, but roughly 26% less likely to sell into wholesale markets. Relative to farms less than 2 ha in size, farms from 2 to 5 ha in size were 27% more likely to sell into wholesale markets, while farms exceeding 5 ha were 24% less likely to sell at farmers' markets. We found no evidence to suggest that farmer age and years of experience affected market channel choices.
In general, Table 3 shows that a few variables had significant effects, which we attribute to the exploratory nature of this research. We found little empirical literature to use as a guide regarding the types of factors that explain market channel choices of small organic vegetable farmers. We find solid empirical support for the importance of gender, educational achievement and farm size on market channel choices. In some sense, however, our results suggest that factors we did not measure also impact the market channel choices of these types of farmers and that these findings can guide others empirically examining in these types of issues.
Satisfaction with farm profitability and quality of life
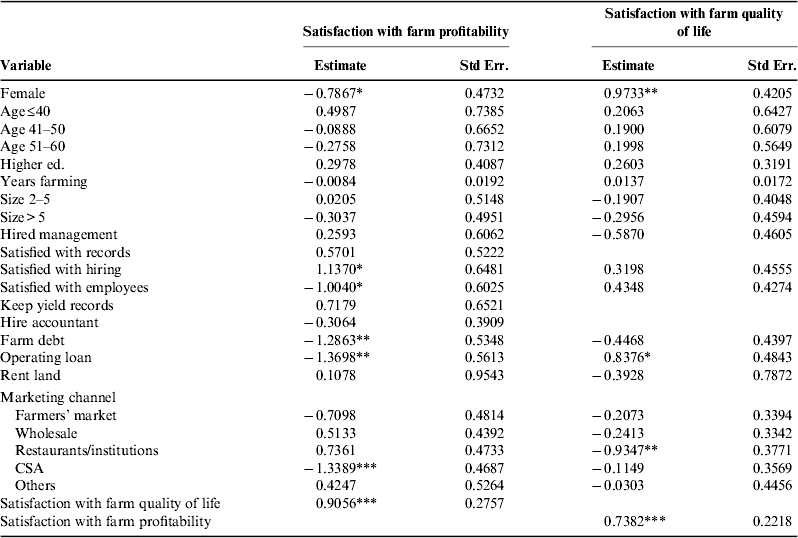
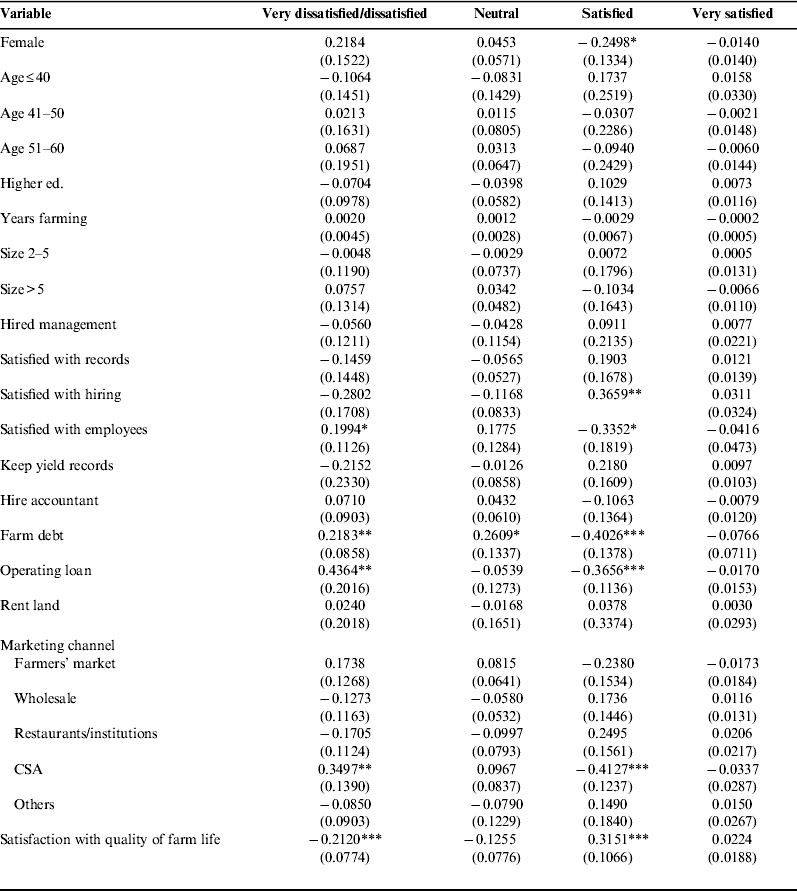
The estimated coefficients for the ordered probit model are listed in Table 4. The coefficients for gender, market channels, farm financing, and satisfaction with hiring and employees along with satisfaction with farm quality of life are statistically significant for the satisfaction with farm profitability equation. For the satisfaction with quality of life equation, coefficients for gender, market channels, farm finance and satisfaction with farm profitability are statistically significant. Again, because the coefficients do not equal the effect of each regressor on the probability, the marginal effects are reported in Tables 5 and 6 to indicate the effect of each variable on the probability of farmers choosing each satisfaction level for farm profitability and quality of life, respectively. Again, these probabilities are relative to the base case, which for these regressions is defined by the intercept (male, over 60 years old, no higher education, no farming experience, farming less than 2 ha, not hiring management help, not satisfied with his farm record-keeping system, hiring and retaining employees, or the quality of his employees, does not keep yield records or hire an accountant, has no farm debt and no operating loan and does not rent land).
Coefficient estimates for the ordered probit model.

Note: *, ** and *** denote significance at a 10, 5 and 1% significance level, respectively.
Marginal effects of variables on satisfaction with farm profitability.

Notes: standard errors in parentheses; *, ** and *** denote significance at a 10, 5 and 1% significance level, respectively.
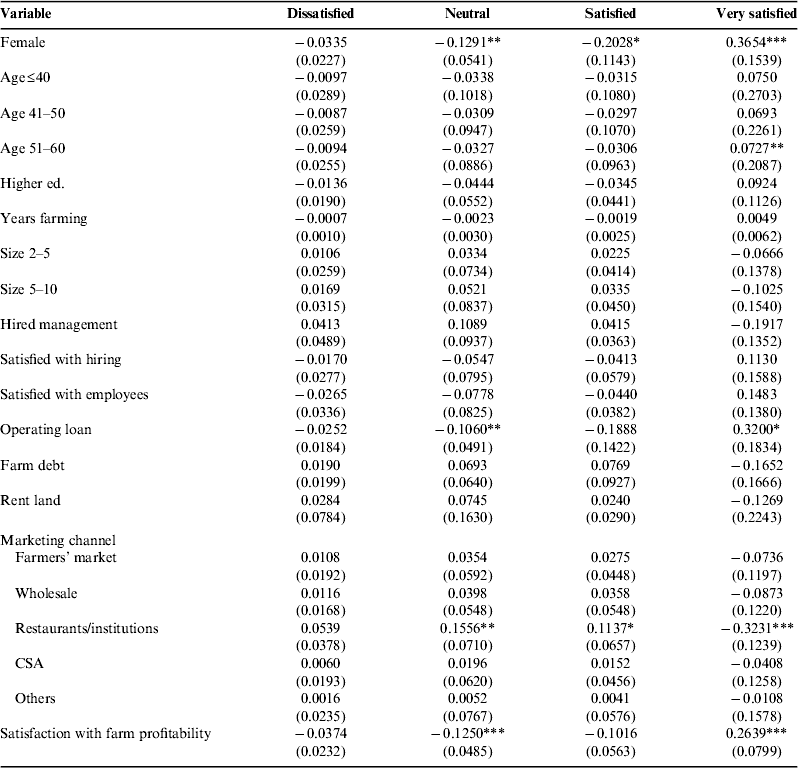
Marginal effects of variables on satisfaction with farm quality of life.

Notes: standard errors in parentheses; *, ** and *** denote significance at a 10, 5 and 1% significance level, respectively.
Marketing channel had a statistically significant effect on farmers’ satisfaction with their profitability, with farmers using CSA more likely to be dissatisfied and less likely to be satisfied with their profitability. Farmers using farmers’ markets also have the same perceptions about farm profitability, with marginal effects not significant, but z-values are very close to critical values of 90% significance levels (e.g., z=−1.55 and P>|z|=0.12 for satisfied with farm profitability). These results are consistent with some previous studiesReference Ostrom, Hinrichs and Lyson 9 , Reference Hardesty and Leff 19 that found that farmers selling into farmers' markets and CSAs had difficulty maintaining profitable operations and generated lower returns. Amount of land farmed was not related to farmers’ perception about farm profitability, implying that farm size of organic diversified vegetable operations in Wisconsin does not impart an advantage with respect to ability to generate profits.
Most farm demographic variables (age of farmer, years farming and education level) did not impact farmer perceptions of profitability. The one exception was gender, with women less likely to be satisfied with farm profitability comparing to men.
Farm business structure impacted farmer perceptions of profitability. Farmers having farm debt or using an operating loan from banks are about 40% less likely to feel satisfied with their profitability, suggesting that the presence of these financial burdens leads to a sense of financial pressure. In addition, management characteristics influence farmer satisfaction with profitability, with satisfaction with hiring helping farmers feel more satisfied with their profitability, while keeping yield records and being satisfied with their record keeping were not. Interestingly, farmers satisfied with their individual employees are not satisfied with their profitability.
Estimated marginal effects for each variable on farmer satisfaction with their quality of life from the ordered probit model are reported in Table 6. Market channel choice impacted farmer quality of life perceptions. Farmers using restaurant and institutional sales were less satisfied with their quality of life relative to their farm profitability. This result may be due to the benefits of stable demand but with occasional pressure of maintaining adequate supply volumes as specified in contracts, or the stress of business transactions within restaurant and institutional contracts, which makes farmers feel more satisfied but in the meantime hard to be very satisfied. Farm size did not relate to farmer satisfaction with quality of life either positively or negatively, which is consistent with previous studiesReference Molnar 20 .
Farmer demographics more strongly influenced views on quality of life as compared to views on profitability. Compared to their male counterparts, female farmers were less likely to be satisfied or neutral with their quality of life, but more likely to be very satisfied. Farmers aged between 51 and 60 tended to be more satisfied with their quality of life compared to those falling into the oldest category. Conversely, farmers younger than 50 years old did not show a significant difference relative to the oldest group. Similarly, age has been associated with a higher perceived of quality of life in other studiesReference Molnar 20 – Reference Coughenour and Swanson 22 .
Farm business management practices influenced perceptions of quality of life. Farmers using bank loans to finance seasonal operating expenses were 42% more likely to be very satisfied with quality of life. The same relationship was also identified by an Australian study of organic farmsReference Rickson, Saffigna and Sanders 23 . This study found that taking on debt to finance purchases of land, machinery, farm buildings, or animals to a large, moderate or small extent had no effect on work satisfaction, but those with no debt had relatively low work satisfaction. Similarly, Shwarzweller and DavidsonReference Schwarzweller and Davidson 24 , in an evaluation of small dairy farms in upper Michigan, found that debt could be a positive indicator of long-term planning horizons and confidence in a farm's future on the part of farmers and lenders rather than just an indicator of financial stress. In these cases, debt seems to be an indicator of faith in the future of the farm. Though farm debt may add an immediate burden to the farm balance sheet, thus impacting perceptions of profitability, the positive long-term farming outlook associated with taking on this debt appears to be associated with a positive outlook with respect to quality of life.
Availability of hired management, satisfaction with hiring, satisfaction with employee performance and landownership did not impact quality of life. Interestingly, satisfaction with record keeping was correlated with a more negative perception of the quality of life. This may be due to the record-keeping requirement of organic farmers; the burden of keeping extensive, detailed, organized records may be increasing the hours spent on farm-related paperwork, thus decreasing positive perceptions of quality of life. Alternatively, hiring an accountant was positively correlated with positive perceptions of quality of life, perhaps indicating a shift of the record-keeping burden from the farmer.
Farmers reporting being satisfied with their farm profitability were also more likely to be very satisfied with their quality of life. These results indicate the connection between farm profitability and satisfaction with the quality of life that exists for many farmers, which is different than the debt burden carried by their farm.
Discussion and Conclusion
Federal and state programs supporting the entry of farmers into direct market channels, such as farmers’ markets and CSAs are expanding 5 – 7 . These markets are often served by organic vegetable producers, who are more likely to be new to farming and farming smaller acreages. Better understanding of the factors influencing the relative success of farmers using these marketing channels and the factors relating to their success or failures will contribute to better implementation of these programs and to design of better outreach and educational support activities.
The data collected from this survey indicate that farmers selling into farmers' markets and through CSAs tend to be less likely to be satisfied with their profitability. In this survey population, farms selling at farmers’ markets tended to describe a more tenuous financial position of relying on off-farm income and renting the land on which they were farming. This situation did not differ between beginning farmers and more experienced farmers. Lack of profitability for farmers’ market vendors could be due to several factors. Larger farmers’ markets located in urban areas are often very competitive, with many vendors selling similar produce selections. This pressures vendors to set their prices at levels that may not cover their costs of production. Alternatively, farmers' markets with too few vendors may fail to draw adequate numbers of customers to attain a sufficient hourly gross income to cover costs.
The CSA model was adopted in the USA to circumvent the problem of low or variable levels of sales in direct market channels such as farmers' markets. However, the data from this survey indicate that the CSA model may be failing to achieve this goal, at least in Wisconsin. This result may be due to inefficiencies in production, unwillingness of customers to pay the price needed by the farmer to cover production costs, or market saturation. As with prices at farmers' markets, appropriately pricing CSA shares to cover costs of production can be a challenge particularly for farmersReference Ostrom, Hinrichs and Lyson 9 . This issue may be a challenge where there is great competition for CSA membership, as is the case in many of the more urban areas of Wisconsin. Even with sufficient records detailing cost and employee labor expenses, the failure to account for owner and/or family labor contributions may lead to inaccurate assessments and the selection of market channels that lead to lower overall profitsReference LeRoux, Schmit, Roth and Streeter 11 .
In our particular survey population, beginning farmers choosing to market through direct markets tended to choose the CSA models for their operations. This choice may be due to the significant support network that exists in Wisconsin for CSA growers through the Fairshare CSA coalition. This network offers a community of support for growers through grower meetings, educational opportunities and field walks. However, despite this support, these farms were less satisfied with their profitability.
Although demonstrating higher satisfaction with profitability, it is the farmers selling into other markets, particularly restaurants and institutions, who are significantly less likely to be very satisfied with their quality of life. Despite the fact that selling into farmers’ markets and CSAs was related to negative perceptions of profitability, it was not related to negative perceptions of quality of life. This result may indicate additional benefits beyond profits derived from choosing certain market outlets. It appears that farmers are making tradeoffs with respect to entering markets that allow for greater financial rewards, but may be more stressful or have a negative impact on work–life balance. Whether these tradeoffs in these more profitable market channels are due to greater workload, uncertainty of market availability, stress of working with vendors or other factors remain unclear.
More broadly across market channels, it appears that perceptions of profitability influence a farmer's perception of their quality of life. As such, efforts to assist farmers to increase their profitability in market channels that also provide a higher quality of life would be beneficial. This effort could be through assistance in employee/labor management, better analyses of the cost of production of specific crops in specific market channelsReference Rickson, Saffigna and Sanders 23 and increasing production efficiencies for key crops appropriate for the scale and market channels of the farm. More education and training related to farm finances, thus allowing for more accurate assessment of the profitability of selling into different market channels as it relates to their specific operations, would be a valuable investment if promotion of these market channels as viable marketing alternatives continues.