Introduction
Acute care of temporal bone fracture is directed towards the treatment of cerebrospinal fluid otorrhoea and immediate onset facial paralysis. Management of these complications is well documented.Reference Darrouzet, Duclos, Liguoro, Truilhe, De Bonfils and Bebear1, Reference Brodie and Thompson2
Long term care of temporal bone fracture is primarily concerned with hearing rehabilitation. Hearing loss may be of the sensorineural, conductive or mixed type. A significant air–bone gap (ABG) is amenable to surgical treatment, in order to improve the patient's quality of life. An ABG larger than 30 dB, which persists after blood has resorbed and the tympanic membrane has healed, may be presumed to be due to ossicular damage.
In these cases, ossiculoplasty can be performed, using titanium, gold or hydroxylapatite prostheses, or the native ossicle itself. Autologous ossiculoplasty is safeReference Miman, Aydın, Öncel, Ozturan and Erdem3 and feasibleReference Ng, Yip, Suen, Abdullah and van Hasselt4 even in cholesteatoma patients; therefore, we feel that it should remain so in temporal bone fracture related ossicular chain disruption. The advantages of autologous ossiculoplasty include easy availability, low cost of preparation, and, most significantly, biocompatibility.Reference Farrior and Nichols5
The aim of the present study was to analyse the outcomes of autologous ossiculoplasty following temporal bone fracture resulting in ossicular chain disruption and hearing impairment with prominent ABG.
Materials and methods
Between 1993 and 2006, 14 patients with temporal bone fractures resulting in ossicular chain discontinuity were treated with autologous ossiculoplasty. For these patients, 14 operative records and 10 pure tone audiometry results were available for review. The four cases without post-operative audiometry records were excluded from the analysis of audiometry data.
The surgical procedure was as follows. After a postauricular approach, the ossicular chain lesion was identified. Interpositions were between the malleus and the stapes. The incus remnant was freed, drilled to reduce its mass, then remodelled at both ends to lock-in the malleostapedial space. The integrity of the reconstructed chain was checked by touching the malleus to see whether there was resulting movement of the stapes. Finally, Gelfoam was used to support the reconstructed chain.
We evaluated the difference between the pre- and post-operative air conduction, bone conduction and ABG for the included patients. The average air conduction, bone conduction and ABG were calculated using both a three-frequency average of 500, 1000 and 2000 Hz, and a four-frequency average of 500, 1000, 2000 and 4000 Hz. Patients' hearing results were divided into groups according to the following ABG categories: 0 to 10 dB, 11 to 20 dB, 21 to 30 dB and greater than 30 dB. The Glasgow benefit plot was used to demonstrate the benefits from surgical intervention, using four-frequency averages.
The difference between post-operative and pre-operative high pure tone average bone conduction results at 1000, 2000 and 4000 Hz was used to evaluate surgery-related cochlear damage. In addition, the pre- versus post-operative change at 4000 Hz was used to evaluate material-related improvement in high frequency hearing.
Statistical analysis with paired t-testing was used to compare the pre- and post-operative audiometry data, in order to evaluate the effect of surgical intervention. Significance was determined to be at the confidence level of p < 0.05.
Results
In the 14 patients for whom surgical records were available, operative findings were as follow: 57 per cent (eight of 14) had isolated incudo-stapedial joint dislocation, 21 per cent (three of 14) had malleus-incus joint separation only, and the remainder (three of 14) had both incudo-stapedial and malleus-incus joint discontinuity. There were no cases of isolated stapes injury in our series. The 10 patients for whom audiometric data were available comprised six females and four males, with an average age of 30.8 years (range, 10–52 years). The average follow-up time was 24.4 months (range, 1–810 months).
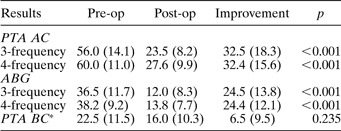
Table I summarises the mean air conduction, air conduction improvement, ABG, ABG improvement and surgery-related damage observed before and after surgical intervention. The results show significant changes in air conduction and ABG. Figure 1 shows the variations in the hearing results demonstrated by the Glasgow benefit plot. Eighty per cent (eight of 10) of the patients had socially acceptable hearing in the operated ear.
Hearing results demonstrated using the Glasgow benefit plot. Each line represents a different patient. The length of the line represents the change in AC thresholds and the arrow shows the direction of change.

Pre- and post-operative audiological data

* 1000, 2000 and 4000 Hz. Data other than p values are shown as mean (standard deviation). Pre-op = pre-operative; post-op = post-operative; PTA = pure tone audiometry; AC = air conduction; ABG = air–bone gap; BC = bone conduction
There was no significant difference between the average pre- and post-operative high pure tone bone conduction; thus, no evidence of surgery-related damage was observed.
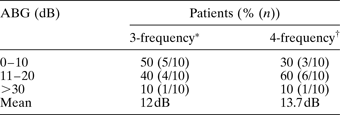
Closure of the average three- and four-frequency post-operative ABG to within 20 dB was achieved in nine of 10 patients (Table II).
Post-operative ABG distribution

* 500, 1000 and 2000 Hz; †500, 1000, 2000 and 4000 Hz. ABG = air–bone gap
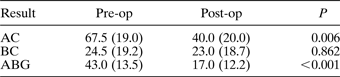
At 4000 Hz, there were significant improvements in post- versus pre-operative air conduction and ABG, but no significant corresponding change in bone conduction. The mean post- versus pre-operative improvement in ABG was 26 dB (standard deviation (SD) 12.1) (Table III).
Autologous ossiculoplasty: results at 4000 Hz

Data are shown as mean (standard deviation). Pre-op =pre-operative; post-op = post-operative; AC = air conduction; BC = bone conduction; ABG = air–bone gap
Discussion
In 1980, Hammond analysed 202 traumatic ossiculoplasty cases and found involvement of the incus in 73.2 per cent of cases, lesion of the malleus in 15.7 per cent and lesion of the stapes in 28.7 per cent; incudo-stapedial joint separation was the commonest abnormality.Reference Hammond6 Incudo-stapedial joint separation was also the most common lesion in a review of paediatric temporal bone fractures by McGuirt and Stool.Reference McGuirt and Stool7 We too found that dislocation of the incus was the most common finding.
According to Meriot et al., there are two reasons why the incudo-stapedial joint is usually the first to be injured: first, the tenuous suspension of the incus between the firmly anchored malleus and stapes; and second, the fact that the incudo-stapedial joint articulation is a fragile enarthrosis.Reference Meriot, Veillon, Garcia, Nonent, Jezequel and Bourjat8
Most studies of ossiculoplasty following temporal bone fracture have found that the ABG could be closed to within 10 dB, or at least significantly improved. TosReference Tos9 found that post-operative air conduction of less than 30 dB could be achieved in 81 per cent (13/16). Ogasawara et al. Reference Ogasawara, Tsuiki, Murai, Aigami, Kanai and Odashima10 reported a mean ABG improvement of 22.7 dB. Hilary et al. Reference Brodie and Thompson2 found an average post-operative ABG of 17.5 dB. Nosan et al. Reference Nosan, Benecke and Murr11 and Mills and StarrittReference Mills and Starritt12 found that the post-operative ABG could be closed to less than or equal to 10 dB in 83 per cent (five of six) to 100 per cent (six of six) of cases, respectively. HammondReference Hammond6 reported that 84 per cent (28/33) of cases gained an overall hearing improvement.
Similar results were observed in our study. Post-operative air conduction of less than 30 dB was achieved in 80 per cent of patients; the average three- and four-frequency post-operative ABGs were 12.0 dB (SD 8.3) and 13.8 dB (SD 7.7), respectively. The average ABG improvements were 24.5 dB (SD 13.8) and 24.4 dB (SD 12.1), respectively. Closure of the post-operative ABG to within 20 dB was achieved in nine of 10 (90 per cent) patients. However, closure of the air–bone gap to within 10 dB was achieved in only 50 per cent. This result was not as good as those of previous reports.Reference Nosan, Benecke and Murr11, Reference Mills and Starritt12 This may be due to the uncertain stability of ossicular chains reconstructed by our method. The problem may be addressed by the modified silicone grommet reported by Mills and Starritt,Reference Mills and Starritt12 or by the various types of bone cement reviewed by Javia and Ruckenstein.Reference Javia and Ruckenstein13
In our experience, cooperation between the otologist and anaesthetist is important, in order to prevent the patient from shaking their head while awakening from general anaesthesia before extubation, thus affecting the stability of the reconstructed ossicular chain.
We observed no significant change in bone conduction for pure tone averages at 1000, 2000 and 4000 Hz, comparing pre- and post-operative status. This indicates that no significant peri-operative damage was sustained. HammondReference Hammond6 reported worsened hearing in 6 per cent of patients (two of 33) after ossiculoplasty. Fortunately, this did not occur in any of our patients.
It has been reported that titanium prostheses give better hearing results at high frequencies (4000 Hz), compared with other prosthesis materials.Reference Zenner, Stegmaier, Lehner, Baumann and Zimmermann14 After evaluating average pre- and post-operative changes at 4000 Hz (Table III), we feel that our results show that significant high frequency improvement can be achieved by autologous ossiculoplasty; we found a mean improvement of 26 dB (SD 12.1). This may indicate that the efficacy of the native ossicle is similar to that of titanium.
• Long term care of temporal bone trauma is primarily concerned with hearing rehabilitation
• This study analysed 10 patients undergoing autologous ossiculoplasty following temporal bone fracture
• Dislocation of the incus was the most common operative finding
• Ossicular reconstruction was undertaken using an incus interposition technique
• Post-operative closure of the average three- and four-frequency air–bone gaps (ABGs) to within 20 dB was achieved in nine of 10 patients. However, ABG closure to within 10 dB was achieved in only 50 per cent, using the authors' method
Dornhoffer and GardnerReference Dornhoffer and Gardner15 found that mucosal fibrosis, drainage, revision ear surgery and type of surgical procedure all had a significant impact on hearing results following ossiculoplasty. In our experience of temporal bone fractures, the middle-ear mucosa is in relatively good condition and much less manipulation is needed, compared with patients with chronic middle-ear disease. Therefore, the treatment of the former condition carries a relatively low risk of operative damage.
An advantage of our study was that all procedures were performed by the same surgeon using the same surgical technique, thus eliminating the many variables introduced when different surgeons and different surgical methods are involved.
Conclusion
In cases of temporal bone fracture, autologous ossiculoplasty, conducted with meticulous technique and avoidance of unnecessary manipulation, can significantly improve patients' air conduction and minimise their ABG, without significant operative damage. However, our method resulted in only 50 per cent of patients achieving ABG closure to within 10 dB. Techniques of maximising the stability of the reconstructed ossicular chain should be further studied.