1. Introduction
Throughout developed countries, aging populations have been putting pressure on public pensions and other social programs. In response, policy makers have taken steps to raise pension eligibility ages and boost tax revenue by encouraging longer working lives. In the United Kingdom, policy makers have begun gradually increasing state pension eligibility ages for both men and women.Footnote 1 In addition, starting in April 2005, the terms for delaying pension claiming became more generous. The more generous terms – which were in place until 2016 – included providing a larger increase in benefits for each month of delay, allowing individuals to delay for an unlimited number of months, and allowing individuals to receive the gains from delay as a lump sum. In this paper, we test whether such incentives are effective at delaying pension uptake and encouraging longer working lives. To be more specific, we empirically examine the impact of the United Kingdom's more generous deferral options on pension claiming and labor supply choices among older workers.
To our knowledge, we are the first to address this question empirically for the United Kingdom. Numerous papers have examined the impact of other changes to the U.K. pension system, including increases in state pension ages (Blundell and Emmerson Reference Blundell, Emmerson, Gruber and Wise2007; Cribb et al. Reference Cribb, Emmerson and Tetlow2016), the repeal of the earnings rule that reduced pension benefits for individuals who continued to work (Disney and Smith Reference Disney and Smith2002), as well as general pension system incentives (Blundell et al. Reference Blundell, Meghir, Smith, Gruber and Wise2004). Some researchers have quantified the financial incentives for delay or explored optimal claiming strategies under the claiming incentives that were introduced in 2005 (Farrar et al. Reference Farrar, Moizer and Hyde2012; Dagpunar Reference Dagpunar2015; Kanabar and Simmons Reference Kanabar and Simmons2016).Footnote 2 They all conclude that deferral is an optimal strategy for some of the population, but heterogeneity exists depending upon the predicted survival probabilities and tax rates that people face.
Similar questions have been explored empirically in other countries. Amilon and Nielsen (Reference Amilon and Nielsen2010) examine the impact of pension deferral on labor supply in Denmark; they find a small increase in labor supply at age 65. In the United States, Social Security retirement benefits can be claimed at any age between 62 and 70, with higher monthly benefits payable for delayed claims. While numerous studies have established that the terms of delay are actuarially generous (see, e.g., Meyer and Reichenstein Reference Meyer and Reichenstein2010, Reference Meyer and Reichenstein2012; Sass et al. Reference Sass, Sun and Webb2013; Shoven and Slavov Reference Shoven and Slavov2014a, Reference Shoven and Slavov2014b), most individuals claim benefits well before age 70. Maurer et al. (Reference Maurer, Mitchell, Rogalla and Schimetschek2018, Reference Maurer, Mitchell, Rogalla and Schimetschek2021) examine the impact of paying the gains from delay as a lump sum on claiming intentions. Their survey evidence (Maurer et al. Reference Maurer, Mitchell, Rogalla and Schimetschek2018) suggests that paying the gains from delay as a lump sum makes delaying both claiming and retirement more attractive.
The policy experiment we focus on began in 2005 and ended in 2016. Between 1975 and 2005, individuals could delay their state pension for up to five years, receiving an additional 1/7 of 1 percent of the benefit payable at pension age for every week of delay. This adjustment amounted to an approximately 7.5 percent increase in benefits per year of delay. The Pensions Act of 1995 increased the generosity of deferral to 10.4 percent per year of deferral and removed the five-year limit, with changes to go into effect in 2010. However, in 2002, the Labor Government called for moving the implementation forward to 2006. Subsequently, the Pensions Act of 2004 brought the implementation forward to April 6, 2005, and added a lump sum option (Thurley Reference Thurley2017). The lump sum was calculated by adding interest – at a rate that is at least 2 percent above the Bank of England base rate – to any forgone benefits during the delay period (Pension Service 2008). In addition, the lump sum was taxed at the tax bracket determined by other income, excluding the lump sum. Thus, delaying benefits to a period where individuals have lower earnings could result in significant tax savings. Subsequent legislation passed in 2014 made the terms of delay less generous and removed the lump sum option for individuals reaching state pension age on or after April 6, 2016.
Theoretically, making the terms for delay more generous should reduce the fraction of individuals claiming at the earliest eligibility age (65 for men and 60 for women). For later ages, the increased generosity of the actuarial adjustment should discourage claiming as well. On the other hand, the ability to receive the accumulated gains from delay as a lump sum may encourage claiming at older ages, particularly given that people seem to value lump sums more than actuarially equivalent annuities. Other factors may also reduce the impact of the policy at all ages, particularly among those with limited income or wealth. Specifically, borrowing constraints may prevent those with low wealth from delaying (unless they are willing to continue working to finance living expenses), and those who receive means-tested benefits (such as the pension credit) are not allowed to delay.
Regarding the labor supply impact, Kanabar and Simmons (Reference Kanabar and Simmons2016) suggest that, in the absence of borrowing constraints, those who defer would also choose less work. More generous deferral incentives increase lifetime income, which should increase leisure and decrease labor supply. The ability to finance consumption with borrowing makes it feasible to retire earlier while also delaying pension receipt to take advantage of the actuarial adjustment. However, the impact on labor supply is less clear if people face borrowing constraints. Delaying pension receipt may induce liquidity constrained individuals to stay in the labor force longer to finance consumption during the delay period. The desire to work longer may induce labor supply changes at earlier ages as well. For example, younger individuals may increase their labor supply if continuous work experience improves their opportunities for remaining employed later in life.
We examine the claiming and labor supply behavior of individuals who reached pension age after the policy change (men born in 1940 or later, and women born in 1945 or later) compared to those who reached pension age before the policy change.Footnote 3 To account for possible trends in claiming and labor supply behavior across birth cohorts, we include linear or quadratic birth year trends in some specifications. We further examine trends in the age distribution of claiming and labor supply across individual birth years. Shifts in behavior that emerge starting with birth years 1940 for men and 1945 for women (or for birth years shortly after, if retirement plans are slow to adjust) are more likely to be attributable to the policy. In contrast, pre-existing birth year trends would arguably be inconsistent with a causal effect for the policy (although they may also be attributable to anticipation effects).
Overall, we find that the more generous deferral policy reduced men's likelihood of receiving a pension at age 65 by 4.8–7.8 percentage points depending on the specification. The policy also reduced their likelihood of receiving a pension at ages 66–68 in some specifications, although by smaller amounts. For women, when a linear birth year trend is included, we find negative point estimates of the policy's impact on pension receipt at ages 60–69, although the coefficients are only significant at ages 65 and older. An examination of claiming age distributions for individual birth cohorts suggests that these shifts began with males born in 1940 or shortly thereafter and females born in 1945 or shortly thereafter, and they continued for later cohorts. We find little evidence of pre-existing trends among earlier birth cohorts. Thus, our findings are consistent with a causal effect of the policy, rather than longer-term trends in claiming ages. The lack of pre-existing trends also suggests that there were no anticipation effects of the policy. However, the observed shifts in pension claiming are not clearly linked to labor supply changes. While we do observe post-policy increases in male and female labor supply around the earliest eligibility ages, the disaggregation by individual birth year suggests that these changes in labor supply cannot be separated from longer-term trends.
This paper is organized as follows. Section II describes our data and methodology. Section III presents our results. Section IV provides conclusions.
2. Data and methodology
2.1 Methodology
Our estimation strategy relies on the fact that the terms for delaying pensions became more generous in April 2005. Thus, men born in April 1940 or later, and women born in April 1945 or later, reached pension eligibility age (65 and 60, respectively) after the policy. Under the assumption that the policy primarily affects those who reached pension age after it went into effect, we define the control group as men born before 1940 and women born before 1945. We define the treatment group as men born in 1940 or later and women born in 1945 or later.Footnote 4 Based on this assignment, we estimate the following linear probability model:

In this equation, y i is our indicator for either pension receipt or working for an individual, i. The γ a represents the control group's probability of receiving a pension or working at different ages, a. We do not omit any age categories; by omitting the treatment dummy level instead, each β a represents the difference between the treatment group and control group's probability of claiming or working at age a. Finally, f(birthyear i) represents a continuous function of birth year. We consider both linear and quadratic functional forms to pick up any trends in claiming or retirement across cohorts. In the equations describing claiming behavior, age (a) runs from 60 to 69 for women and 65 to 69 for men. The earliest pension eligibility ages for men and women are 65 and 60, respectively, and we do not have data on pension receipt for individuals over the age of 69. In the equations describing work behavior, age runs from 55 to 70 for women and 60 to 75 for men. We perform the labor supply analysis on an expanded range of ages as the terms for pension deferral may affect labor supply both prior to eligibility and after claiming.
Our assignment of individuals to control and treatment groups is imprecise for two reasons. First, it assumes that those who reached pension age before the policy change would not have responded to the policy. Although most people claim as soon as they are eligible, the new policy allowed those who had already claimed their pensions before April 2005 to stop receiving them (Pension Service 2008). We would expect those who claimed just before the policy change to be most likely to take advantage of this provision. Second, because the policy was debated in advance, there could be anticipation effects among earlier birth cohorts. We would expect these two issues to show up in the data as a shift in behavior for control group individuals who are close to the cutoff birth years (i.e., men born in the late 1930s and women born in the early 1940s). A linear or quadratic birth year trend may not be sufficient to pick up these effects. If the policy has similar impacts on these cohorts that we code as untreated, the coefficients on treatment will be biased against finding effects of the policy. However, because retirement plans are made in advance and previously made retirement plans may be hard to change, the policy may not have a large effect on the choices of those born shortly before the cutoff birth years. In this case, there should not be bias in the estimates.
To address this issue more fully, we examine the age distribution of claiming and work for individual birth years by estimating the following linear probability model:

The variable definitions are the same as in equation (1), but this time we interact the age dummies with a set of dummies for each birth year, b. The omitted birth year, b 0, represents individuals who reached pension age just before the policy went into effect (men born in 1939 and women born in 1944). The coefficients of the age/birth year interaction terms, the β a,b's, show us how the probability of claiming or working at each age changes across birth years. For example, in the equation for males, β 66,1943 represents the change in the probability of claiming at age 66 for an individual born in 1943 relative to someone born in 1939. These interactions allow us to pinpoint more precisely how the distribution of claiming and working changed across birth cohorts.
In equation (2), a shift in the probability of claiming or working that begins for men born in 1940 (or shortly thereafter, if it takes time to change plans) would be consistent with a causal effect for the policy. A similar interpretation would apply to a shift that begins for women born in 1945 (or shortly thereafter). A shift that begins just before the cutoff birth years could be consistent with an anticipation effect or earlier cohorts putting their benefits on hold. Other trends across birth years would suggest that the estimated coefficients on the treated × age interactions in equation (1) reflect birth year trends that are not picked up by linear or quadratic functional forms.
An alternative way to address this issue is to perform a placebo check on equation (1) by estimating it under the assumption that the reform occurred earlier than it did. Specifically, we estimate equation (1) under the assumption that the reform was enacted in 2000, 2001, or 2002, and we use only the sample of men born before 1940 and women born before 1945. The ‘treatment group’ therefore includes those who reached pension age in 2000, 2001, or 2002, but before 2005. Finding a shift in the claiming or work distribution in the placebo specification could indicate an anticipation effect (the policy change was discussed starting in 2002) or earlier cohorts putting their benefits on hold due to other factors that are not policy related. It may also suggest that any shifts we estimate in equation (1) reflect longer-term trends in claiming or work probabilities rather than an effect of the policy.
An additional concern with our estimation strategy is that other changes to pension rules have occurred in recent decades. First, state pension eligibility ages have been rising. We separate the impact of the more generous adjustment for delay from changes in state pension eligibility ages by focusing on men born before 1954 and women born before 1950, whose state pension eligibility ages remained unchanged at 65 and 60 respectively.Footnote 5 Second, the terms for delay became less generous for those reaching state pension age on or after April 6, 2016. To address this issue, we limit our study period to 2015 and earlier.
Furthermore, because pension receipt requires an active choice (making a claim), observed deferral decisions may or may not reflect active choices. That is, some fraction of individuals who are observed to defer may have simply neglected to make a claim. Once they notice that they are not receiving their pension as expected, they are likely to claim, and that choice could look like a deferral in the data.Footnote 6 We do not have information on whether individuals in our dataset are making an active choice. However, our estimation of equation (1) should not be affected if the fraction of individuals who make passive choices either remains relatively constant across birth years or follows a linear or quadratic birth year trend. Our inference of the policy's effect from equation (2) should not be affected unless there is a change in the fraction of individuals making passive deferral decisions that coincides with the cohorts who are impacted by the policy.
2.1 Data
We use the UK Labour Force Survey (LFS) data from 1993 to 2015.Footnote 7 The LFS is the largest household survey in the UK, managed by the Office for National Statistics (ONS) in Great Britain and by the Northern Ireland Statistics and Research Agency (NISRA) in Northern Ireland. The survey provides detailed information on the UK labor market and is used as the source of official employment statistics for the UK. The LFS is conducted quarterly and the sample size in each quarter is about 90,000 individuals. The survey has a panel aspect, as an individual can be interviewed in up to five waves. However, the publicly available data do not include identifiers that allow us to link individuals across waves or cluster standard errors by individual. In our estimates of equation (1), we instead cluster standard errors by birth year. In our estimates of equation (2), clustering on birth year yields standard errors that are much smaller. Therefore, to err on the conservative side, we report standard errors that are not clustered.
The main outcome variables in this study are pension claiming status and employment. The LFS asks individuals aged 69 and under whether they are receiving any state benefits; follow-up questions request more specific information about what types of state benefits they are receiving. We define a pension claiming indicator based on whether the individual is receiving state pension benefits. Individuals aged 16 and older are asked about their economic activity. We define an individual as employed if he or she reports being an employee, self-employed, or a government worker.
Age is defined as the individual's age at the end of the reference week. Unfortunately, the public use LFS survey does not contain individuals' exact birth dates; we can only estimate a person's birth year as the survey year minus the person's age. Under this estimation, men born in early 1940 and women born in early 1945, who reached pension age before the policy went into effect, are included in the treatment group. Moreover, individuals interviewed before their birthday will be classified as being born one year later than their actual birth year. Thus, some men born in 1939 and some women born in 1944 are included in the treatment group if they were interviewed before their birthday. We would expect these misclassifications to add noise to the estimates and bias the results towards not finding an effect of the policy.
Another data limitation worth mentioning is that the LFS does not contain information on whether individuals are eligible for a state pension. Thus, individuals who are ineligible are incorrectly recorded as delaying their pension, as they are not observed to receive a pension. If the fraction of ineligible individuals remains consistent across birth cohorts, our estimates of the changes in the age distribution of pension receipt (equations (1) and (2)) should be valid. However, there may be birth year trends in pension eligibility that are not accounted for by the linear or quadratic birth year trends. Moreover, eligibility criteria were relaxed for those reaching pension age on or after April 6, 2010 (Bozio et al. Reference Bozio, Crawford and Tetlow2010). All the women in our sample are born before 1950 and therefore reach pension age by 2010; however, some men in the sample reach pension age in 2010 or later. We do not expect these issues to cause much bias as more than 95 percent of the 69-year-olds in most birth years in our sample are receiving pensions, suggesting that the fraction who are ineligible in any given birth year is small. However, to check robustness, we re-estimate equations (1) and (2) after restricting the sample to men born before 1945 (who reach age 65 before 2010).
In addition, some individuals may be less likely than others to respond to the policy change. As discussed above, liquidity constrained individuals have less flexibility in adjusting their claiming behavior, and if they do adjust, they are likely to increase their labor supply. In contrast, individuals who are not liquidity constrained are likely to delay their pensions and decrease their labor supply due to the income effect. Moreover, individuals who receive means tested benefits cannot defer their pension claiming. Unfortunately, the LFS does not allow us to identify individuals who are more or less likely to respond to the policy. The survey does not include consistent data on wealth or educational attainment that could allow us to infer whether an individual is likely to be liquidity constrained. The means tested benefit that is most relevant to this age group is the pension credit; however, the LFS only asks respondents about the receipt of the pension credit starting in the second quarter of 2014. According to administrative data, approximately 21 percent of pensioners receive the pension credit.Footnote 8 Including individuals who are either liquidity constrained or receiving means tested benefits in the sample is likely to bias the pension claiming equations towards showing no effect. The coefficients in the employment equations are also likely to be biased towards zero as the sample includes both liquidity constrained and non-liquidity constrained individuals.
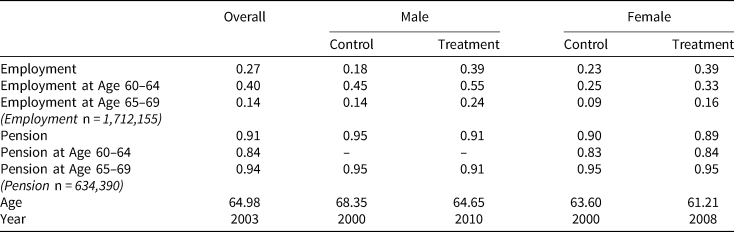
Table 1 shows the summary statistics of the main variables for our sample. The number of observations for the employment analysis is 1,712,155, and about 27 percent of these respondents are employed. The number of observations for the pension claiming analysis is 634,390, and 91 percent of these pension-aged respondents receive pensions. The average age is 65 years old. The summary statistics are further divided by gender and control/treatment group in the last 4 columns. We also provide employment and pension for women and men aged 60–64 and 65–69, representing the first 5 years after the female and male eligibility ages, respectively. For both men and women, the share of respondents who are employed is higher in the treatment group than in the control group across age groups. The share receiving a pension at ages 65–69 is lower in the treatment group for men, whereas it is slightly higher in the treatment group at ages 60–64 for women.
Descriptive Statistics

Note: The sample includes women born before 1950 and men born before 1954. The sample period is 1993 Q1-2015 Q4. The overall sample includes women with ages 55–70 and men with ages 60–75. For the pension variable, the period begins in 1998 Q2 and ages cover women 60–69 and men with 65–69.
Source: Authors' calculations using UK Labour Force Survey.
3. Results
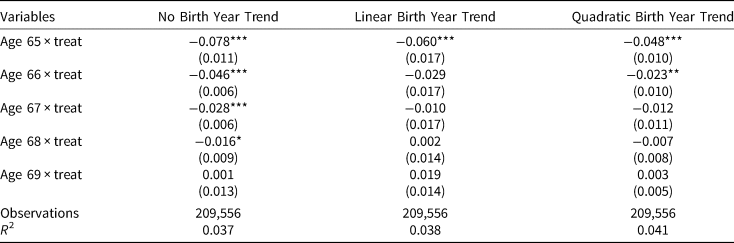
Table 2 shows results from estimating equation (1) for males, with pension receipt as the dependent variable. Each cell reports the β a for the age given in the row. The three separate columns show results with no birth year trend, a linear trend, and a quadratic trend, respectively. These coefficients show that the probability of pension receipt among 65-year-olds is 4.8–7.8 percentage points lower in the treatment group compared to the control group, depending on the birth year trends. The probability of pension receipt is also generally lower at ages 66-68, although the size and statistical significance vary by specification.
Impact of Deferral Policy on Male Claiming

Notes: Standard errors clustered by birth year in parentheses. Regressions also include age dummies.
Source: Authors' calculations using UK Labour Force Survey.
*** p < 0.01, ** p < 0.05, * p < 0.1.
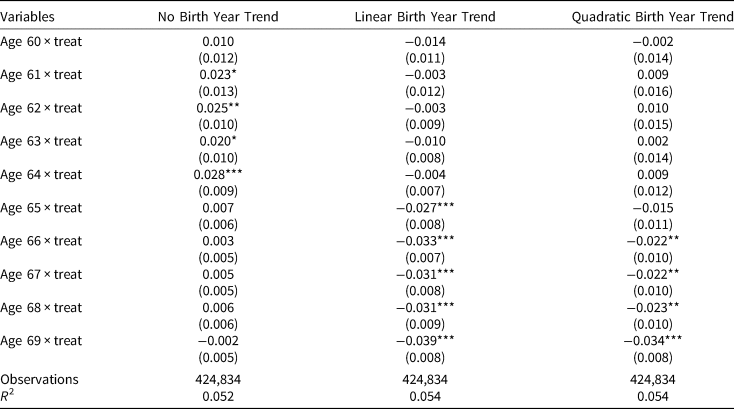
The pension results for females in Table 3 are more mixed. There is no statistically significant difference in the probability of pension receipt at age 60 between the control and treatment groups, although the point estimate from the model with a linear trend suggests that the treatment group claiming probability could be 1.4 percentage points lower. The model without birth year trends suggests that the treatment group may experience an increase in claiming at ages 61 to 64. Both models with birth year trends show that there are decreases in claiming in the treatment group at ages 65 and greater, with most effects significant at the 5 or 1 percent level.
Impact of Deferral Policy on Female Claiming

Notes: Standard errors clustered by birth year in parentheses. Regressions also include age dummies.
Source: Authors' calculations using UK Labour Force Survey.
*** p < 0.01, ** p < 0.05, * p < 0.1.
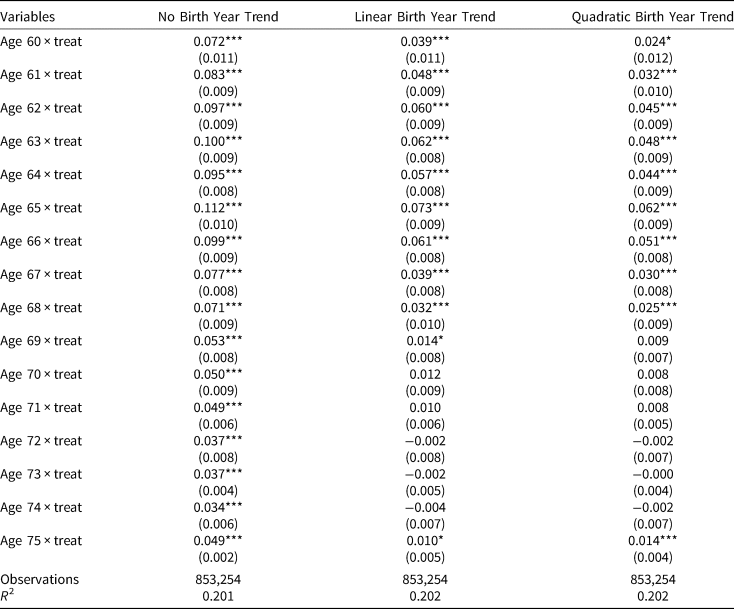
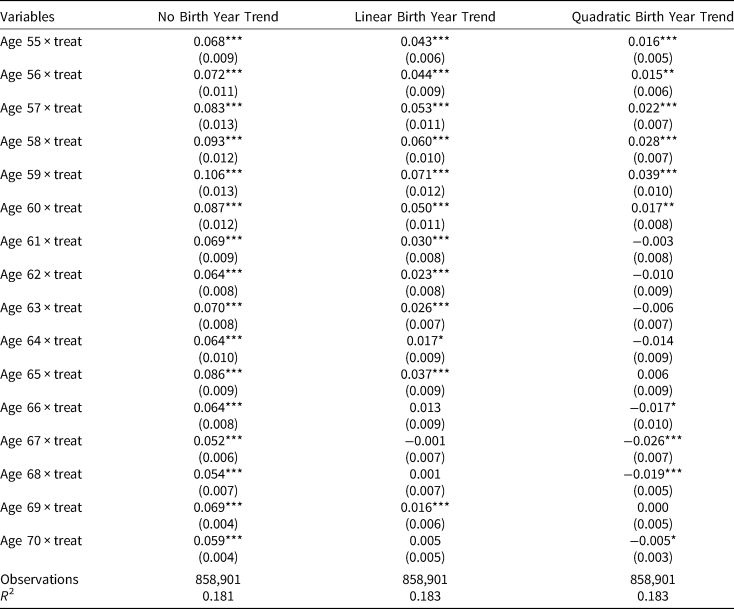
Tables 4 and 5 show the results from estimating equation (1) for men and women, respectively, with employment as the dependent variable. For men, across all specifications, the probability of employment at ages 60-68 is significantly higher in the treatment group than in the control group, with the largest increases at the pension age (age 65). Point estimates are smaller and the magnitudes and statistical significance decline at older ages when linear or quadratic trends are included. For women, across all specifications, the probability of employment at ages 55–60 is higher in the treatment group than the control group. Point estimates for ages above 60 are positive and strongly significant with no birth year trend. They are still mostly positive with a linear trend, but statistical significance declines. With a quadratic trend, some coefficients become negative and statistically significant.
Impact of Deferral Policy on Male Labor Supply

Notes: Standard errors clustered by birth year in parentheses. Regressions also include age dummies.
Source: Authors' calculations using UK Labour Force Survey.
*** p < 0.01, ** p < 0.05, * p < 0.1.
Impact of Deferral Policy on Female Labor Supply

Notes: Standard errors clustered by birth year in parentheses. Regressions also include age dummies.
Source: Authors' calculations using UK Labour Force Survey.
*** p < 0.01, ** p < 0.05, * p < 0.1.
While this evidence is consistent with the policy having an impact on claiming (particularly for men) and labor supply (for both men and women), we cannot rule out the possibility that the results in Tables 2–5 simply reflect birth year trends in the distribution of claiming and retirement ages that are not captured with the linear or quadratic functional forms. Moreover, we cannot say anything about anticipation effects. These issues can be dealt with more fully by examining the β a,b coefficients from equation (2).
Figure 1 plots the estimates of β a,b for men from the regression in which claiming is the dependent variable. Each panel in the figure represents a claiming age, a. For example, the top left panel shows the estimates of β 65,b. Confidence intervals are included for all estimates except β 65,1939, as 1939 is the reference group. The panel suggests that the probability of pension receipt at age 65 is lower for cohorts born in 1940 and later, compared to the 1939 cohort, and there is a more pronounced impact for cohorts born in 1943 and later. While there appears to be a downward trend among cohorts reaching pension age prior to the policy change – a finding that casts some doubt on the causal role of the policy – the coefficients for other claiming ages are more in line with a causal effect. For example, the estimates of β 66,b are relatively constant for cohorts turning 65 before the policy change, and there is a downward trend beginning with the 1940 birth cohort. (The coefficient for the 1940 birth cohort is not significantly different from zero; however, this cohort turned 65 in the year in which the policy went into effect and may not have had a chance to adjust their plans.) Estimates of β a,b for other ages are similar – generally constant for cohorts turning 65 before the policy went into effect, before starting to trend downwards for cohorts born in 1940 or 1941.
Impact of deferral policy on male claiming.

Figure 2 plots the estimates of β a,b for women from the regression in which claiming is the dependent variable. For women, the reference category is the 1944 birth cohort, whose members turned 60 just before the policy went into effect in 2005. In contrast to Table 3, these results are more suggestive of a causal effect for the policy at all ages, including at and shortly after the earliest eligibility age. At all ages, there is either a flat or upward trend in claiming for cohorts turning age 60 before the policy went into effect. Those flat or upward trends reverse starting with the 1945, 1946, or 1947 birth cohorts, who reached pension age at or shortly after the policy went into effect.
Impact of deferral policy on female claiming.

The results in Figure 2 further illuminate those reported in Table 3. In the first column of Table 3, the omission of a birth year trend results in a comparison of mostly pre-1944 cohorts with cohorts born in 1945 or later. The pre-1944 cohorts have a lower probability of claiming than the 1944 cohort due to the upward trend. The cohorts born in 1945 and later have an overall higher probability of claiming than the pre-1944 cohorts, although their probability of claiming is lower than that of the 1944 cohort. Similarly, for ages 60–64, the quadratic birth year trend masks the upward trend in claiming followed by the reversal for treated cohorts. However, the linear trend picks up the post-policy deviation from the pre-policy upward trend.
Figures 3 and 4 plot the estimates of β a,b for men and women, respectively, from regressions in which employment is the dependent variable. In both figures, there appears to be an upward trend across birth years in the probability of employment at and shortly after pension eligibility age. That trend is difficult to distinguish from a shift caused by the policy and affecting cohorts reaching pension age after the policy change. Thus, we conclude that the policy does not cause clear changes in employment.
Impact of deferral policy on male labor supply.

Impact of deferral policy on female labor supply.

We also consider placebo checks, in which we estimate equation (1) under the assumption that the policy went into effect in 2000, 2001, or 2002, using only individuals who we define as not treated (that is men born before 1940 and women born before 1945).Footnote 9 In the placebo pension claiming regressions, the coefficients for ‘treated’ individuals generally become smaller in size and less significant. (For women, some even become positive and significant.) We see similar patterns in the employment regressions. Overall, these placebo results suggest that the larger and more significant effects that we see in the main results are due to the impact of the policy. However, considering the trends observed in Figures 3 and 4, we hesitate to conclude that the policy caused a change in employment patterns. The results in Tables 2 and 4 are also robust to restricting the sample to men who turn 65 before 2010. These men were unaffected by the relaxation of state pension eligibility requirements in 2010.Footnote 10
We finally note that our claiming results are consistent with administrative data on pension claims by age – shown in Figures 5 (for men) and 6 (for women) – which also provide some indication of delayed claiming in response to the policy.Footnote 11 Each line in the figures depicts the state pension caseload at specific ages over time (measured in February, May, August, and November of each year). We see that in May of 2005, shortly after the policy took effect, pension claims for 65-year-old men and 60-year-old women begin to fall. These are the ages at which men and women, respectively, are first eligible for pensions. The pattern is therefore consistent with the policy causing a decrease in early pension uptake. For 61-year-old women and 66-year- old men, pension claims begin to fall in May of 2006, consistent with continued delay by those impacted by the policy. The pattern continues in subsequent years.
Number of men receiving state pension (administrative data).

Number of women receiving state pension (administrative data).

4. Conclusions
In this paper, we have examined the impact of a policy change that made state pension deferral more attractive on claiming and labor supply behavior. Overall, the results suggest that the more generous terms for delaying state pensions that went into effect in 2005 are associated with delayed claiming among birth cohorts who reached pension age after the policy went into effect. For men, claiming probabilities at most ages are relatively constant across birth cohorts reaching age 65 before the policy went into effect. They begin to decline for birth cohorts reaching age 65 at or shortly after the policy went into effect. For women, the policy appears to reverse either upward or flat trends in claiming probabilities across birth cohorts. Both men and women experience a post-policy increase in employment around their earliest eligibility ages. However, a disaggregation by birth year suggests that these shifts cannot easily be distinguished from birth year trends. We do not find evidence of anticipation effects for either claiming or retirement. Overall, changing pension incentives may be an effective way to delay pension uptake. However, at least in this instance, it is not clear that such incentives will extend working lives.