
Introduction
Graphene, as one of many stable carbon (C) allotropes, is the two-dimensional (2D) arrangement of C atoms on a hexagonal lattice structure. Even though, theoretical studies of graphene went back to 1940s,[ Reference Wallace 1 ] the experimental work on graphene has started in 2004, by Geim and Novoselov and their discovery of isolation of single-layer graphene by using the so-called scotch tape method,[ Reference Novoselov, Geim, Morozov, Jiang, Zhang, Dubonos, Grigorieva and Firsov 2 ] and number of publications both experimental and theory are getting exponentially increased since then. Graphene is an exceptional material with its unique properties such as high electrical and thermal conductivity,[ Reference Ziegler 3 , Reference Sarma, Adam, Hwang and Rossi 4 ] excellent electronic mobility,[ Reference Shishir and Ferry 5 , Reference Banszerus, Schmitz, Engels, Dauber, Oellers, Haupt, Watanabe, Taniguchi, Beschoten and Stampfer 6 ] and mechanical strength[ Reference Zandiatashbar, Lee, An, Lee, Mathew, Terrones, Hayashi, Picu, Hone and Koratkar 7 ] by far than any other materials. In graphene, four outer shell electrons make three σ bonds in plane and leaving one out of plane p z orbital available for electronic conduction. These σ bonds formed by the sp 2 orbitals give graphene excellent mechanical and thermal properties. Graphene is around hundred times stronger than the strongest steel, and it is quite flexible. The highly mobile p z orbital electrons are located above and below the graphene sheet, and they give graphene excellent electronic properties such as Dirac-type energy dispersion, high mobility, etc. Dirac-type energy dispersion in graphene implies that electrons have zero effective mass, and lack of electronic bandgap enables ballistic carrier transport around symmetry points.
Graphene can be synthesized by using different methods such as chemical vapor deposition (CVD),[ Reference Li, Colombo and Ruoff 8 ] epitaxial graphene growth on silicon carbide,[ Reference Emtsev, Bostwick, Horn, Jobst, Kellogg, Ley, McChesney, Ohta, Reshanov, Röhrl, Rotenberg, Schmid, Waldmann, Weber and Seyller 9 ] electrochemical exfoliation,[ Reference Li, Müller, Gilje, Kaner and Wallace 10 , Reference Su, Lu, Xu, Chen, Khlobystov and Li 11 ] and micromechanical exfoliation[ Reference Novoselov, Geim, Morozov, Jiang, Zhang, Dubonos, Grigorieva and Firsov 2 ] from bottom–up to top–down approaches, which vary the product in quality, size, and quantity according to the purpose of applications. The optimization of synthesis of graphene is going to promote and shape the technologic advancements in materials science-integrated application platforms, which demand large-scale, high-quality, and uniform graphene in order to utilize devices in cutting-edge nanoscale electronics, optics, spintronics, etc. CVD grown graphene on copper (Cu) substrate is the most promising, prevalent materials source for device fabrication process by its compatibility with academic and industrial demand.
CVD is the most studied graphene production method for building the prototypes of next-generation electronic devices thanks to its scalability; however, there is still not an ultimate consensus of growth mechanisms on control of the size and morphology of synthesized crystals. The varying results in different laboratories imply the necessity to reach better optimization to enhance materials processing. Graphene synthesis by CVD employs the formation process through primarily the nucleation and growth of C atoms on the surface of Cu right after the thermal decomposition of hydrocarbon precursors. The details of nucleation of C atoms on Cu surface and kinetics of gaseous species determine the quality of graphene. Significant improvement has been achieved in graphene growth by investigating fundamental variables. Han et al. have found that graphene growth is affected by Cu surface morphology as smooth surface lowers nucleation density and yields larger graphene domains.[ Reference Han, Gunes, Bae, Kim, Chae, Shin, Choi, Pribat and Lee 12 ] The effect of base pressure of CVD growth of graphene regulates the coverage as the higher sublimation rate of Cu leads to desorption of C adatoms, hence reduces the graphene nucleation density in low-pressure CVD, while the Cu desorption in atmospheric pressure CVD is negligible due to higher activation energy.[ Reference Vlassiouk, Smirnov, Regmi, Surwade, Srivastava, Feenstra, Eres, Parish, Lavrik, Datskos, Dai and Fulvio 13 ] The effect of hydrogen (H2) exposure on graphene growth forms the morphology and thickness as the lower dosage of H2 would manage the multiple layer graphene formation quickly, then succeeding high dosage of H2 for etching to single-layer graphene.[ Reference Zhao, Cheng, Zhao, Yin, Zhang, Song, Yin, Song, Wang, Wang, Xia and Wang 14 ] The Cu surface active sites (surface irregularities) act as favorable C nucleation centers due to its low-energy barrier for CVD of graphene. The oxygen (O2) exposure before the growth of graphene leads to the formation of Cu oxide layer by partial oxidization on Cu surface, which reduces the C nucleation density through the passivation of the catalytic active sites.[ Reference Hao, Bharathi, Wang, Liu, Chen, Nie, Wang, Chou, Tan, Fallahazad, Ramanarayan, Magnuson, Tutuc, Yakobson, McCarty, Zhang, Kim, Hone, Colombo and Ruoff 15 ]
In this work, we systematically investigate the effect of O2 exposure on the CVD growth of graphene in a single-zone split horizontal quartz tube furnace. The O2 gas with varying concentrations is introduced into the quartz reaction chamber during the different steps of the thermal process. The detailed characterization of the morphologic, structural, and chemical properties has been performed by various microscopic and spectroscopic techniques.
Methods
Materials synthesis
Electropolishing of Cu foils
It is a well-understood procedure that the smoothing of Cu foils prior to growth helps to improve the quality of graphene.[ Reference Kim, Hsu, Lee, Dresselhaus, Palacios, Kim and Kong 16 ] We cut (wrinkle-freely) Cu foils 2 cm × 1.5 cm × 20 µm in dimensions and set as an anode, then immerse the Cu foil in a solution with the larger and thicker Cu foil set as a cathode in a homemade electrochemistry cell. The electrochemical solution consists of 500 mL deionized (DI) water, 250 mL phosphoric acid (H3PO4), 250 mL ethanol (C2H6O), 50 mL isopropyl alcohol (IPA: C3H80), and 10 g urea (CH4N2O). A direct current power supply was used to apply 0.7 A of current at 2.7 V of potential for 100 s. After electro-polishing, the Cu foil was rinsed with DI water, further washed with IPA, and then blow-dried with nitrogen.
CVD of graphene on Cu foils
The graphene samples were grown by CVD method using three different recipes, referred as recipes I, II, and III [see the details of the recipes in the supplementary information (Supplementary Fig. S1 and Tables SI–SIII)]. Briefly, the furnace was heated up to 1000 °C with the heating ramp of 25 °C/min under a gas mixture of H2 (100 sccm) and Ar (400 sccm), and the growth pressure of 15 Torr was maintained during the entire process in all recipes. While the graphene samples were grown without introducing O2 in recipe I, O2 was introduced into the system before and during the growth of the graphene, respectively, for recipes II and III.
Transfer of graphene from Cu foils to SiO2/Si substrates
The grown graphene was transferred from Cu foil to the final substrate by electrochemical delamination method.[ Reference Wang, Zheng, Xu, Dubuisson, Bao, Lu and Loh 17 ] The transfer experiment was started with spin coating of poly (methyl methacrylate) [PMMA: (C5O2H8) n ] on graphene/Cu sample as a supporting layer. Next, we let the PMMA to dry 30 min under white light or bake it on a hot plate at 180 °C for 90 s. Electrolysis process took place in a homemade electrolytic cell by setting the trio of PMMA/graphene/Cu as a cathode while thick graphitic rod as an anode, and applying 1.7–2.1 V electrode potential in a solution 1 M of sodium hydroxide (NaOH). After separation from Cu, the PMMA/graphene was fished out of solution to DI water bath to cleanse the residual solution. PMMA/graphene were later transported to SiO2/Si (300 nm thick oxide), and dried up before acetone (C3H6O) bath cleaning. After removing the PMM layer by C3H6O washing, we completed transfer process with IPA rinsing and dry nitrogen blowing.
Materials characterization
X-ray photoelectron spectroscopy (XPS) characterization of graphene on Cu substrate was carried out using a Kratos AXIS ULTRADLD XPS system equipped with an Al Kα monochromated x-ray source, and a 165-mm mean radius electron energy hemispherical analyzer. The size of slot for XPS is 300 µm × 700 µm. The vacuum pressure was kept below 3 × 10⁻⁹ Torr, and the neutralizer was applied during the data acquisition. Microstructural analyses of graphene on Cu substrates were done by the FEI NNS450 scanning electron microscopy (SEM). Raman spectra of graphene on SiO2/Si substrate were collected using a Horiba system with a 532 nm excitation laser (<2 mW excitation power, 100× objective lens).
Results and discussion
As described in methods, graphene islands were grown on the Cu foils by CVD using three different recipes, recipes I, II, and III, to establish a conclusive comparison of the effects of the O2 that is introduced in the different stages of the thermal process with varying flow rates on the CVD growth of graphene. It should be noted that the graphene was intentionally grown in the form of islands, allowing us to understand how the O2 affects the shape, density, and thickness of the individual islands of graphene.
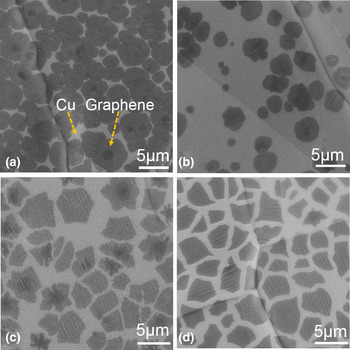
As a starting point, we characterized the graphene islands on the Cu foils by SEM. Figures 1(a) and 1(b) show the SEM images of the graphene islands grown by recipes I and II, respectively. The graphene islands can be easily distinguished from the Cu foils thanks to their sharp contrast to the Cu foils. Recipe I provides higher surface coverage of the graphene islands than that of the islands obtained by recipe II. Specifically, the density of the graphene islands is calculated to be ~0.164 and 0.054 µm−2 for recipes I and II, respectively. The decrease in the density of the graphene islands with the O2 exposure can be attributed to the passivation of the Cu surface, and thus reducing the nucleation sites.[ Reference Hao, Bharathi, Wang, Liu, Chen, Nie, Wang, Chou, Tan, Fallahazad, Ramanarayan, Magnuson, Tutuc, Yakobson, McCarty, Zhang, Kim, Hone, Colombo and Ruoff 15 ]
Surface morphology of graphene islands. SEM images of the graphene islands grown on the Cu foils by recipe I (a) and recipe II (b). SEM images of the graphene islands grown by recipe III using the O2 flow of 3 sccm (c) and 5 sccm (d).

We further investigated the role of O2 introduced during the growth step in the growth of the graphene islands, which has not been studied to date. Figures 1(c) and 1(d) show the SEM images of the graphene islands grown by recipe III using 3 and 5 sccm of O2 flow, respectively. The O2 is introduced to the reaction chamber in cooperation with CH4 and H2 during the growth. The presence of O2 during the growth yields more uniform coverage for O2 flow of 3 and 5 sccm [0.062 and 0.067 flake/(μm)2] in Figs. 1(c) and 1(d), respectively. The comparison of Figs. 1(c) and 1(d) points out that the O2 exposure during growth is optimized at the flow rate of 5 sccm, since Fig. 1(d) represents the most uniform coverage and thickness distribution of graphene islands. We conclude that introducing O2 during growth significantly improves the graphene uniformity while pre-dosing O2 before growth reduces the graphene nucleation density.
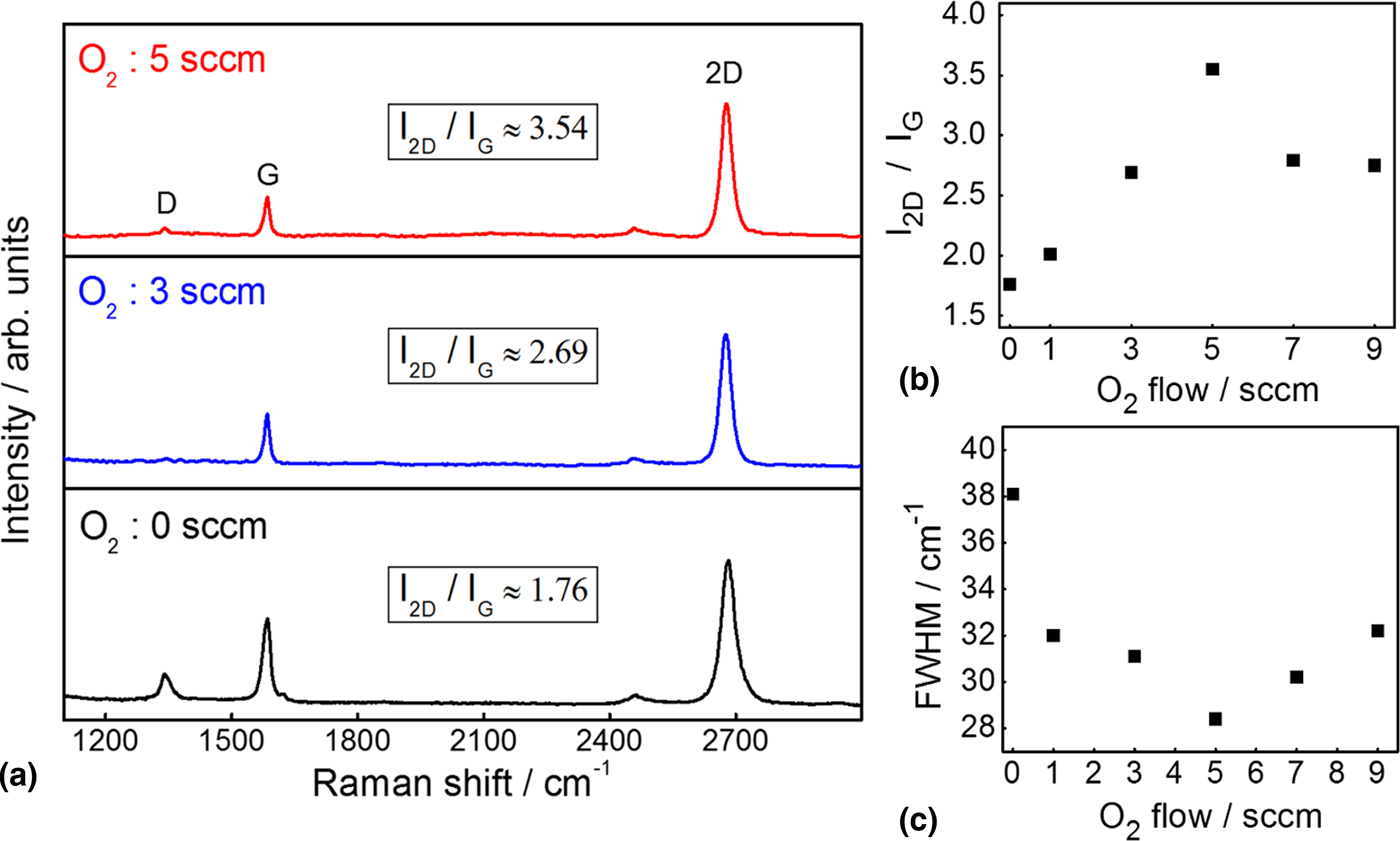
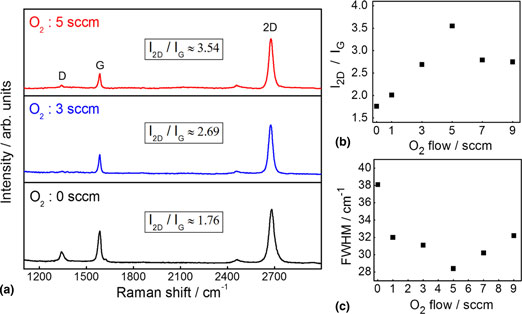
Raman spectroscopy is a non-destructive tool commonly used for the characterization of graphene as well as other 2D materials.[ Reference Ferrari 18 – Reference Mutlu, Ruiz, Wu, Ionescu, Shahrezaei, Temiz, Ozkan, Mkhoyan and Ozkan 24 ] Raman spectroscopy is further performed to obtain information about the thickness and crystallinity of the graphene islands that are transferred onto SiO2/Si substrates. Typical Raman modes as namely D (disorder band or defect band), G (in-plane vibrational mode), and 2D (second-order overtone of the D band) of the graphene islands grown under different O2 flow rates are shown in Fig. 2(a). Particularly, the Raman mode frequencies are located at 1340, 1588, and 2678 cm−1 for D, G, and 2D bands, respectively, for the top panel. The weaker Raman D band is a demonstration of lesser defective graphene structure. The graphene islands, which are grown in the presence of O2 exposure during the growth step, exhibit negligible Raman D band, exemplifying highly crystalline structure.
Raman spectroscopy characterization of graphene islands. Raman spectra comparison (a), intensity ratio of the Raman 2D and G peaks (b), and FWHM of the 2D peak (c) for the graphene islands grown under varying concentrations of O2.
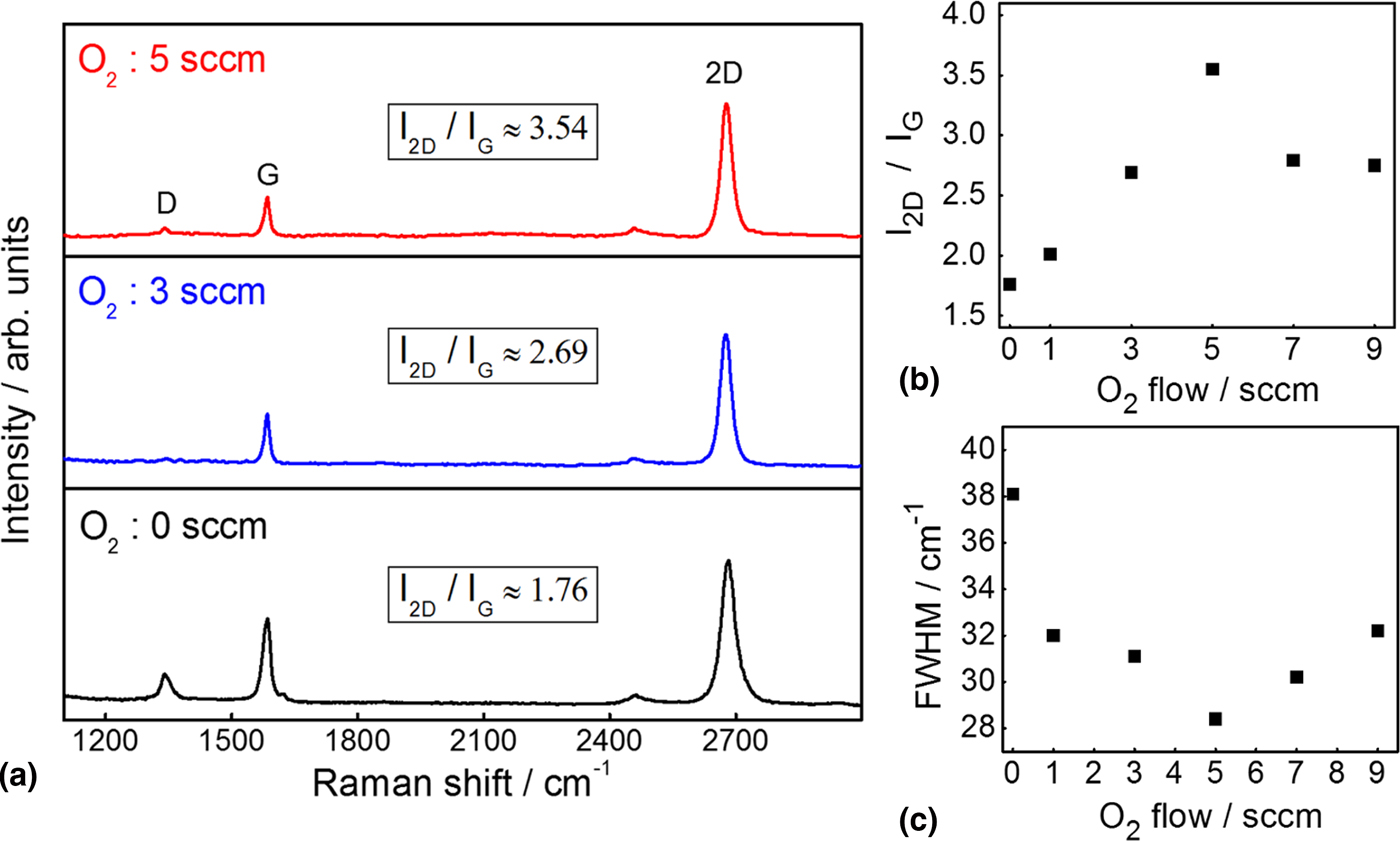
The intensity ratio of Raman 2D and G bands is utilized to evaluate the thickness and quality information of graphene. We observe the consistent trend of correlation between the Raman 2D/G intensity ratios and O2 flow rates of different regions on the graphene islands grown with each recipe. The Raman 2D/G band intensity ratio of the graphene islands grown by recipe III under O2 flow rate of 5 sccm is significantly higher than that of the samples grown under O2 flow rate of 3 sccm, and much higher than that of the growth held in the absence of O2 flow. The Raman 2D/G band intensity ratios of the graphene islands grown by recipe III, with various O2 exposure rates are plotted in Fig. 2(b). The Raman 2D/G band intensity ratio value is maximized for the graphene islands grown by recipe III under O2 flow of 5 sccm. The high Raman 2D/G band intensity ratio of the samples, which are grown with O2 flow during growth step, is the clear confirmation of single-layer, and high-quality (close to the value of micromechanically exfoliated) graphene.[ Reference Childres, Jauregui, Park, Cao, Chen and Jang 25 ] The sharpness of 2D Raman band is an indicator of crystallinity; peaks are getting sharper as the crystal quality of the graphene islands increases. The Raman 2D band full width at half maximum (FWHM) of the graphene islands grown by recipe III under different O2 flow rates is plotted in Fig. 2(c). The lowest (28.4 cm−1) value of 2D Raman band FWHM is measured for the graphene islands grown by O2 flow rate of 5 sccm. The sharp Raman 2D band signifies that the high-quality graphene islands are synthesized with the O2 exposure during the growth step. We observe that the excessive O2 flow (20 sccm) during the growth damages the quality of graphene by yielding defective and thicker crystals (Supplementary Fig. S2). The Raman 2D/G band ratio and FWHM values are summarized in the supplementary information (Supplementary Table SIV). The Raman spectroscopy analysis on the graphene islands designates the favorable growth under O2 flow of 5 sccm by recipe III. The Raman spectra (Supplementary Figs. S3–S6) of the graphene islands grown under various O2 flow rates are provided in the Supplementary information.
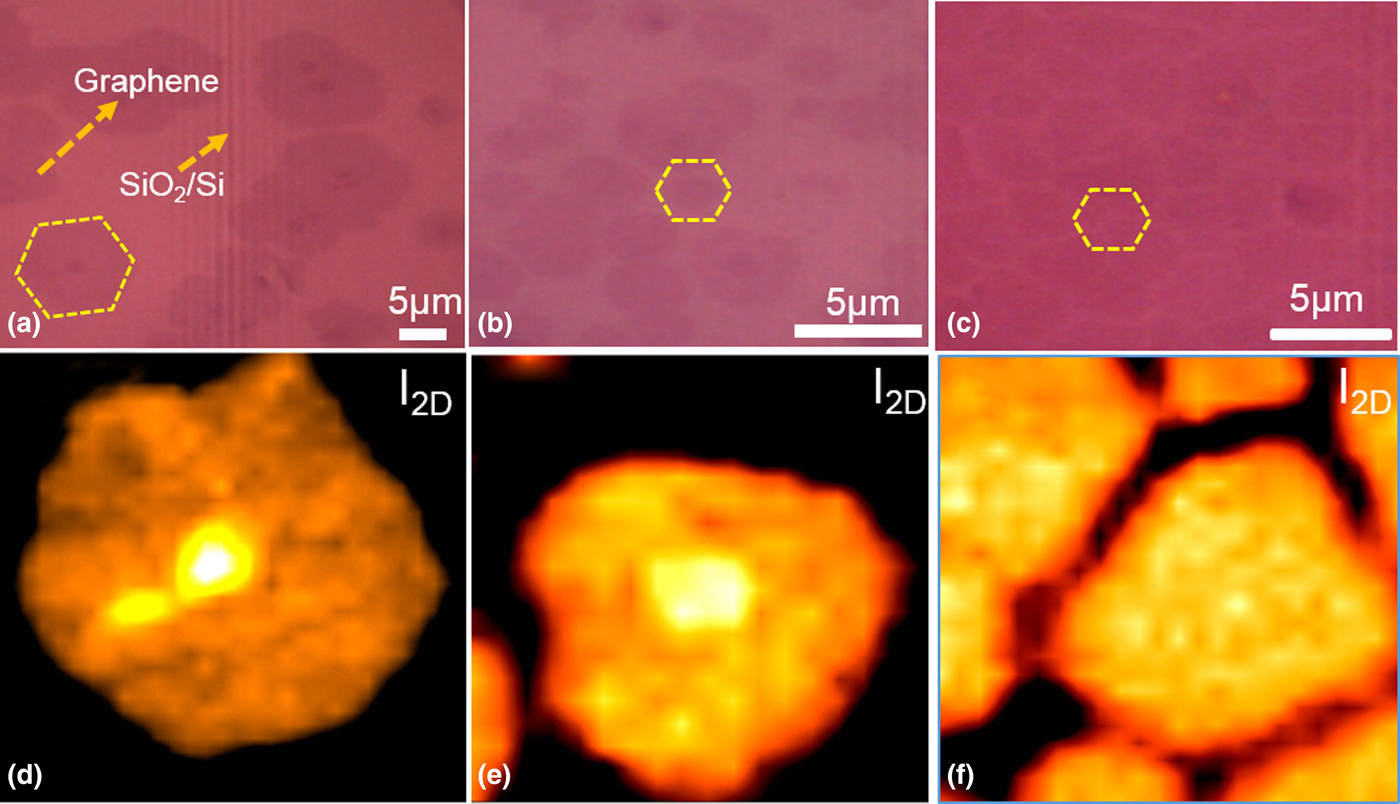
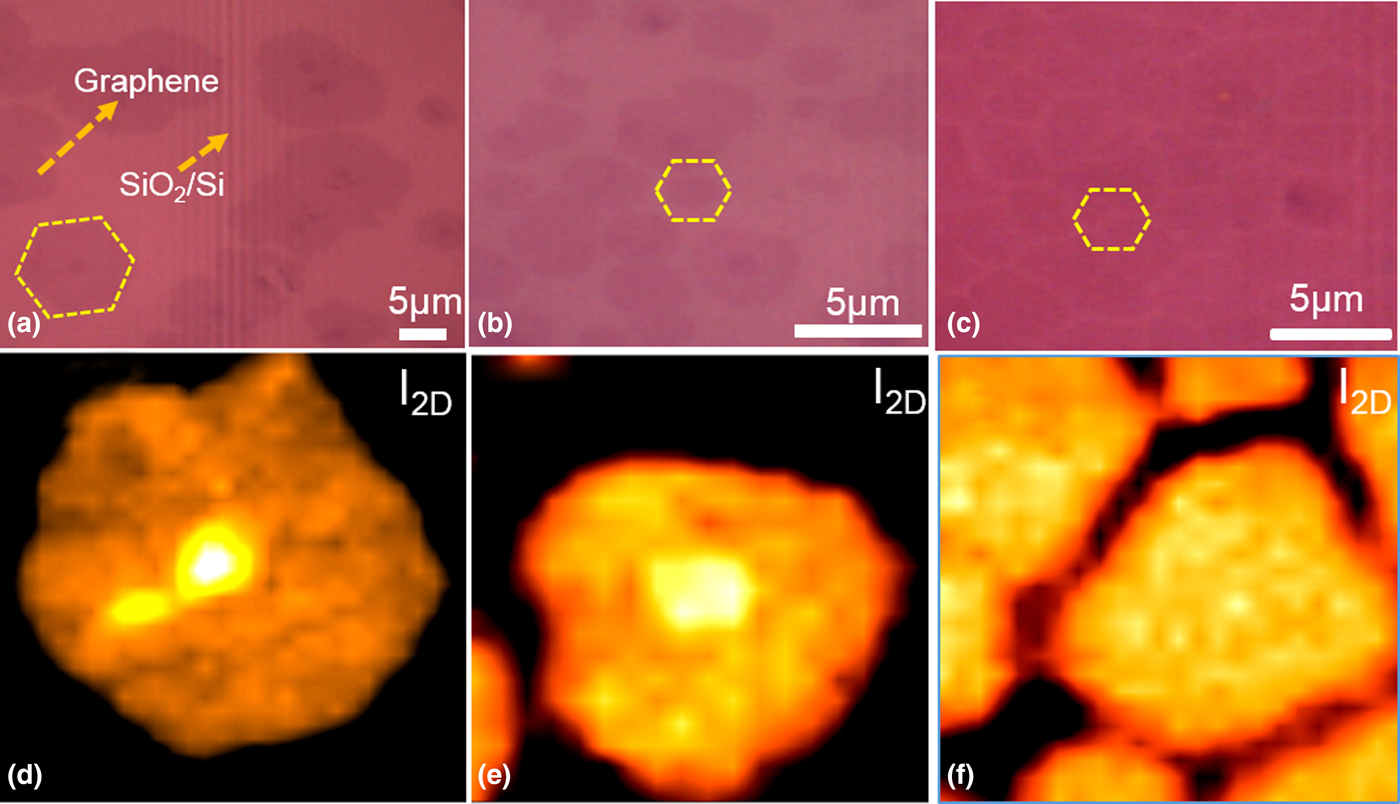
Raman mapping of the 2D band intensity has been proven to be useful for thickness identification of graphene.[ Reference Ni, Wang, Yu and Shen 26 ] Figure 3 shows the optical microscopy images and Raman mappings of the graphene islands grown by three different recipes, which are transferred on the SiO2/Si substrates. The Raman spectra (Supplementary Figs. S7–S9) of the various regions with different thickness on the mappings can be found in the Supplementary information. We observe that recipe I provides the graphene islands with a thickness ranging from single to a few layers as seen in Figs. 3(a) and 3(d). The graphene islands consisting single to bilayers are obtained by recipe II, as shown in Figs. 3(b) and 3(e). Introducing O2 just before the growth relatively improves the thickness uniformity of the graphene islands. On the other hand, the graphene islands grown by recipe III, in which O2 is introduced during the growth, have a uniform monolayer thickness in Figs. 3(c) and 3(f). We find that O2 exposure during the growth plays a key role to achieve complemental uniformity of the graphene islands synthesized by CVD. The Raman mapping confirms that the recipe III under O2 flow of 5 sccm yields uniform single-layer thickness distribution through Cu surface for graphene production.
Raman imaging of graphene islands. Optical images and corresponding Raman mappings of the graphene islands grown by recipe I (a, d), recipe II (b, e), and recipe III (c, f), respectively.
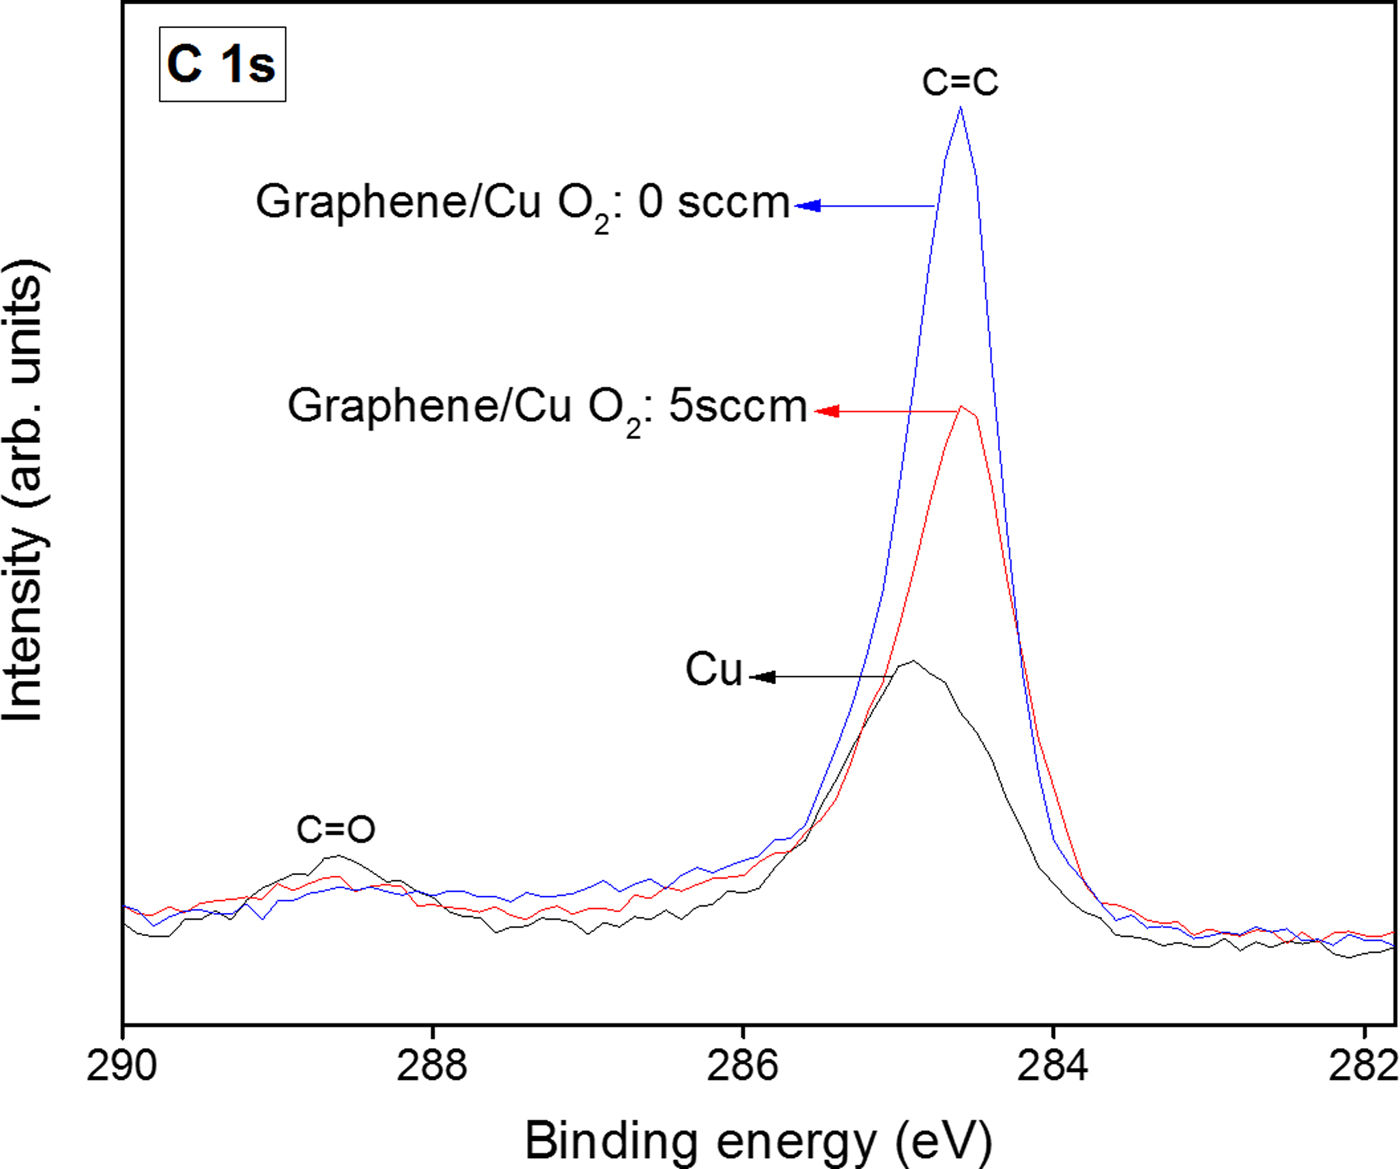
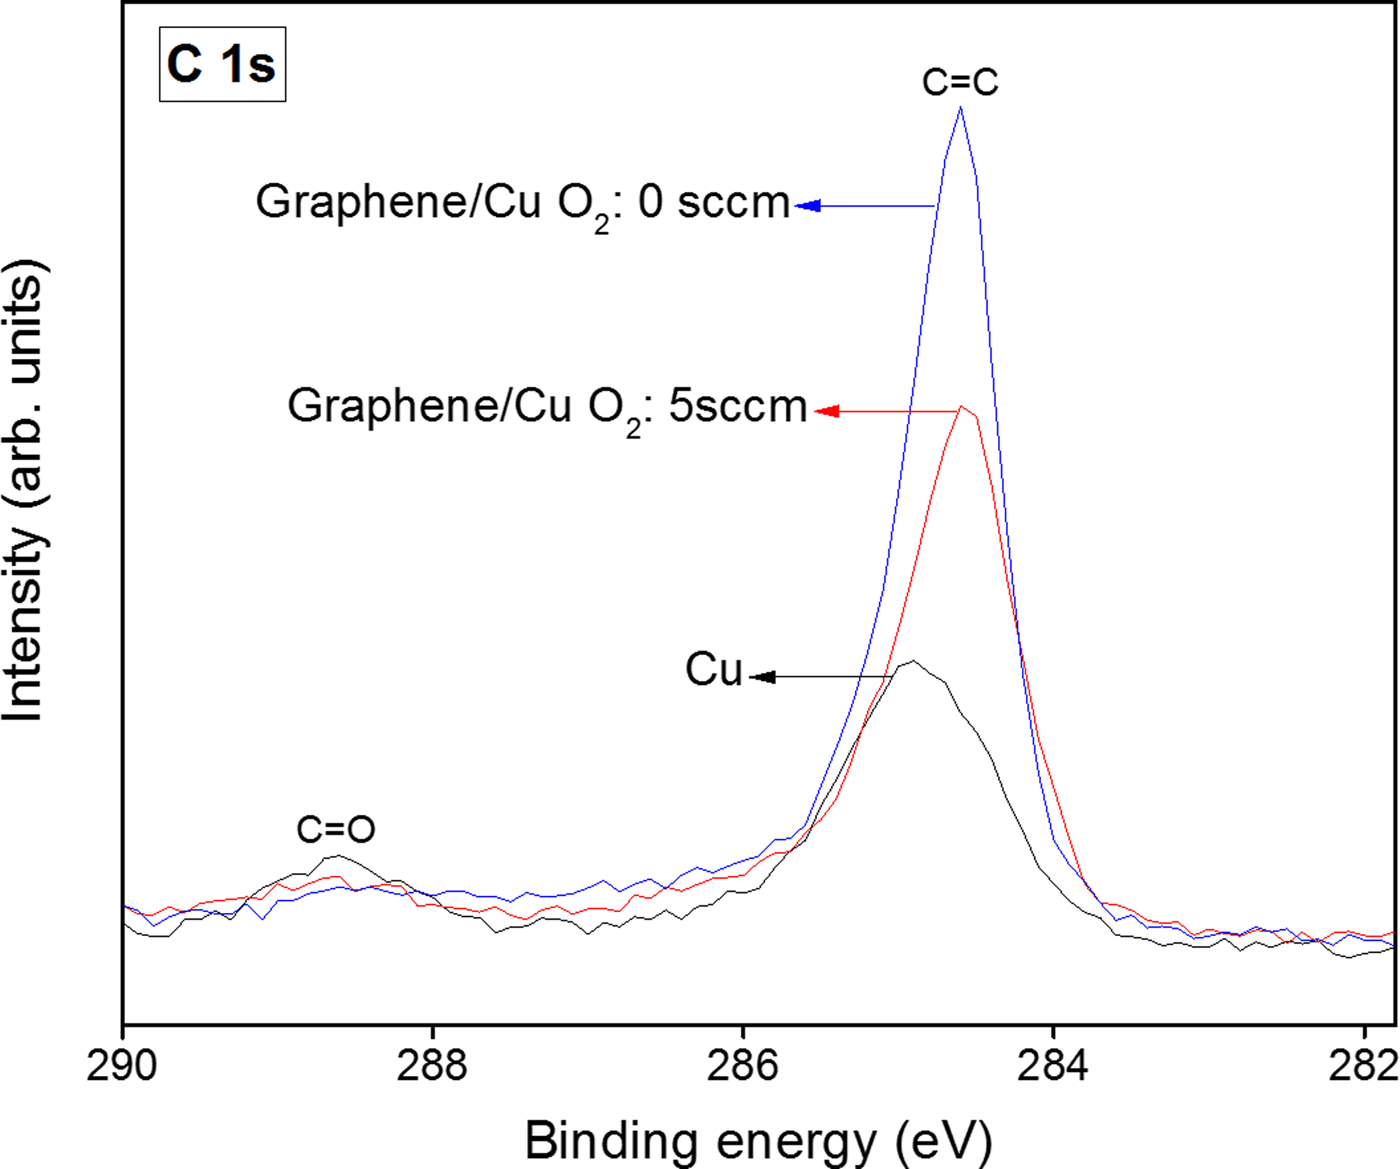
The surface chemistry of the graphene islands and Cu foils are investigated by XPS analysis.[ Reference Ferrah, Renault, Petit-Etienne, Okuno, Berne, Bouchiat and Cunge 27 ] The XPS survey spectra (Supplementary Fig. S10) of the graphene islands grown by recipe III under O2 flow of 5 sccm reveal that only C, Cu, and O elements are present on the surface, confirming the purity of the graphene islands. In Fig. 4, the C 1s core-level peak of graphene shows no sign of sp 3 binding, which implies defect-free, high-quality production. Compared with the graphene islands grown under O2 flow of 5 sccm, the graphene islands grown without O2 show the higher C 1s peak intensity, which indicates the higher graphene coverage, inconsistent with the SEM results above. The C 1s peak of the Cu foil is located at the binding energy (B.E.) of 284.6 eV, while it is shifted to the higher B.E. of 284.9 eV after graphene growth. The XPS spectra reveal a negligible amount of surface O2 regardless of the amount of O2 exposure. Thus, we can conclude that the O2 flow plays an important role in the graphene growth, while it does not cause any significant oxidation on the surface of the graphene islands. However, we note that excessive O2 exposure can lead to the growth of thicker graphene islands (Supplementary Fig. S11).
Surface chemistry of graphene islands. The XPS C 1s core levels of the Cu foil, and the graphene islands grown by recipes I and III.
Conclusion
In conclusion, we have systematically investigated the effect of O2 exposure during the growth in CVD system for high-quality graphene synthesis. We suggest that O2 exposure during the growth plays two important roles on graphene synthesis in CVD. The first effect is the suppression of nucleation density by passivating the Cu surface, and the second effect is the etching of graphene islands. The reduced nucleation density enables more uniform distribution of graphene islands through Cu surface. The etching of graphene islands provides more uniform thickness by yielding single-layer graphene island formation on Cu surface. The synthesis of high-quality and uniform graphene islands confirms that the optimization conditions are attained by the O2 exposure of 5 sccm during the growth.
Supplementary material
The supplementary material for this article can be found at https://doi.org/10.1557/mrc.2017.111.
Acknowledgments
This work was supported by the STARnet center C-SPIN (Center for Spintronic Materials, Interfaces and Novel Architectures), through the Semiconductor Research Corporation sponsored by the MARCO (Microelectronics Advanced Research Corporation) and the DARPA (Defense Advanced Research Projects Agency). X-ray photoelectron spectroscopy (XPS) was performed at the Analytical Chemistry Instrumentation Facility (ACIF) of the University of California, Riverside, which receives support from the NSF (National Science Foundation) through the MRI (Major Research Instrumentation) program (DMR-0958796).