Introduction
Wheat, one of the most vital cereal crops globally, is crucial to human food security (Kumar et al., Reference Kumar, Singh, Flessner, Haymaker, Reiter and Mirsky2023; Zhang et al., Reference Zhang, Xi, Zhang, He, Su, Fan, Wu, Kong and Shi2024). The demand for wheat yield and quality is increasing with the global population's continuous growth and climate change uncertainties (Mao et al., Reference Mao, Jiang, Tang, Nie, Du, Liu, Cheng, Wu, Liu, Kang and Wang2023; Patwa and Penning, Reference Patwa and Penning2023; Sun et al., Reference Sun, Ma and Wang2023). The yield and quality of wheat result from the combined effects of multiple factors, including agronomic traits such as grain weight and size, which directly impact the crop's overall value and market competitiveness (Tong et al., Reference Tong, Zhu, Liu, Chen, Zou, Zhang, Yang and Gao2021; Jin et al., Reference Jin, Yue, Yan, Zhang, Yang, Li, Shao and Fang2022). Additionally, genetic factors play a significant role in wheat improvement. Selecting and breeding wheat varieties with superior genetic characteristics can enhance yield and quality (Lopes et al., Reference Lopes, El-Basyoni, Baenziger, Singh, Royo, Ozbek, Aktas, Ozer, Ozdemir, Manickavelu, Ban and Vikram2015; Gao et al., Reference Gao, An, Guo, Chen, Zhang, Zhang, Chang, Rossi, Jin, Cao, Xin, Peng, Hu, Guo, Du, Ni, Sun and Yao2021; Satyavathi et al., Reference Satyavathi, Ambawat, Khandelwal and Srivastava2021).
Genetic improvement of wheat is a long and complex process, encompassing a wide range of approaches from traditional breeding to modern molecular breeding techniques (Zhang et al., Reference Zhang, Li, Zhu, Li, He, Sun and Li2021; Raj and Nadarajah, Reference Raj and Nadarajah2022). Historically, wheat breeding relied on natural variation and artificial selection, a time-consuming and inefficient method (Yu et al., Reference Yu, Hao, Li, Dong, Che, Wang, Song, Liu, Kong and Shi2022a; Guo et al., Reference Guo, Huang, Wang, Fu, Wang, Wang, Zhou, Hu, Wang, Yang and Han2023). With technological advancements, molecular breeding methods, such as marker-assisted selection (MAS) and gene-editing technologies, have been applied in wheat breeding, significantly accelerating the development of superior varieties (Xu et al., Reference Xu, Hu, Tao, Song, Gao and Guan2021; Wang et al., Reference Wang, Shi, Liang, Zhao, Wang, Liu, Chang, Hiei, Yanagihara, Du, Ishida and Ye2022). However, challenges remain in wheat genetic improvement, including limitations in genetic resources, the complex genetic background of traits and environmental uncertainties (Reynolds et al., Reference Reynolds, Lewis, Ammar, Basnet, Crespo-Herrera, Crossa, Dhugga, Dreisigacker, Juliana, Karwat, Kishii, Krause, Langridge, Lashkari, Mondal, Payne, Pequeno, Pinto, Sansaloni, Schulthess, Singh, Sonder, Sukumaran, Xiong and Braun2021; Zhou et al., Reference Zhou, Li, You, Tang, Mu, Jiang, Liu, Chen, Wang, Qi, Ma, Gao, Habib, Wei, Zheng, Lan and Ma2021; Adhikari et al., Reference Adhikari, Raupp, Wu, Wilson, Evers, Koo, Singh, Friebe and Poland2022).
In wheat genetics research, quantitative trait locus (QTL) analysis is essential for uncovering the genetic mechanisms that govern complex traits (Rosewarne et al., Reference Rosewarne, Herrera-Foessel, Singh, Huerta-Espino, Lan and He2013; Tong et al., Reference Tong, Sun, Wang, Zhang, Rasheed, Li, Xia, He and Hao2020; Muellner et al., Reference Muellner, Buerstmayr, Eshonkulov, Hole, Michel, Hagenguth, Pachler, Pernold and Buerstmayr2021). Researchers can identify critical genes or genomic regions by mapping QTLs associated with key agronomic traits, providing a basis for marker-assisted breeding (Li et al., Reference Li, Xiong, Guo, Zhou, Xie, Zhao, Gu, Zhao, Ding and Liu2020; Yang et al., Reference Yang, Boshoff, Li, Pretorius, Luo, Li, Li and Zheng2021; Wei et al., Reference Wei, Fang, Jiang, Wu, Zuo, Xia, Li, Stich, Cao and Liu2022). QTL analysis not only deepens our understanding of the genetic foundation of wheat but also offers new strategies for breeding, enhancing the precision and efficiency of breeding programmes.
This study aims to conduct an in-depth genetic analysis of grain traits in hexaploid wheat using the novel wheat-Agropyron germplasm Pubing3228. By performing QTL analysis on Pubing3228 and its progeny, we anticipate identifying QTLs and candidate genes closely associated with grain weight and size. These findings provide crucial genetic information for advancing wheat breeding techniques and variety improvement, especially in increasing wheat yield and enhancing quality. Furthermore, the innovation of this study lies in utilizing the wheat-Agropyron hybrid germplasm for QTL analysis, which not only helps to expand the genetic foundation of wheat but also has the potential to uncover new genetic resources that could improve wheat adaptability and yield. Therefore, this research holds significant scientific value and immense potential for practical application, especially for enhancing crop genetic diversity and global food security.
Materials and methods
Construction of the recombinant inbred line (RIL) population
A population of 210 F8-generation RILs derived from a cross between Pubing3228 and Jing4839 was established as the material for this study. Pubing3228, developed by Researcher Li from the Chinese Academy of Agricultural Sciences over many years, is a novel wheat germplasm originating from the progeny of common wheat ‘Fukuhokomugi’ and Agropyron cristatum accession Z55 (A. cristatum accession Z55) (Xu et al., Reference Xu, Ma, Zhang, Liu, Li and An2023). It exhibits stable genetic characteristics and multiple superior agronomic traits, particularly in yield. In the early 1990s, a hybrid between ‘Fukuhokomugi’ and A. cristatum accession Z55 was successfully obtained, leading to the selection of progeny lineage 4844 with prominent spike characteristics. Through multiple generations of selection of the wheat-Agropyron chromosomal addition line 4844-12 (2n = 44), the genetically stable derivative Pubing3228 was developed. Jing4839 is a cultivated variety known for its high grain weight. The two parental lines exhibit significant differences in agronomic traits, including yield.
Field trials and phenotypic identification
The Pubing3228/Jing4839 RIL population and its parental lines underwent field trials over three growing seasons in 2018/2019, 2019/2020 and 2020/2021 in Pingdingshan, Yangling and Xianyang under different environmental conditions. The trials were laid out in a randomized complete block design with three replicates per treatment. All materials were sown with 2.5 m between rows and 25 cm between plants. Field management followed local conventional practices. At maturity, five representative plants were randomly selected from the centre of each row for manual threshing. Subsequently, ten grains from each experimental unit were randomly selected to measure their length, width and thickness. Each measurement was repeated three times, with each repetition involving a different selection of ten grains. Similarly, for the thousand-grain weight (TGW) measurement, each replicate weighed a different set of 1000 grains. This approach was designed to capture the natural variability among grains from different tillers and florets. The replicated measurements were included in the statistical analysis to ensure the sample size was representative and the results robust.
DNA extraction and genotyping
DNA was extracted from the Pubing3228/Jing4839 RIL population using the SDS method. After assessing the quality and concentration, high-quality DNA samples were dissolved in TE buffer and sent for genotyping analysis using the Illumina Infinium iSelect 55 K SNP chip array at Beijing Boao Company. During data analysis, markers with more than 10% missing data, a minor allele frequency less than 5% or a heterozygosity rate higher than 20% were filtered out to ensure the quality of data for subsequent linkage map construction and QTL mapping analysis.
Linkage map construction and QTL mapping
The genetic linkage map of the Pubing3228/Jing4839 RIL population was constructed, and QTLs were mapped using QTL IciMapping software V4.2 (http://www.isbreeding.net). Initially, all SNP markers were preprocessed using the BIN function within the software to remove distorted, missing and redundant markers. Subsequently, high-quality polymorphic SNP markers were selected to construct the framework of the genetic linkage map through the MAP function's Grouping, Ordering and Rippling processes. The order and distance between markers were determined based on the maximum likelihood principle and the Kosambi mapping function. The genetic linkage map was further refined by removing SNP markers with a linkage distance of over 50 cm. This refined genetic linkage map was then used for QTL mapping analysis. The additive-complete composite interval mapping method (ICIM-ADD) was employed for QTL TGW, grain length, grain width and grain thickness analysis. A significant QTL LOD threshold was set at 2.5. QTL analysis was performed for each trait across different environments, and only QTLs detected in more than two environments were considered stable QTLs.
Identification of candidate genes
The physical regions of the chromosomes corresponding to the QTL confidence intervals were determined based on the sequences of the SNP markers flanking the QTLs. Subsequently, candidate genes within these physical regions were identified by accessing the JBrowse website (https://urgi.versailles.inra.fr/jbrowseiwgsc), which is based on the latest version of the Chinese Spring wheat genome sequence (IWGSC RefSeq v2.0) released by the International Wheat Genome Sequencing Consortium (IWGSC). Annotation information for these candidate genes was obtained from the wheat genome database website (https://wheat-urgi.versailles.inra.fr/Seq-Repository/Annotations). The expression patterns of these candidate genes across different tissues were compared using the expVIP website (http://wheat-expression.com) to select candidate genes associated with grain traits.
Results
Phenotypic variation in grain traits of the RIL population
In this study, we conducted a comprehensive analysis of grain traits in the Pubing3228, Jing4839 and their derived 210 F8-generation RIL population under five different environmental conditions (E1: Pingdingshan-2019, E2: Pingdingshan-2020, E3: Pingdingshan-2021, E4: Xianyang-2020, E5: Yangling-2021) (Table 1). Observations of four key traits – grain length, width, thickness and TGW – revealed that Jing4839 generally exhibited superior grain traits compared to Pubing3228.
Phenotypic values of grain traits for the Pubing3228/Jing4839 recombinant inbred lines (RIL) population and their parents in different environments
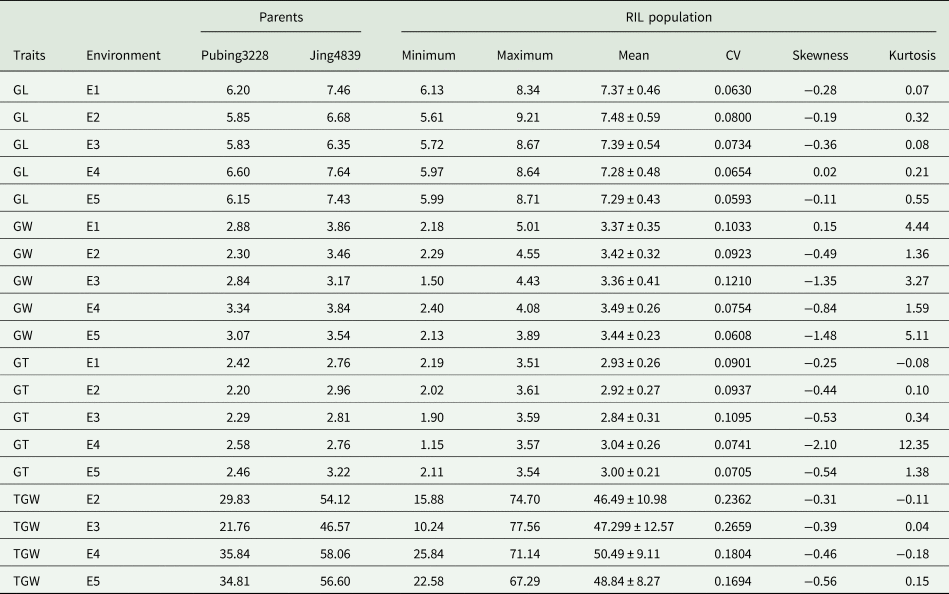
GL, grain length; GW, grain width; GT, grain thickness; TGW, thousand grain weight; E1, Pingdingshan-2019; E2, Pingdingshan-2020; E3, Pingdingshan-2021; E4, Xianyang-2020; E5, Yangling-2021; CV, coefficient of variation.
Significant phenotypic variation was observed in the grain traits within the RIL population. Grain length varied from 5.61 to 9.21 mm across the five environments, with an average length ranging from 7.28 to 7.48 mm. The variation in grain width was even broader, ranging from 1.50 to 5.01 mm across the environments, with average widths between 3.36 and 3.49 mm. Regarding grain thickness, the variation across different environments ranged from 1.15 to 3.61 mm, with average thicknesses between 2.84 and 3.04 mm. Notably, TGW variation within the RIL population was particularly significant, ranging from 10.24 to 77.56 g across different environments, with averages between 46.49 and 50.49 g.
Analysis of the coefficient of variation (CV) indicated that TGW exhibited the greatest genetic diversity, with CVs ranging from 16.94 to 26.59% (Fig. 1-1a–d). It was followed by grain width, which had CVs between 6.08 and 12.10% (Fig. 1-1e–i). The grain thickness (Fig. 1-2a–e) and length (Fig. 1-2f–j) CVs were mainly under 10%, indicating minor and consistent variations. Furthermore, the distribution of these traits followed a continuous normal distribution, suggesting that their genetic characteristics are consistent with the inheritance patterns of quantitative traits (Fig. 1).
Frequency distribution of grain traits in the Pubing3228/Jing4839 recombinant inbred lines (RIL) population under various environmental conditions.
Note: Figure 1-1. Thousand-grain weight and grain width of the Pubing3228/Jing4839 RIL population in five different environments; (a–d) represent thousand-grain weight (TGW) in four different environments (Pingdingshan-2019, Xianyang-2020, Pingdingshan-2021 and Yangling-2021), (e–i) represent grain width in the same five environments (Pingdingshan-2019, Pingdingshan-2020, Pingdingshan-2021, Xianyang-2020 and Yangling-2021); Figure 1-2. Grain thickness and length of the Pubing3228/Jing4839 RIL population in the same five environments; (a–e) represent grain thickness in five different environments (Pingdingshan-2019, Pingdingshan-2020, Pingdingshan-2021, Xianyang-2020 and Yangling-2021); (f–j) represent grain length in the five environments (Pingdingshan-2019, Pingdingshan-2020, Pingdingshan-2021, Xianyang-2020 and Yangling-2021).

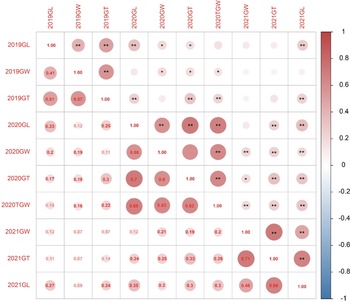
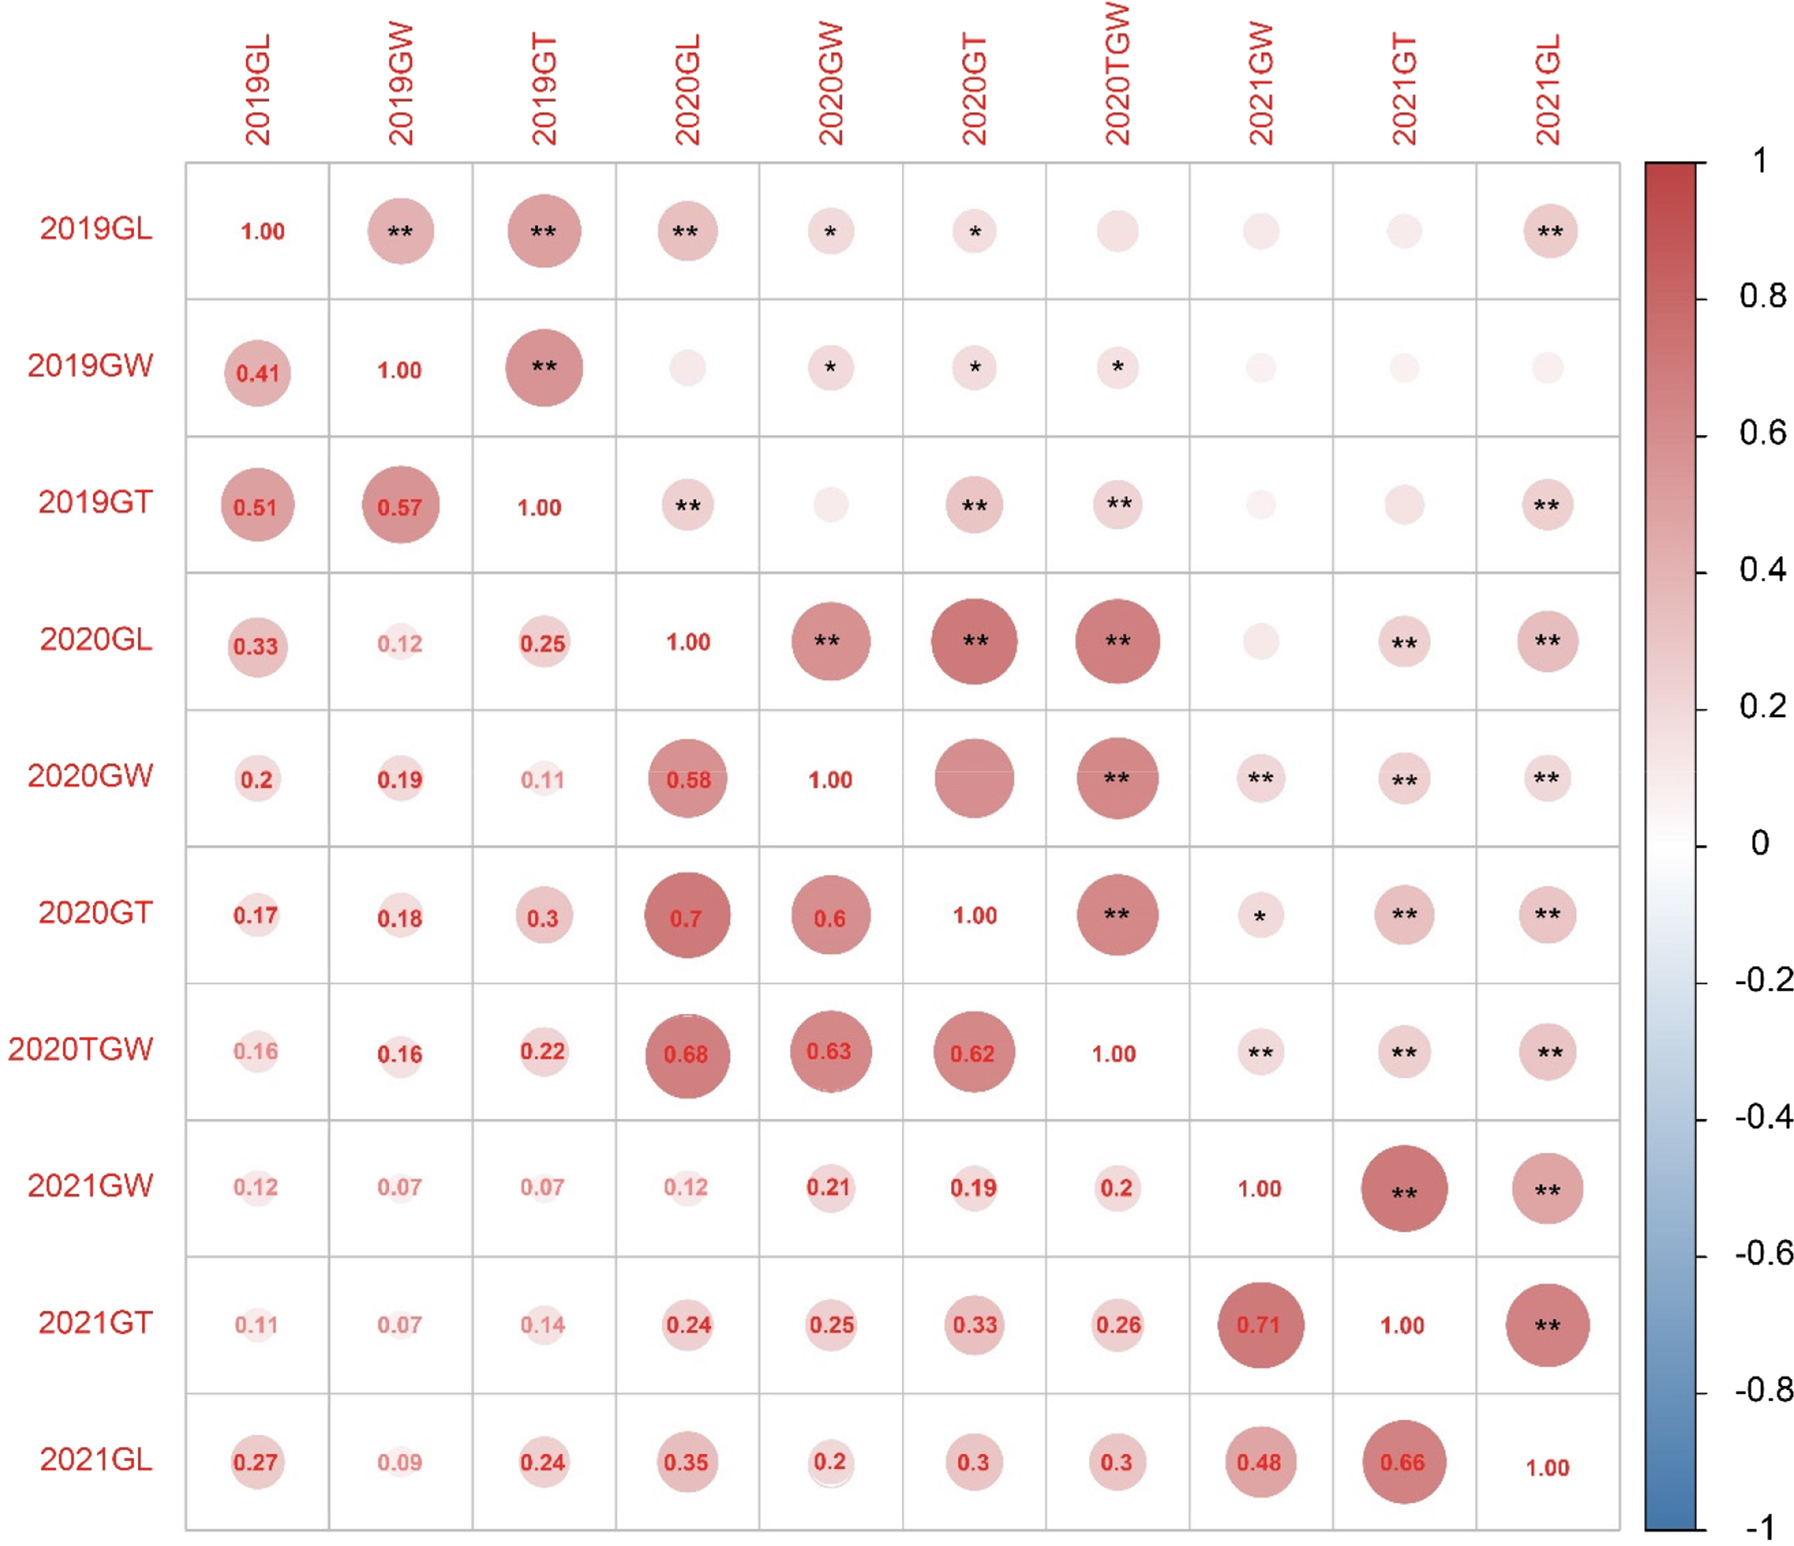
Correlation analysis of grain traits in wheat for 2019, 2020 and 2021.
Note: The grain traits analysed include grain length (GL), grain width (GW), grain thickness (GT) and thousand grain weight (TGW). GL, GW and GT are measured in millimetres (mm), while TGW is measured in grams (g). Significant correlations marked by asterisks (*P < 0.05, **P < 0.01).
These results reveal significant phenotypic variation in grain length, width, thickness and TGW among Pubing3228, Jing4839 and their derived RIL population. These findings provide a rich data set for subsequent genetic analysis and QTL mapping and further confirm that the inheritance of these traits adheres to the fundamental principles of quantitative trait genetics.
Significant correlations among grain traits in the wheat RIL population
Upon conducting a comprehensive genetic analysis of the Pubing3228/Jing4839 RIL population, we further explored the correlations among grain length, width, thickness and TGW under varying planting years within the Pingdingshan environment. As indicated in Table 2, the correlation analysis results reveal that grain length showed significant or highly significant positive correlations with other traits across three planting seasons in most instances. For grain width, the correlations with grain length, width and thickness in 2021 and with grain length in 2019 and 2020 did not reach significance; however, in all other instances, a significant positive correlation was observed.
Correlation analysis for wheat grain traits in Pingdingshan environment for 2019, 2020 and 2021
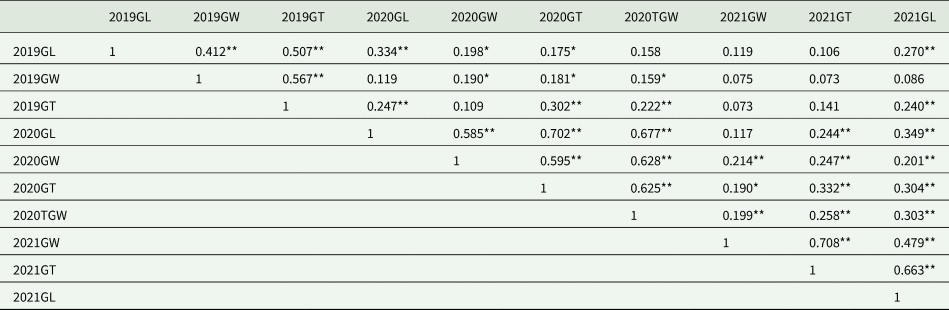
GL, grain length; GW, grain width; GT, grain thickness; TGW, thousand grain weight.
Significant correlations marked by asterisks (*P < 0.05, **P < 0.05).
Similarly, grain thickness did not significantly correlate in specific year comparisons but demonstrated significant correlations with other traits in most cases. Notably, except for the correlation between TGW in 2020 and grain length in 2019, TGW exhibited significant or highly significant positive correlations with all other traits, highlighting the close interrelationships between grain length, width, thickness and TGW (Fig. 2).
In summary, significant positive correlations exist among grain length, width, thickness and TGW within the wheat RIL population. These correlation analysis results reveal the interplay among wheat grain morphological traits and provide crucial insights for further investigation into the genetic mechanisms influencing wheat yield and quality.
QTL mapping analysis identifies 114 QTLs associated with grain traits
To delve into the QTL affecting wheat grain traits, a comprehensive QTL mapping analysis was conducted on the Pubing3228/Jing4839 RIL population, identifying 114 QTLs associated with grain traits. These QTLs are distributed across all wheat chromosomes except for 2B, with LOD scores ranging from 2.51 to 15.33 and phenotypic variance explained (PVE) from 0.20 to 15.99%. Detailed information on these QTLs is provided in Table S1 and illustrated in Fig. S1.
For grain length, 36 QTLs were identified across chromosomes 1A, 1D, 2D, 3A, 3D, 4A, 4D, 5A, 5B, 5D, 7A, 7B and 7D, with PVEs ranging from 3.33 to 14.19%. Eleven of these QTLs, with PVEs exceeding 10%, were considered major QTLs, with QGl.wa-7B.e4, located between AX-108795893 and AX-109871179, having the highest PVE. Notably, chromosomes 7A and 7B each harboured three QTLs, indicating these chromosomes as focal points for grain-length QTL distribution.
Thirteen QTLs were identified for grain width, predominantly on chromosomes 2D, 4A, 4B, 4D, 5D, 6B, 7A and 7B, with chromosome 5D hosting the most grain width QTLs (four). Twenty-four QTLs were found for grain thickness, distributed across chromosomes 1B, 2A, 2D, 3B, 4A, 4B, 4D, 5A, 5D, 6A, 6D, 7A, 7B, 7Da and 7Db, with chromosome 4D identified as a significant locus for grain thickness traits.
Forty-one QTLs related to TGW were distributed across chromosomes 1A, 1D, 2A, 2D, 3A, 3B, 3D, 4A, 4B, 4D, 5A, 5B, 5D, 6B, 6D, 7A, 7B and 7Da, with PVEs ranging from 2.65 to 15.99%. Five major QTLs, explaining over 10% of the variance, underscore their significant role in controlling TGW traits.
These results successfully identify multiple QTLs influencing wheat grain traits, enriching the genetic foundation knowledge of wheat grain characteristics and providing critical molecular markers for future wheat quality improvement and molecular breeding. Notably, the discovery of significant QTLs lays a solid foundation for further genetic mechanism studies of these traits and trait improvement through MAS.
Expression analysis and identification of candidate genes associated with grain traits
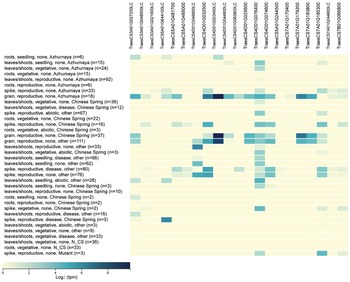
Building on the QTL mapping analysis of grain traits in the Pubing3228/Jing4839 RIL population, a detailed expression analysis was conducted on the initially screened candidate genes. By comparing the expression patterns of these candidate genes in wheat roots, stems, leaves and grains, 22 candidate genes expressed explicitly in grains were identified. These include six associated with TGW, nine with grain width/thickness and seven with grain length (Table 3, Fig. 3).
The candidate genes and their information for the related grain traits identified in this study
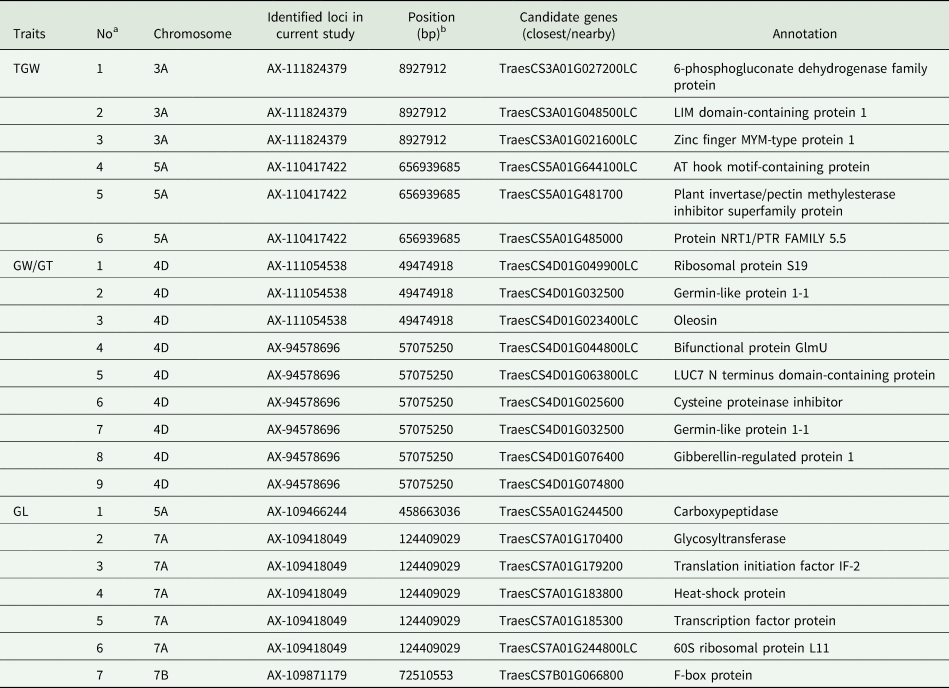
GL, grain length; GW, grain width; GT, grain thickness; TGW, thousand grain weight.
a The number of candidate genes for wheat grain traits.
b Physical position of the SNP as reported in the IWGSC Chinese Spring reference genome RefSeq v2.0.
Expression profile analysis of grain trait-related candidate genes in different tissues.
Note: n indicates the sample size, Azhurnaya and Chinese Spring represent the wheat varieties used in the study.
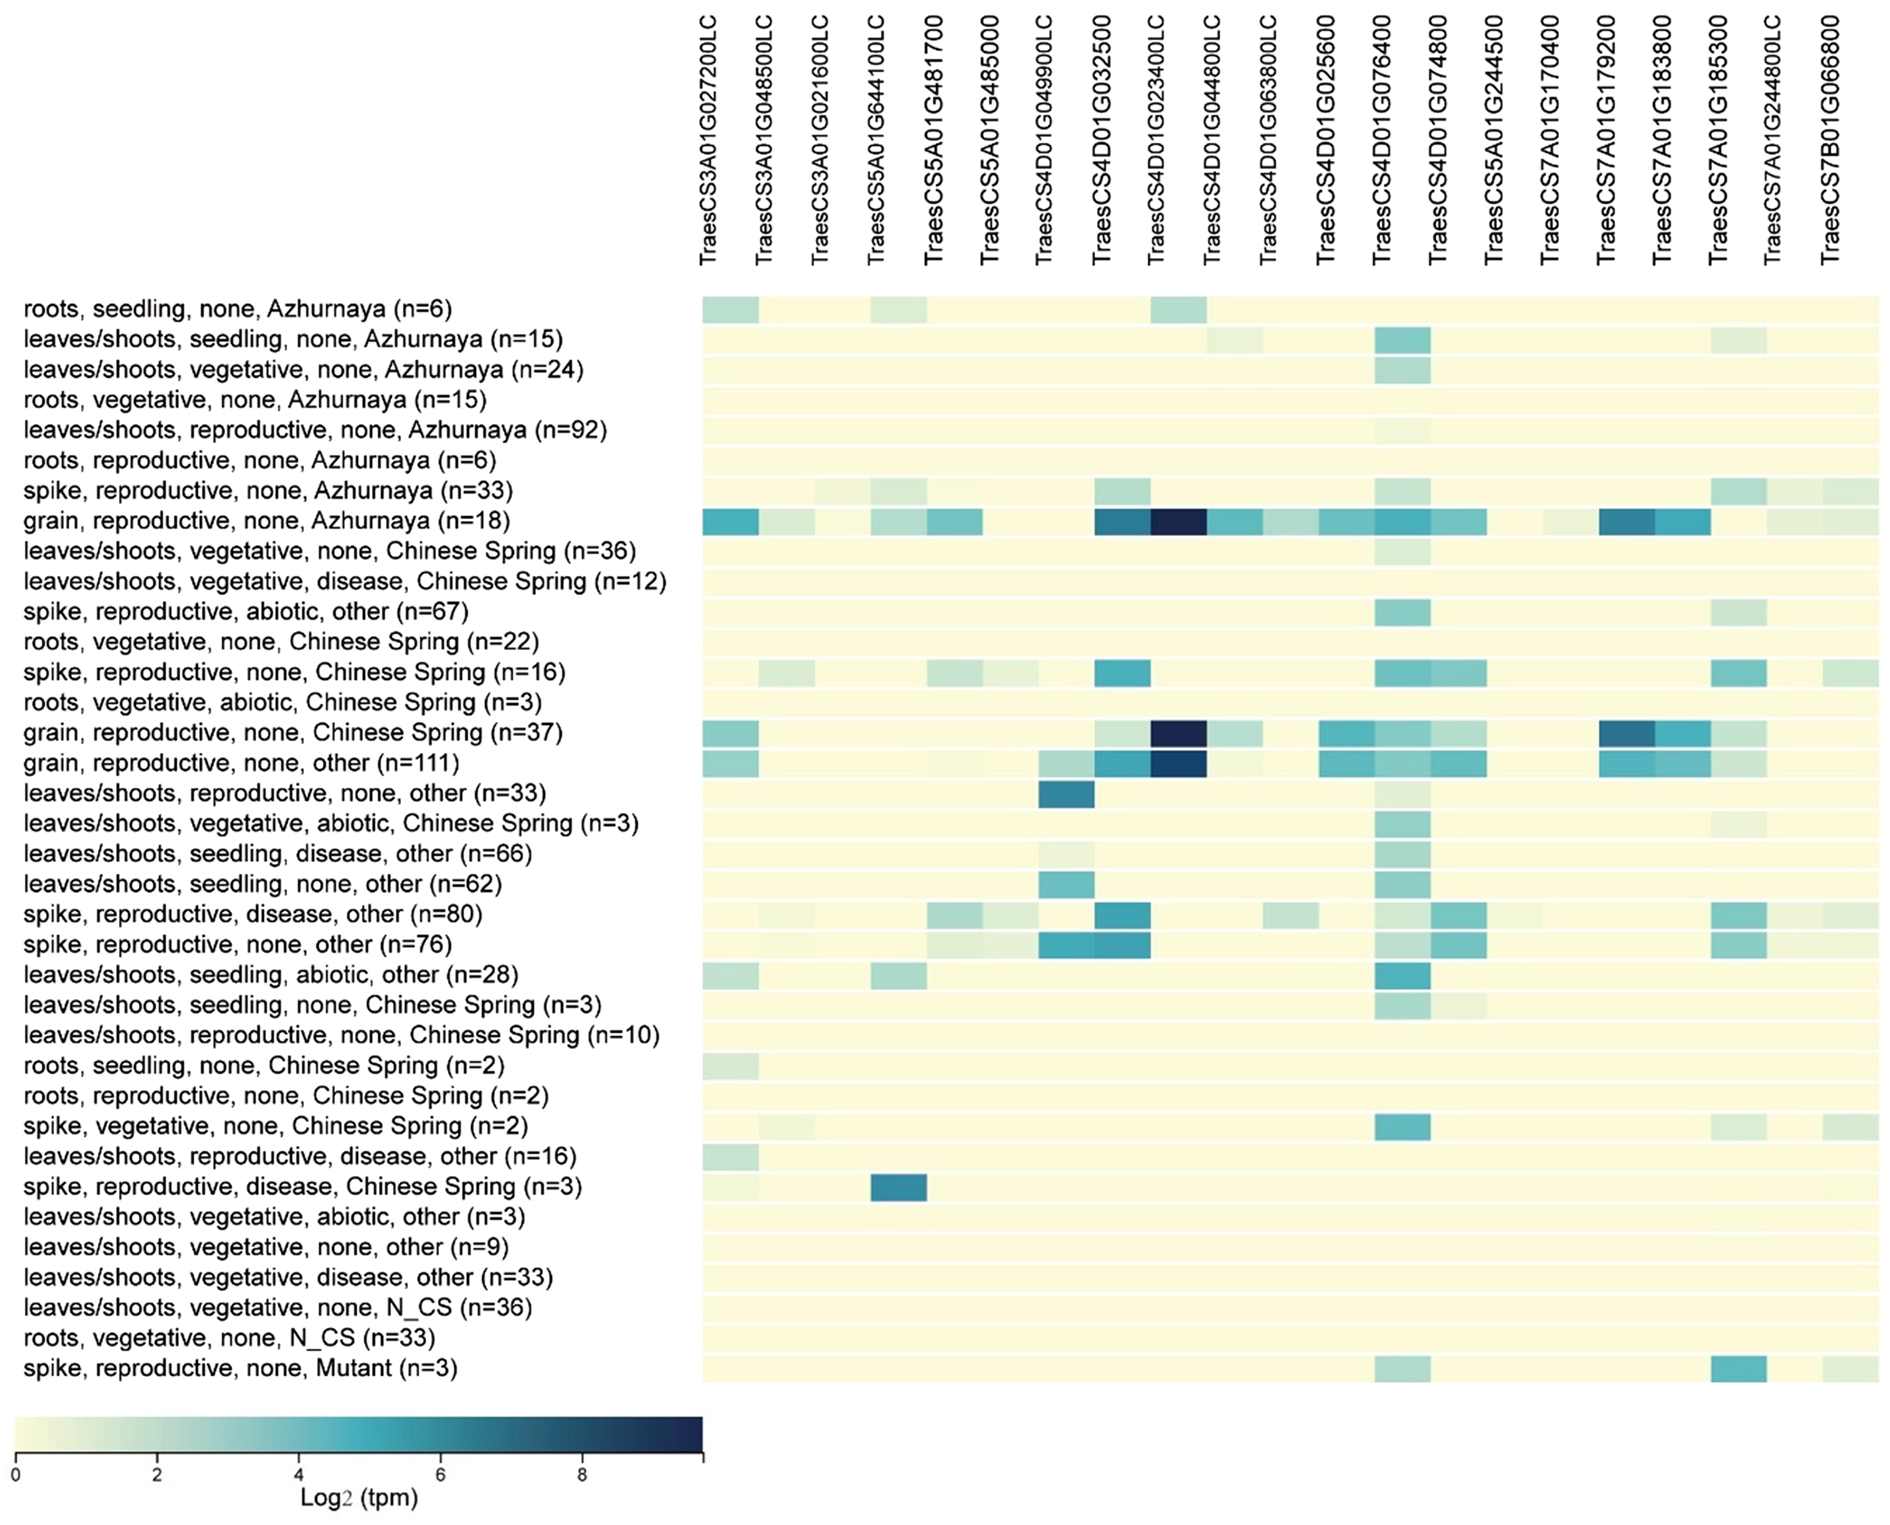
Identifying these specifically expressed candidate genes provides new insights into the genetic regulatory mechanisms underlying wheat grain traits and offers potential targets for future wheat quality improvement through gene editing technologies.
Discussion
As one of the world's principal cereal crops, improving wheat yield and quality has always been a focal point of agricultural research (Senatore et al., Reference Senatore, Ward, Cappelletti, Beccari, McCormick, Busman, Laraba, O'Donnell and Prodi2021; Qiu et al., Reference Qiu, Hu, Chen, Tang, Yang, Zhu, Yan and Jian2022). Grain weight and size are direct determinants of wheat yield and processing quality, making the genetic foundation of these traits a subject of significant theoretical and practical interest (Park et al., Reference Park, Resolus and Kim2021; Liu et al., Reference Liu, Wang, Liu, Wu, Liang, Li, Zhang and Peng2022; Yu et al., Reference Yu, Yu, Guo, Zhang, Li, Zhang, Zhou, Wei, Song, Cheng, Fan, Shi, Feng, Wang, Xiang and Zhang2022b). Previous studies have primarily focused on the genetic analysis of common wheat germplasm. However, this study introduces the novel wheat-Agropyron germplasm Pubing3228, expanding the scope of genetic diversity research and offering a fresh perspective on the complex genetic mechanisms of wheat grain traits.
Creating an F8 generation RIL population through Pubing 3228 crossing with Jing4839 exceeds the scale of most similar studies in quantity, providing ample genetic variation for research. The design of field trials across three different environments accounts for the impact of environmental factors on trait expression, enriching the study's depth and breadth. Moreover, using the Illumina Infinium iSelect 55 K SNP chip and QTL IciMapping software demonstrates the study's advancement and efficiency in genetic analysis methods.
Detecting 114 QTLs associated with grain traits, both in quantity and distribution, marks a significant departure from previous studies. Identifying these QTLs, particularly the major-effect QTLs, presents new targets for the genetic improvement of wheat grain traits. Compared to existing research, these results underscore the significant increase in genetic diversity and improvement potential facilitated using the Pubing3228 germplasm (Dong et al., Reference Dong, Xu, Xu, Ren, Gao, Song, Jia, Hao, He and Xia2022; Qu et al., Reference Qu, Li, Liu, Liu, Luo, Xu, Tang, Mu, Deng, Pu, Ma, Jiang, Chen, Qi, Jiang, Wei, Zheng, Lan and Ma2022; Sharma et al., Reference Sharma, Kumari, Sharma, Singh, Sharma, Mir, Kumar, Jan, Parthiban, Mir, Bhati, Pradhan, Yadav, Mishra, Budhlakoti, Yadav, Gaikwad, Singh, Singh and Kumar2023).
The discovery of 22 candidate genes, especially those associated with grain length, width/thickness and TGW, lays a foundation for further functional validation and molecular breeding. Compared to prior studies, the specific expression patterns of these genes and their association with traits enrich the theoretical basis for the genetic control of wheat grain traits and provide new tools for marker-assisted breeding.
Among the TGW-associated candidate genes, for instance, TraesCS3A01G027200LC is believed to encode a 6-phosphogluconate dehydrogenase family protein involved in various abiotic stress responses, potentially affecting plant growth (Corpas et al., Reference Corpas, Aguayo-Trinidad, Ogawa, Yoshimura and Shigeoka2016; Li et al., Reference Li, Li, Zheng, Liu, Ding, Gai and Yang2021). TraesCS3A01G048500LC likely encodes a protein with an LIM domain, which is involved in regulating the actin cytoskeleton necessary for pollen development and acts as an actin-binding protein to modulate the cytoskeletal structure and actin network, significantly impacting seed yield (Lopez et al., Reference Lopez, Anthony, Maciver, Jiang, Khan, Weeds and Hussey1996; Papuga et al., Reference Papuga, Hoffmann, Dieterle, Moes, Moreau, Tholl, Steinmetz and Thomas2010; Li et al., Reference Li, Li, Wang, Li, Lu and Li2015).
For genes associated with grain width/thickness, TraesCS4D01G049900LC may encode ribosomal protein S19, an essential component of the protein synthesis machinery that affects plant growth and development (Fallahi et al., Reference Fallahi, Crosthwait, Calixte and Bonen2005). TraesCS4D01G032500 could encode a Germin-like protein that plays multiple roles in plant development (He et al., Reference He, Tao, Leung, Yan, Chen, Peng and Liu2021; Anum et al., Reference Anum, O'Shea, Zeeshan Hyder, Farrukh, Skriver, Malik and Yasmin2022; To et al., Reference To, Pham, Le Thi, Nguyen, Tran, Ta, Chu and Do2022).
Regarding grain length, TraesCS5A01G244500 might encode a carboxypeptidase, potentially influencing cell elongation (Fu et al., Reference Fu, Chen, Pei, Wang, Wang, Nazir, Wang, Zhang, Xing, Pan, Lin, Peng, He and Du2023). TraesCS7A01G170400 is thought to encode a glycosyltransferase, an enzyme essential for average plant growth and development (Lao et al., Reference Lao, Oikawa, Bromley, McInerney, Suttangkakul, Smith-Moritz, Plahar, Chiu, González Fernández-Niño, Ebert, Yang, Christiansen, Hansen, Stonebloom, Adams, Ronald, Hillson, Hadi, Vega-Sánchez, Loqué, Scheller and Heazlewood2014; Li et al., Reference Li, Li, Wang, Yu, Li and Hou2017, Reference Li, Yu, Meng, Lin, Li and Hou2018).
Overall, this study's findings stand out in identifying QTLs and candidate genes, illustrating the uniqueness brought about by the genetic materials used, experimental design and molecular marker technologies. These discoveries emphasize the importance of exploring genetic diversity and employing high-throughput genetic analysis techniques in unveiling the genetic foundation of crop traits.
This study delves into the novel wheat-Agropyron germplasm Pubing3228, uncovering QTL and candidate genes associated with hexaploid wheat (Triticum aestivum L.) grain weight and size. It provides a vital theoretical foundation and technological pathways for genetic improvement and quality enhancement in wheat (Fig. 4). Utilizing high-density SNP chip analysis and advanced genetic analysis methods identified 114 QTLs related to grain traits. Further analysis led to the identification of 22 genes with specific expression patterns, expanding our understanding of wheat genome functions and laying the groundwork for investigating the molecular regulatory mechanisms of these traits. The scientific value of these achievements lies in furnishing crucial resources for basic genetic research, while their practical value emerges in accelerating wheat variety improvement through MAS, promoting precision agriculture, and ultimately enhancing wheat yield and quality to meet the growing global demand for food security and nutrition. This research advances wheat scientific studies and contributes to global food security and sustainable agricultural development, with long-term impacts on wheat breeding and production practices.
Genetic analysis of quantitative trait loci (QTL) for grain weight and size in the Pubing3228/Jing4839 recombinant inbred lines (RIL) population.

Despite significant progress, the study's limitations must be acknowledged. The identified QTLs and candidate genes require further validation and functional studies to confirm their roles in wheat grain trait development. Additionally, the research, conducted under specific environmental conditions and genetic backgrounds, lacks comprehensive testing across diverse environments and genetic backgrounds for universality and stability. Moreover, grain trait formation is complex and influenced by multiple genes and environmental factors, and the study's analysis of these intricate interactions still needs to be completed. Thus, while the findings offer guidance, they necessitate cautious evaluation and interpretation in practical applications.
Future research directions should include validating the identified QTLs' stability and universality under broader environmental conditions and diverse genetic backgrounds to ensure their practical value in wheat breeding. Advanced molecular biology techniques and bioinformatics methods should be employed to explore the functions and mechanisms of these candidate genes, understanding their specific roles in grain morphology and quality formation. Additionally, leveraging the latest gene-editing technologies, such as the CRISPR/Cas9 system, for precise modifications of critical genes can provide a more efficient means for developing new wheat varieties. Finally, through interdisciplinary collaboration, integrating computational biology, genetics, breeding, and molecular biology, a more comprehensive and in-depth genetic regulatory network model for wheat grain traits can be constructed, contributing to global food security and sustainable agricultural development.
Conclusion
This study provides a comprehensive genetic analysis of wheat grain traits, identifying 114 QTLs and 22 candidate genes associated with grain weight and size. The findings contribute valuable insights into the genetic mechanisms underlying these traits, offering new avenues for MAS in wheat breeding. However, further research is needed to validate these QTLs and candidate genes across diverse environments and genetic backgrounds to ensure their practical application in improving wheat yield and quality.
Supplementary material
The supplementary material for this article can be found at https://doi.org/10.1017/S0021859624000534.
Acknowledgements
We sincerely thank Professor Li Lihui from the Institute of Crop Sciences, Chinese Academy of Agricultural Sciences, for generously providing the materials needed for this study. We also thank Professor Li and Professor Zhang Jinpeng for their valuable guidance and support throughout the research process.
Author contributions
Jiansheng Wang conceived and designed the experiments, performed the experiments, analysed the data, prepared figures and/or tables and wrote the manuscript. Shiping Cheng performed the experiments. Erwei Wang, Aichu Ma and Guiling Hou significantly contributed to conducting the experiments. All authors authored or reviewed drafts of the article and approved the final draft, which is the final version to be published.
Funding statement
This research was funded by the Joint Fund of the National Natural Science Foundation of China (U1804102).
Competing interests
None.
Ethical standards
Not applicable.
Data availability
All data can be provided as needed.