


Introduction
On March 11, 2020, the World Health Organization (WHO) declared SARS-CoV-2 virus pandemic a global pandemic [1], disrupting people’s daily life by altering eating patterns, physical activity levels, social interactions, and access to obesity management services, especially during lockdowns. Numerous obesity risk factors were exacerbated or newly identified, including poor mental health (e.g., stress, anxiety, depression, and resulting insomnia) [Reference Khubchandani, Price, Sharma, Wiblishauser and Webb2–Reference Nour and Altintaş4]; decline in diet quality and food insecurity (e.g., increased consumption of ultra-processed, high-sugar, and high-calorie foods and decreased intake of fresh produce) [Reference Bhutani, Vandellen and Cooper3–Reference Bennett, Young, Butler and Coe5]; unhealthy dietary behaviors (e.g., frequent snacking and over-eating) [Reference Bennett, Young, Butler and Coe5,Reference Madan, Blonquist and Rao6]; smoking and alcohol abuse [Reference Mulugeta, Desalegn and Solomon7–Reference Zeigler9]; physical inactivity and sedentary lifestyles [Reference Nour and Altintaş4,Reference Madan, Blonquist and Rao6,Reference Galali10,Reference Almousa and Alagal11]; and low socioeconomic status (i.e., unemployed and low income) [Reference Knapp, Dong and Dunlop12–Reference Picchioni, Goulao and Roberfroid15].
Some groups were already facing existing health differences when the pandemic began. According to 2018 data from the U.S. Department of Health and Human Services Office of Minority Health (OMH) [16], 36.2% of Hispanic adults were overweight and 34% obese, higher than non-Hispanic White adults (33.9% and 30.0%, respectively). Hispanic adults were 1.2 times more likely to be obese than non-Hispanic White adults, and this gap rose to 1.8 times in children. The complex interplay of biological, behavioral and social factors made this group particularly vulnerable to pandemic-related weight changes.
Studies examining the pandemic’s impact on obesity and weight change most reported significant weight gain [Reference Khubchandani, Price, Sharma, Wiblishauser and Webb2,Reference Bhutani, Vandellen and Cooper3,Reference Madan, Blonquist and Rao6–Reference Zeigler9,Reference Almousa and Alagal11–Reference Goitia, Chen, Patel, Herald and Lee13,Reference Alshahrani, Alghannam and Taha17]. Nearly half (48%) of U.S. adults gained weight during the pandemic, averaging 0.62 kg after lockdowns (September–October 2020) compared to peak-lockdown (April–May 2020) [Reference Khubchandani, Price, Sharma, Wiblishauser and Webb2,Reference Bhutani, Vandellen and Cooper3]. Weight changes varied by race/ethnicity, sex, age, diabetes status, and pre-pandemic obesity. For instance, younger people and women were more likely to gain weight than older people and men [Reference Mulugeta, Desalegn and Solomon7,Reference Wiener, Waters and Morgan8,Reference Huang, Chan and Ko18,Reference Freedman, Kompaniyets, Daymont, Zhao and Blanck19]; Black and Hispanic populations had higher obesity rates than White and Asian groups [Reference Mulugeta, Desalegn and Solomon7,Reference Goitia, Chen, Patel, Herald and Lee13,Reference Koebnick, Sidell and Li20]; people with lower levels of education, pre-pandemic overweight, or those living with family in low-income neighborhoods were more likely to gain weight [Reference Khubchandani, Price, Sharma, Wiblishauser and Webb2,Reference Zeigler9,Reference Goitia, Chen, Patel, Herald and Lee13,Reference Huang, Chan and Ko18]. Individuals with diabetes lost weight [Reference Alshahrani, Alghannam and Taha17]. However, the findings were inconsistent. For example, some studies reported higher obesity rates among men [Reference Maltoni, Zioutas, Deiana, Biserni, Pession and Zucchini21], or weight gain among individuals with diabetes [Reference Wiener, Waters and Morgan8].
Existing studies also have some limitations. Some studies were conducted outside the U.S. (e.g., China, India, Iraq, and Saudi Arabia) [Reference Madan, Blonquist and Rao6,Reference Galali10,Reference Almousa and Alagal11,Reference Alshahrani, Alghannam and Taha17,Reference Wen, Zhu and Ji22] or in specific U.S. regions [Reference Mulugeta, Desalegn and Solomon7,Reference Goitia, Chen, Patel, Herald and Lee13], where pandemic timelines and policies differed. Some were cross-sectional or short-term longitudinal designs (e.g., pre- and post-lockdown with pre-lockdown information collected via surveys), where other studies focused narrowly on adolescents and children [Reference Knapp, Dong and Dunlop12,Reference Wen, Zhu and Ji22] or omitted subgroup analyses by demographics or comorbidities. However, no study specifically investigated Hispanics nationwide in the U.S. throughout the pandemic.
To address these gaps, our study provided a comprehensive nationwide assessment of weight changes among Hispanic adults in the U.S. during the SARS-CoV-2 virus pandemic using longitudinal data spanning the entire pandemic (2019–2023). Beyond evaluating the overall trend, we examined subgroup variations by age, race, sex, smoking status, pre-pandemic obesity, food environment, SARS-CoV-2 virus infection, and chronic conditions (e.g., diabetes, hypertension, cancer).
Methods
We utilized electronic health records (EHRs) from January 1, 2019 to December 31, 2023, within the longitudinal database of the National Clinical Cohort Collaborative (N3C). The analysis presented in this paper utilized data available in the N3C enclave as of April 2025.
National Clinical Cohort Collaborative (N3C) overview
The N3C (https://n3c.ncats.nih.gov/clinical-cohort) was established in 2020 to meet the urgent need for a national clinical patient registry for SARS-CoV-2 virus pandemic research [Reference Haendel, Chute and Bennett23]. It is an extension of the National Center for Data to Health (CD2H) project and serves as a comprehensive database of patients who have been tested for the SARS-CoV-2 virus. Funded by the National Institutes of Health (NIH) with support from the National Center for Advancing Translational Sciences (NCATS), the N3C Data Enclave has become the largest multicenter SARS-CoV-2 virus pandemic cohort in the United States. As of May 9, 2025, the database included pre-pandemic EHR data dating back to January 2018, from 98 healthcare providers in all 50 states and Washington D. C., covering 22.8 million people and over 8,914,402 SARS-CoV-2 virus cases [24]. Data are housed in a secure platform, with analytic provenance. Access to the enclave requires a Data Use Request (DUR) reviewed by the N3C committee, and an institutional Data User Agreement (DUA). All N3C activities were approved by the Johns Hopkins University Central Institutional Review Board (Reliance Protocol IRB 00249128). In this study, we used Level-2 de-identified data to ensure participant privacy and limited our analysis to Hispanic adults (aged ≥ 21 years in 2019) residing in the U.S. during 2019–2023 who had complete N3C data records for all five study years.
Study variables
Our primary outcome was body weight in kilograms (kg). Using height measurements (in meters), we calculated body mass index (BMI) (kg/m2). Based on CDC criteria [25], we categorized BMI into Underweight (BMI <18.5), Healthy weight (18.5 ≤ BMI <25), Overweight (25 ≤ BMI <30), Obese I (30 ≤ BMI <35), Obese II (35 ≤ BMI <40) and Obese III (BMI ≥ 40). We also used demographic data on age (categorized as 20–29, 30–39, 40–49, 50–59, 60–69, ≥ 70 years), sex, and race (White, Black, Asian, Indian/Alaska Native, and Other/Unspecified); behavioral data on tobacco smoking status; environmental data on Social Determinant Index (SDoH 1.0) and modified Retail Food Environment Index (mRFEI); clinical data on Charlson Comorbidity Index (CCI), SARS-CoV-2 virus infection status, and weight-related comorbidities (diabetes, hypertension, depression, heart disease, cerebrovascular accidents (CVAs), transient ischemic attacks (TIAs), cancer, AIDS, kidney disease and dementia).
Social determinant index and social drivers of health (SDoH)
The CDC recognized that the social determinants of health, the conditions in which people live, learn, work and grow, significantly influence health risks and outcomes [26]. We incorporated the First-Generation Social Determinant Index (SDoH 1.0), developed by Boston University School of Public Health in collaboration with Sharecare [27]. This index aligns with the federal government’s Healthy People 2020 framework and covers “Neighborhood & Built Environment,” “Health & Healthcare,” “Social & Community Context,” “Education,” and “Economic Stability” five key domains [26]. The index positively correlates with the Sharecare well-being Index (WBI) [27] and expands CDC concepts of community health assessment. The SDoH 1.0 index values were calculated according to the definition [27], then grouped and averaged by the first three digits of zip codes. Finally, they were linked to participants via truncated zip codes in the N3C Level-2 dataset. The index ranged from 0 to 100, with higher scores indicating more favorable social determinants of health.
Modified Retail Food Environment Index (mRFEI)
Food insecurity, defined as limited or uncertain access to adequate nutritious food, is a recognized risk factor for obesity[Reference Testa and Jackson28]. We assessed retail food environments using the modified Retail Food Environment Index (mRFEI), a CDC-developed metric to quantify the proportion of healthy food retailers relative to all food retailers within U.S. census tracts [29]. Census tracts are geographic subdivisions of counties that typically contain 2500–8000 residents and are homogeneous in terms of demographic characteristics, economic status, and living conditions. Healthy food retailers include supermarkets, large grocery stores, supercenters, and produce stores, while less healthy food retailers include fast food restaurants, small grocery stores, and convenience stores. Lower mRFEI scores indicate poorer food environments (more convenience/fast food stores relative to healthy options). According to CDC criteria, the mRFEI was classified into three categories: food desert (mRFEI = 0.00), food swamp (0.00 < mRFEI ≤ 9.09), and healthful food environment (mRFEI > 9.09) [29]. The “food deserts” refer to areas lacking access to affordable healthy foods (including fruits, vegetables, whole grains, low-fat/nonfat milk or dairy alternatives, and other components of a healthy diet), while “food swamps” are areas where energy-dense snacks overwhelm healthy choices, and “healthful food environment” are areas with better access to healthy food retailers.
Weight-related comorbidities
We also examined several diseases with established or potential associations with body weight, including SARS-CoV-2 virus infection, diabetes, hypertension, heart disease (myocardial infarction [MI] and congestive heart failure [CHF]), kidney disease, AIDS, cancer, cerebrovascular disease (cerebrovascular accidents [CVAs] and transient Ischemic attacks [TIAs]), depression, and dementia. Each disease was coded as a binary variable (present/absent). Diagnoses remained fixed over the 5-year study period, except for SARS-CoV-2 virus infection and diabetes, which were updated annually.
Charlson comorbidity index (CCI)
To quantify overall disease burden, we calculated the CCI, a validated weighted scoring system that predicts 1-year mortality risk based on age and 17 predefined comorbidities (number and seriousness) [30,Reference Degroot, Beckerman, Lankhorst and Bouter31]. Conditions were assigned scores (1–6) proportional to their associated mortality hazard using a Cox proportional hazards model. Summing weights yielded a total score with zero representing no comorbidities, and higher scores being associated with higher disease severity and poorer prognosis. In this study, CCI scores were derived from pre-pandemic (2019) data only, as most diagnoses were static throughout follow-up.
Statistical analysis
Descriptive statistics included means and standard deviations (SD) for continuous variables and percentages for categorical variables.
The initial dataset included Hispanic adults (aged ≥ 21 years) with complete weight and height records during 2019–2023. To ensure data quality, we implemented multiple validation steps: excluding weight measurements exceeding 500 kg (as biologically implausible), removing pregnant individuals to account for pregnancy-related weight changes, and requiring a minimum height of 0.5 meters. When calculating BMI, we only used valid weight (>10 kg) and height (>1.0 m) measurements that fell within biologically plausible ranges. We also employed Z-score analysis to systematically detect outliers in weight, height and BMI using a threshold of ±2 SD [Reference Miller and Miller32]. Any measurement exceeding this threshold underwent comprehensive evaluation to identify potential unit conversion errors or data entry mistakes. After correction, these measurements were included in the analysis; otherwise, they were excluded. Additionally, to create a complete-case data, we excluded any remaining participants with missing values for any covariate in the model. After applying rigorous data quality controls and exclusion criteria, our final data included 11,452 participants.
Annual weight change (kg) was our primary outcome. Since adult height is relatively stable, observed changes in BMI primarily reflected weight variation rather than height variation. For participants with multiple measurements within a single year, we used the average value as the representative annual data point. Secondary analyses examined changes in BMI (kg/m2) and shifts in obesity prevalence.
All data processing followed a predefined, standardized protocol. This rigorous analytical approach ensured the reliability of our findings while accounting for the complexities inherent in large-scale EHR data.
Longitudinal weight changes (2019–2023)
We performed a repeated-measures ANOVA to assess overall weight changes over the 5-year study period (2019–2023). Mauchly’s test first evaluated the sphericity assumption (i.e., equal variances of differences between measurement years). When violated, we adjusted ANOVA results using appropriate corrections (Greenhouse-Geisser or Huynh-Feldt). For significant ANOVA results, we controlled for multiple comparisons using Holm-Bonferroni corrected paired t tests for pairwise comparisons across years.
To account for within-subject correlation in repeated weight measurements and adjust for covariates, we established four linear mixed models: Crude model (year only with 2019 as reference); Base model (adjusted for demographics [age, sex, race], smoking status, SARS-CoV-2 virus infection status, food environment [mRFEI], social determinants [SDoH index] and baseline obesity); CCI-adjusted model (Base model + CCI); Disease-specific model (Base model + individual weight-related diseases). Each model produced coefficient estimates with 95% confidence intervals (CIs), standard error (SE), and p values.
Pandemic peak analysis (2019 vs. 2021)
We focused on 2019–2021 as the pandemic’s most impactful period for weight changes. The timeframe captures both the acute effects of lockdowns and their prolonged consequences. While strict lockdowns occurred primarily in 2020, their behavioral impacts (e.g., reduced physical activity levels and dietary changes) persisted throughout 2021. The U.S. vaccination program began in December 2020 [33] and expanded rapidly, reaching 203.9 million fully vaccinated individuals (61.4% of the total U.S. population) by December 20, 2021 [Reference Pariseault34], coincided with continued societal disruptions. Teleworking and schooling remained common, fitness facilities were less utilized, and many delayed routine healthcare. Importantly, weight change typically lags behavioral shifts [Reference Feig and Lowe35], and rising rates of depression even after restrictions eased [Reference McKoy36,Reference Jiang, Deng and Zhao37]. Thus, our 2019–2021 analysis captured both the immediate and delayed impacts of pandemic disruptions.
For within-subject comparisons of body weight pre/post-pandemic (2019 vs. 2021), paired t-tests were used. Independent t-tests and one-way ANOVA were conducted for between-group differences (age, sex, race, smoking, mRFEI food environment groups, SARS-CoV-2 virus infection cases, baseline obesity status, and the presence of various diseases). Shapiro–Wilk test and Levene’s test verified assumptions of normality and homogeneity. Following significant ANOVA, post hoc Tukey HSD tests were performed for pairwise comparisons. In addition, the McNemar-Bower test was conducted for obesity status changes.
Analyses were performed on secure N3C Enclave and Palantir platform using SQL, Apache Spark and Python. The significant level was 0.05. Graphs were generated using Stata/SE 16.1 (StataCorp LLC, TX, USA). Researchers’ request to access the de-identified N3C dataset had been approved by the N3C DUR Committee.
Results
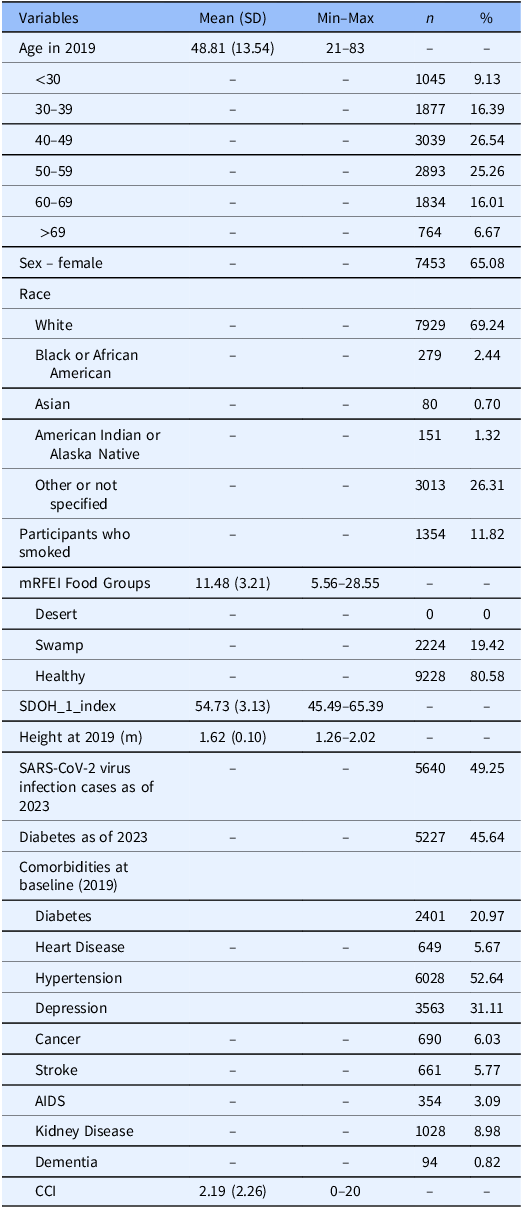
Our longitudinal study included 11,452 Hispanic adults residing in the United States between 2019 and 2023 (Table 1). The average age was 48.81 years with half aged 40–59 years. Females constituted the majority (65.08%); the average height was 1.62 meters; 11.82% reported smoking; Hispanic White participants represented the largest subgroup (69.24%). Nearly 85% of participants were overweight (34.88%) or obese (48.58%) (pre-pandemic data). Most resided in healthy food environments (80.58%), with none living in food deserts. The average SDoH index was 54.73, and the average CCI score was 2.19. By the end of the follow-up period (December 2023), 49.25% had SARS-CoV-2 virus infection at least once, and 45.64% had a diagnosis of diabetes (either pre-existing or newly diagnosed during follow-up). Pre-pandemic, 52.64% had hypertension, and 31.11% had depression.
Descriptive summary of study participants’ demographic and clinical characteristics (N = 11,452)

Table 1 Long description
A table with 21 rows and 6 columns summarizing demographic and clinical characteristics of 11,452 Hispanic adults. Columns include Variables, Mean (SD), Min-Max, n, and %. Row 1: Age in 2019, 48.81 (13.54), 21-83, -, -. Row 2: Age <30, -, -, 1045, 9.13. Row 3: Age 30-39, -, -, 1877, 16.39. Row 4: Age 40-49, -, -, 3039, 26.54. Row 5: Age 50-59, -, -, 2893, 25.26. Row 6: Age 60-69, -, -, 1834, 16.01. Row 7: Age >69, -, -, 764, 6.67. Row 8: Sex - female, -, -, 7453, 65.08. Row 9: Race - White, -, -, 7929, 69.24. Row 10: Race - Black or African American, -, -, 279, 2.44. Row 11: Race - Asian, -, -, 80, 0.70. Row 12: Race - American Indian or Alaska Native, -, -, 151, 1.32. Row 13: Race - Other or not specified, -, -, 3013, 26.31. Row 14: Participants who smoked, -, -, 1354, 11.82. Row 15: mRFEI Food Groups, 11.48 (3.21), 5.56-28.55, -, -. Row 16: mRFEI Food Groups - Desert, -, -, 0, 0. Row 17: mRFEI Food Groups - Swamp, -, -, 2224, 19.42. Row 18: mRFEI Food Groups - Healthy, -, -, 9228, 80.58. Row 19: SDOH_1_index, 54.73 (3.13), 45.49-65.39, -, -. Row 20: Height at 2019 (m), 1.62 (0.10), 1.26-2.02, -, -. Row 21: SARS-CoV-2 virus infection cases as of 2023, -, -, 5640, 49.25.
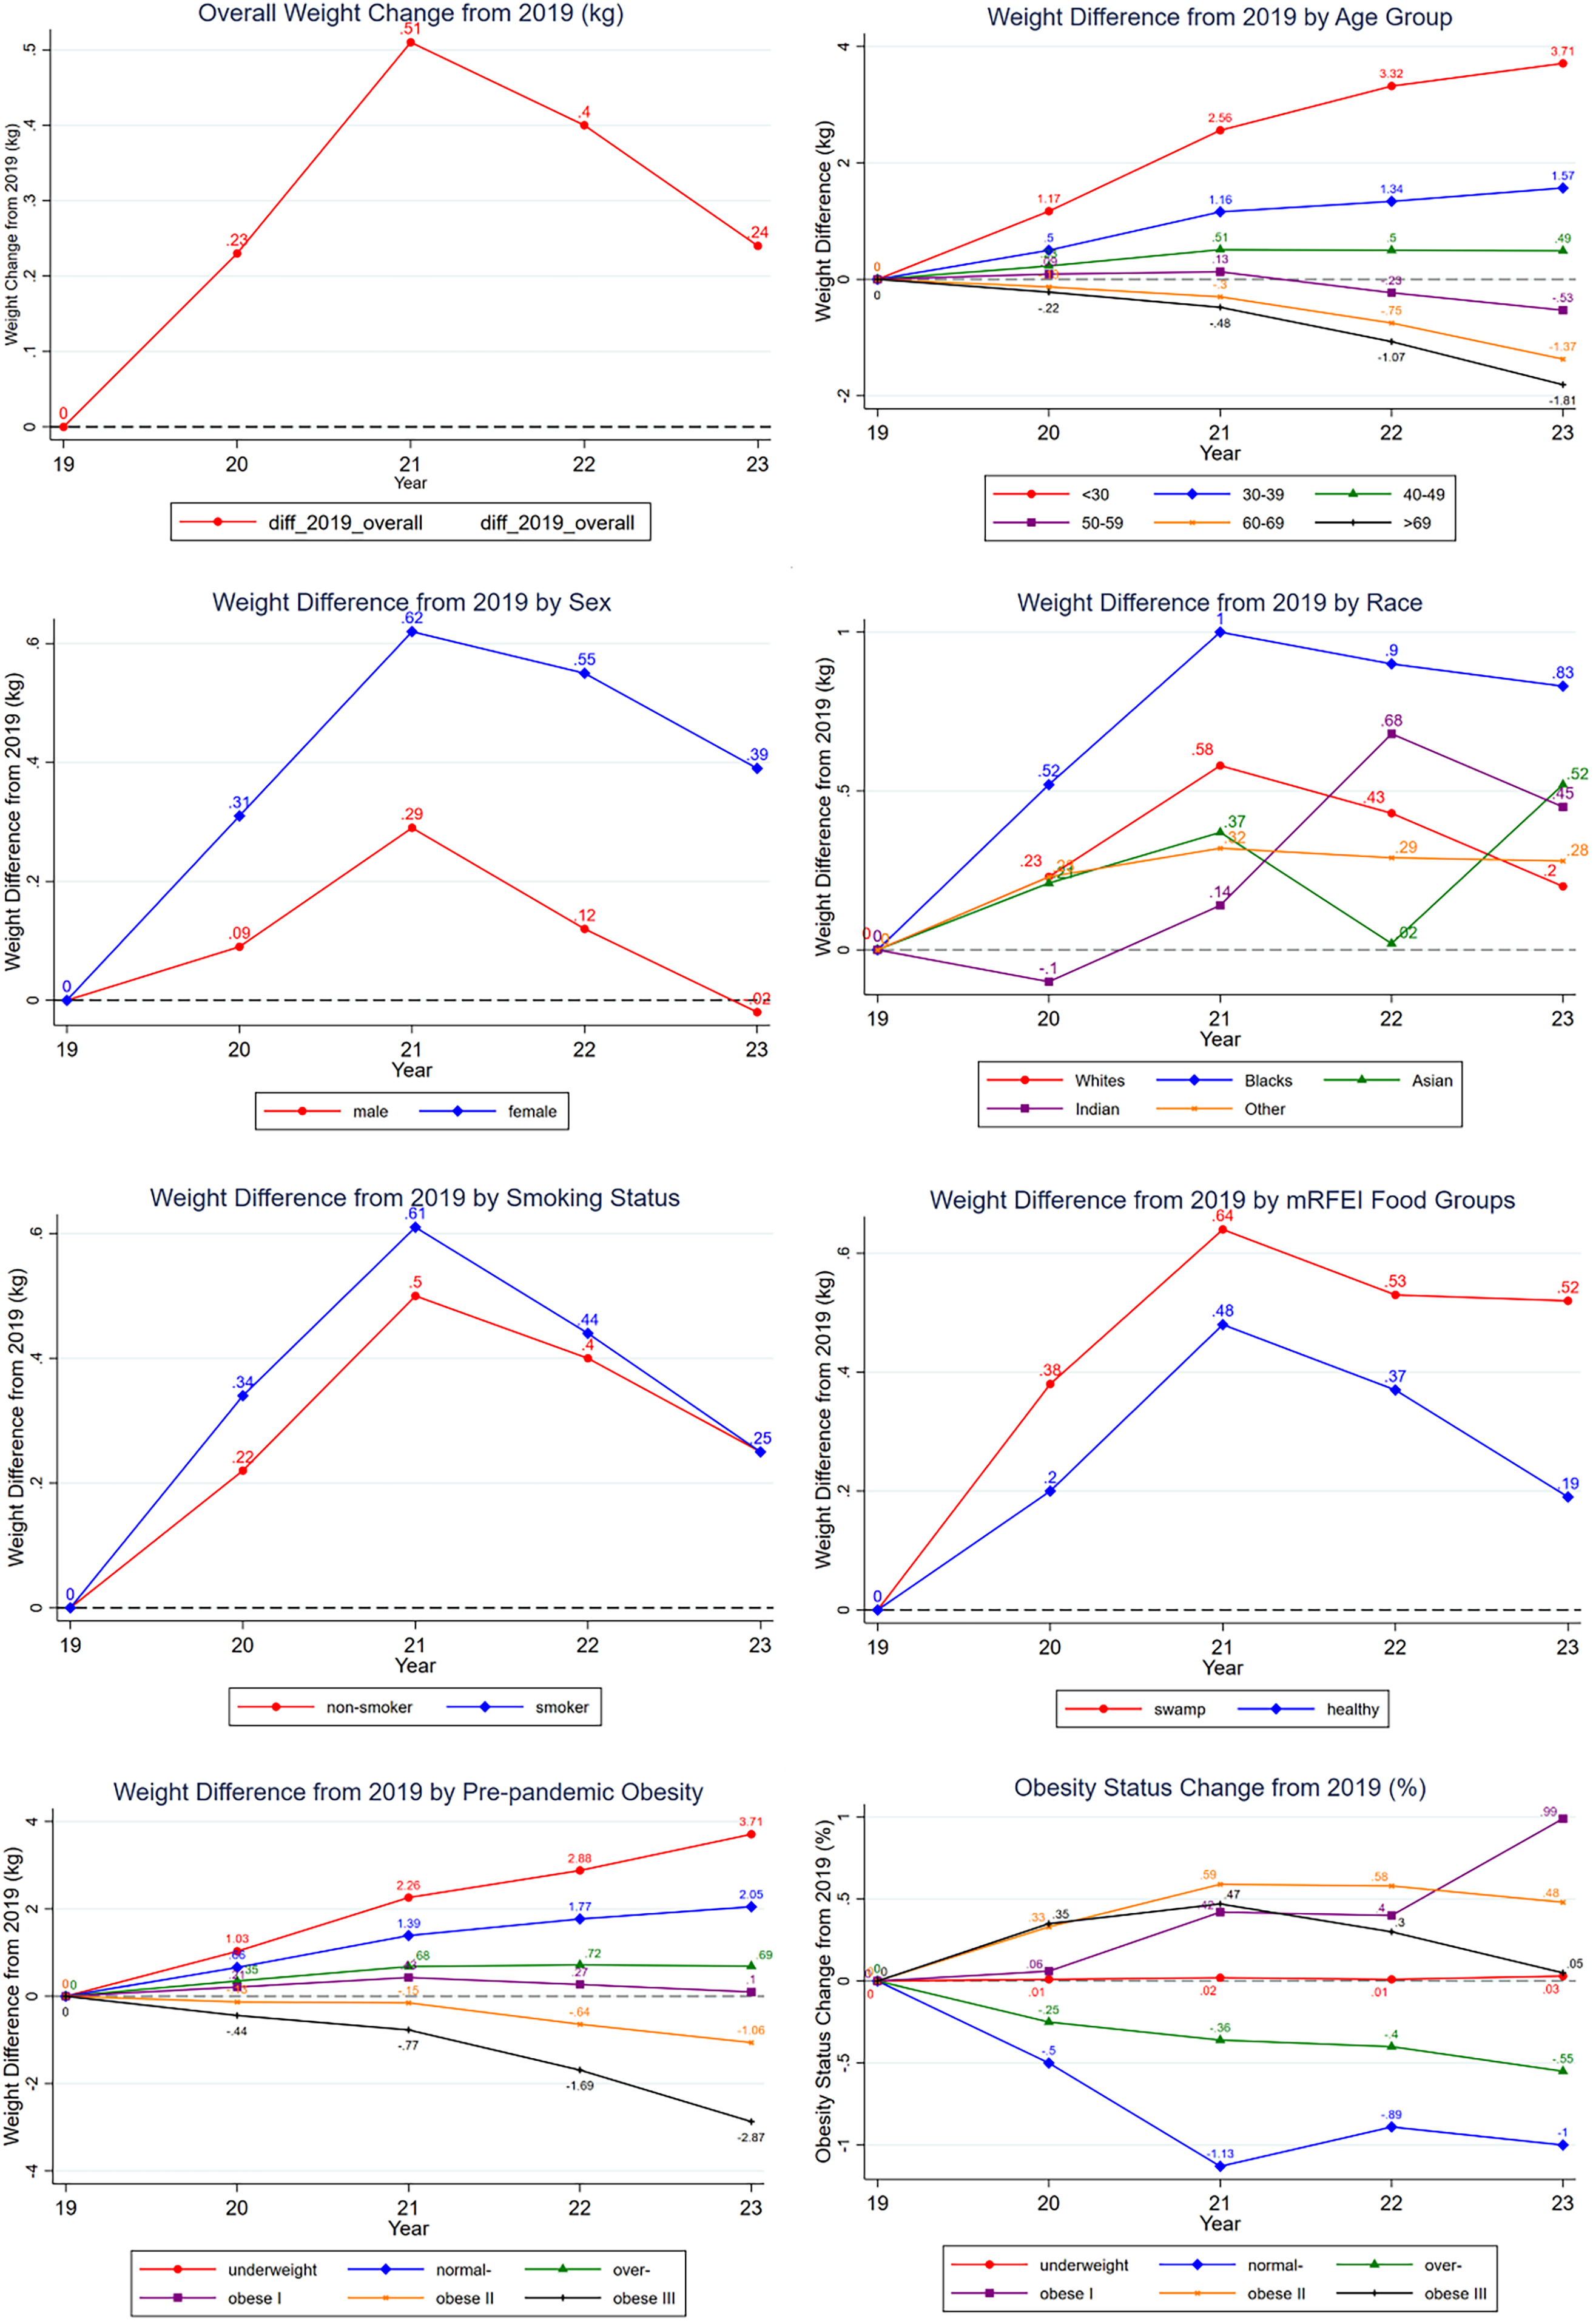
Longitudinal weight changes (2019–2023) (Tables 2, 3 and Figure 1)
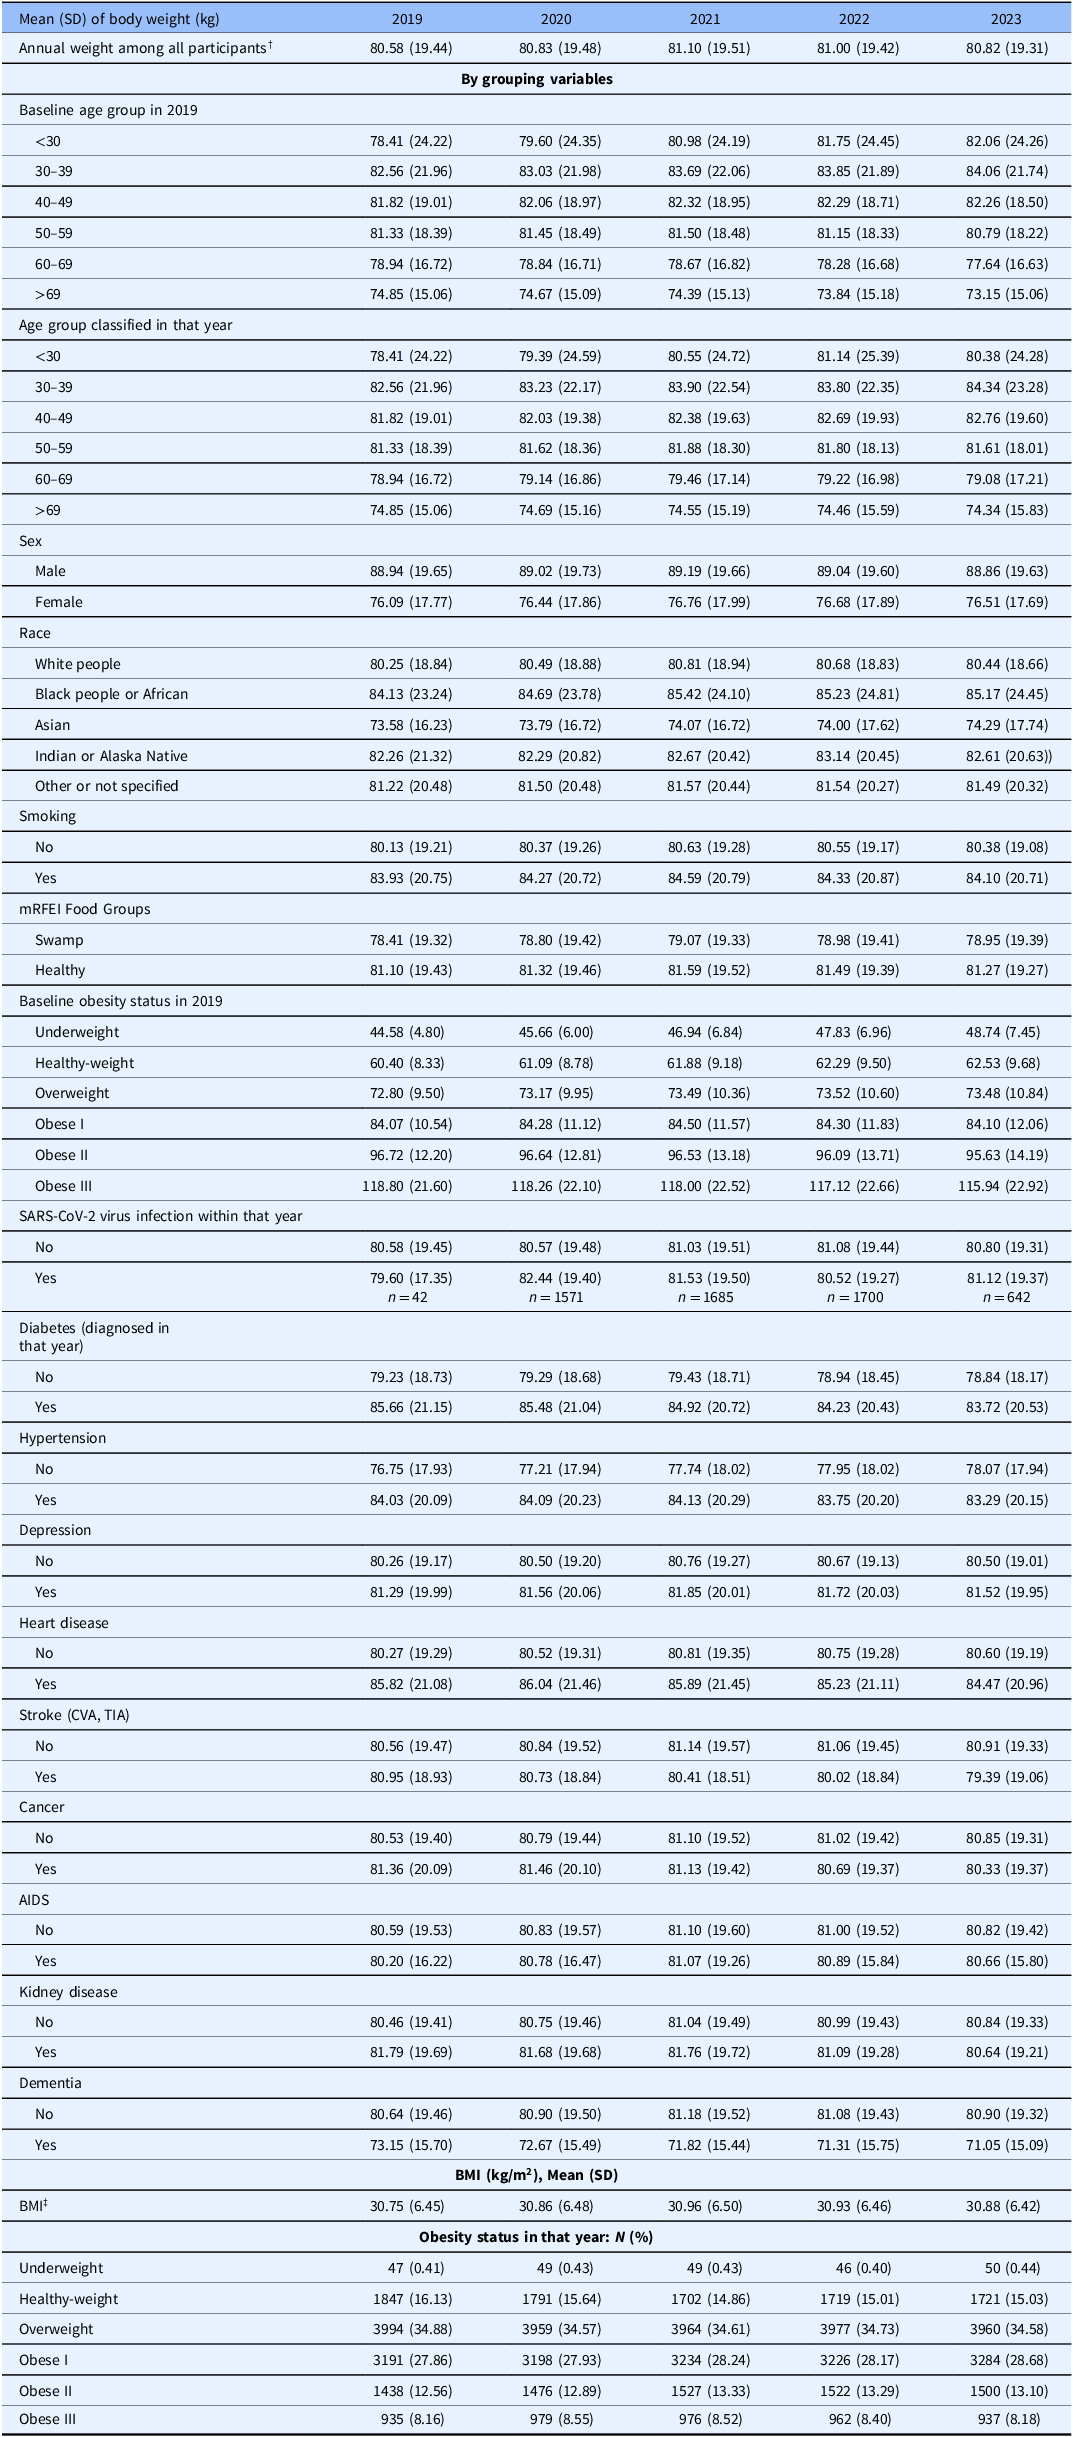
Body weight demonstrated significant increase during the pandemic period, following a peak-then-decline pattern (Table 2). From the pre-pandemic mean of 80.58 kg, weight peaked at 81.1 kg in 2021 before declining to 80.82 kg in 2023 (p < 0.001). This trajectory mirrored BMI changes, as height remained stable. Age-stratified analyses showed divergent trends: participants under 40 showed consistent weight gain (most pronounced in those under 30: +3.65 kg), while those over 60 gradually lost weight with an average decrease of 1.7 kg in those older than 69 years. Middle-aged adults (40–59) followed the peak-then-decline pattern, which was also observed for males and females, with women gaining more weight than men (0.67 vs. 0.25 kg, p < 0.001). Similar trend was observed when we stratified by race, though Black adults experienced the greatest gain (+1.29 kg), and Asian adults rebounded from 74.0 kg (2022) to 74.29 kg (2023). Both adults who smoked and those who did not smoke exhibited the characteristic weight trajectory, as did participants in different food environment categories, though those in food swamp areas gained more weight than in healthy environments (0.66 vs. 0.49 kg).
Weight change (kg) in Hispanic adults between 2019 and each year from 2020 to 2023, overall and by subgroups of sex, race, baseline age groups, smoking status, mRFEI food groups, and baseline obesity classifications (results from Table 2).

Annual body weight (kg), among all and by sociodemographic groups, annual BMI (kg/m2) and BMI status from 2019 to 2023

Table 2 Long description
The table presents data on annual body weight (kg) and BMI (kg/m2) among various sociodemographic groups from 2019 to 2023. It includes baseline weight among all participants and grouped variables such as age, sex, race, smoking status, and food environment. The table also shows baseline underweight status in 2019, BMI status within the year, and various health conditions like diabetes, hypertension, depression, heart disease, stroke, cancer, AIDS, and kidney disease. Additionally, it provides data on dementia status and obesity status. The table has 10 columns and 50 rows, with each row representing different categories and variables being compared. Notable trends include significant weight gain during the pandemic period, with a peak in 2021 followed by a decline in 2023. Age-stratified analyses show divergent trends, with younger participants gaining more weight and older participants losing weight. The table also highlights differences in weight gain among different races, sexes, and food environments.
† When body weights were compared using repeated measures ANOVA, the p value was less than 0.001, which means at least one pair of two years had different weights. Paired t tests for pairwise comparisons was performed to compare weights in any of the two years from 2019 through 2023, and the results showed that, except for the pair of the years 2020 and 2023 (Holm-Bonferroni-adjusted p = 0.822), the change in weights between any two years from 2019 to 2023 was statistically significant.
‡ Similar to the comparison of body weight, BMI also changed significantly using repeated measures ANOVA, with a p-value of less than 0.001, and the BMI in 2020 and 2023 did not vary significantly (adjusted p-value of 0.238).
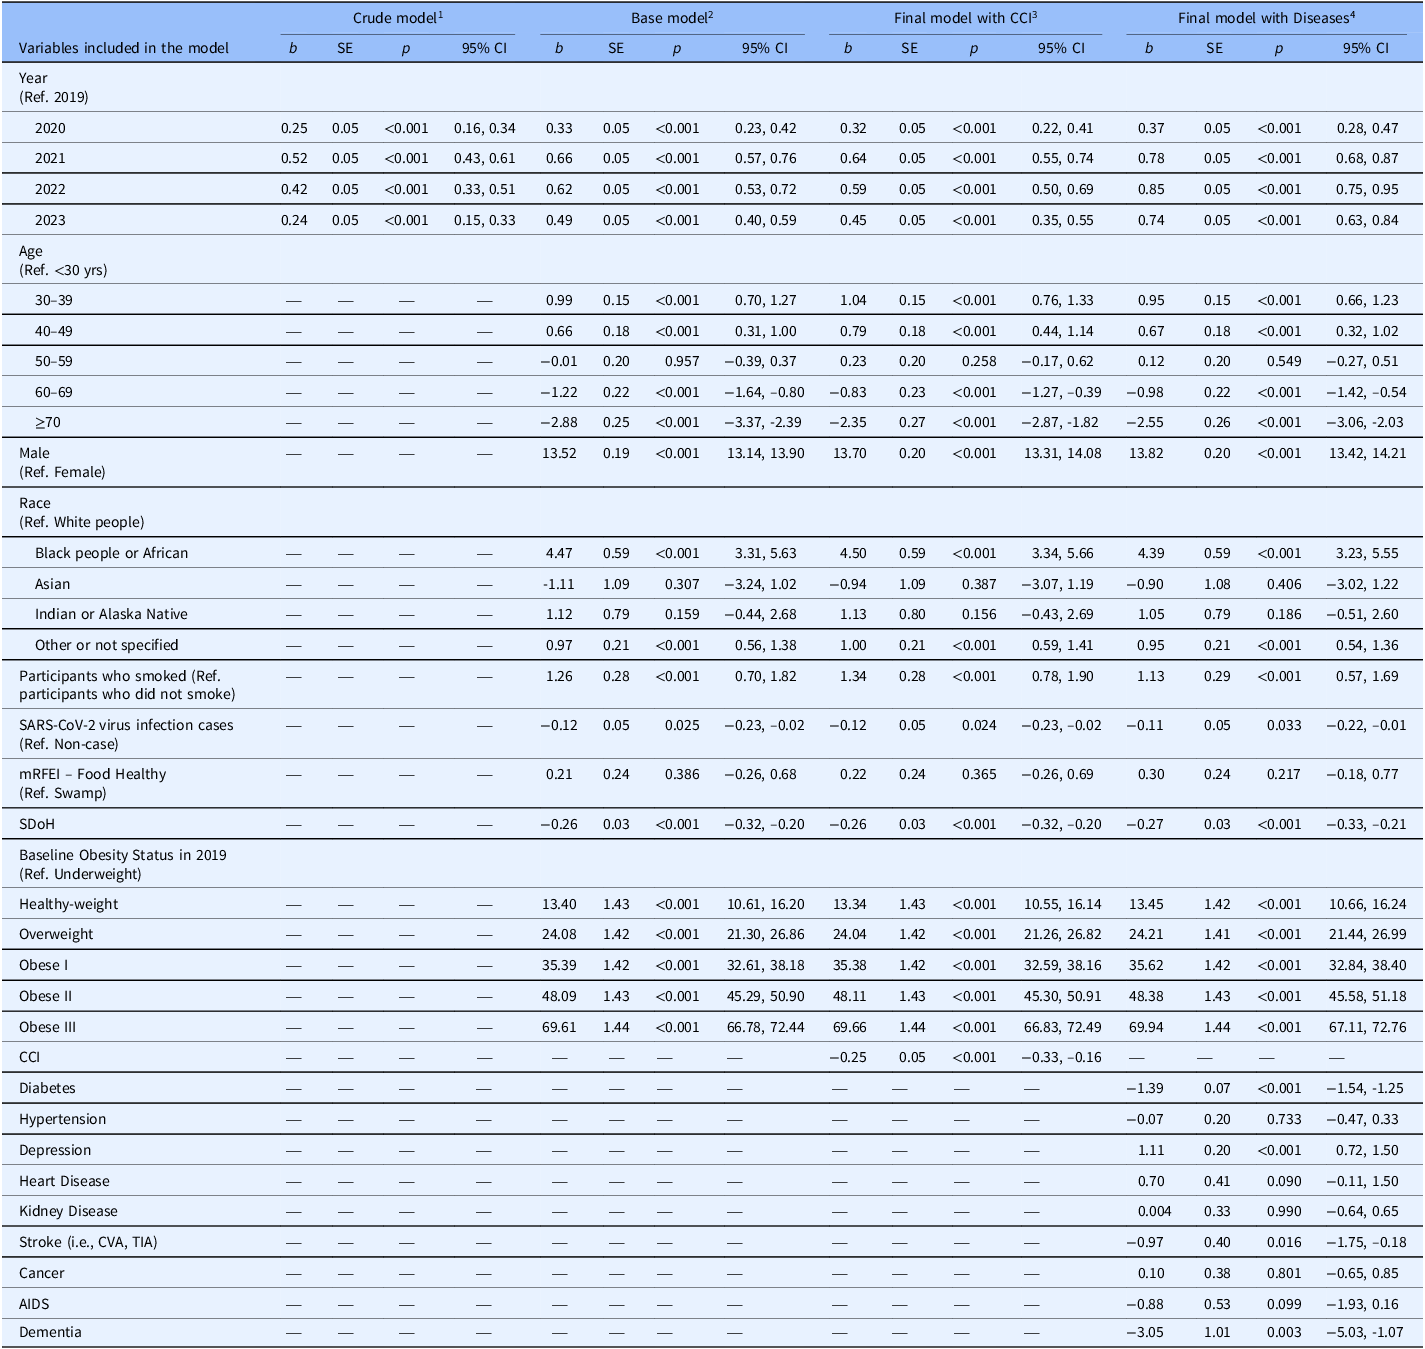
Changes in body weight (kg) during the SARS-CoV-2 virus pandemic using linear mixed models: coefficients estimate (b), p value (p) and its 95% CI

Table 3 Long description
A table with 4 columns and 30 rows. Column headers are: Variables included in the model, Crude model, Base model, Final model with CCI, Final model with Diseases. Row labels include Year, Age, Male, Race, Participants who smoked, SARS-CoV-2 virus infection cases, mRFEI Food Healthy, SDoH, Baseline Obesity Status in 2019, CCI, Diabetes, Hypertension, Depression, Heart Disease, Kidney Disease, Stroke, Cancer, AIDS, Dementia. Each row contains values for b, SE, p, and 95% CI across different models. The table presents coefficients estimate (b), p value (p), and its 95% confidence interval (CI) for various variables included in the model.
1 The crude model included only the predictor, measurement year.
2 The base model included the predictor (measurement year) and was adjusted for age, sex, race, tobacco smoking, COVID-19 diagnosis during the year, mRFEI food groups, SDOH index, and baseline BMI status (2019).
3 The more complex model included variables from the base model, and CCI.
4 The more complex model adjusted for the variables included in the base model, as well as specific weight-related diseases (binary, yes/no), including diabetes, hypertension, depression, heart disease, kidney disease, stroke (CVA, TIA), cancer, AIDS, and Dementia. All these variables used participants who did not suffer from these diseases as the reference group.
Weight changes during the pandemic varied significantly by pre-pandemic weight status: underweight, healthy weight, and overweight individuals continued gaining weight through 2023 (through 2022 for overweight individuals), while obese participants in class II/III lost weight (most pronounced in class III: –2.86 kg). Participants with SARS-CoV-2 virus infection had higher weights during peak pandemic years (2020, 2021) and 2023, but lower weights in 2022 (–0.56 kg) compared to those without. Various comorbidities showed distinct associations, with hypertension, depression, heart disease, cancer and AIDS following a peak-then-decline pattern, and with diabetes, stroke, kidney disease, and dementia patients tending toward weight loss throughout the study period. Lastly, the prevalence of healthy weight and overweight declined through 2021 and remained below pre-pandemic levels in 2023. In contrast, all obesity classes (I–III) increased through 2021 and, despite subsequent declines, remained elevated. Notably, obese class I prevalence rebounded from 28.17% in 2022 to 28.68% in 2023. These sustained shifts in weight categories consistently reflected the observed peak-then-decline pattern of pandemic-related weight changes.
Linear mixed models (Table 3) confirmed significant pandemic-related weight increases, peaking in 2021 (Base Model: adjusted b = 0.66, 95% CI: 0.57, 0.76). Weight patterns varied considerably across age groups. Participants aged 30–39 years had the highest mean weight, 0.99 kg (95% CI: 0.70, 1.27) heavier than those in their 20s. In contrast, weights gradually decreased with age, with those over 69 years having the lowest weight (b = −2.88, 95% CI: −3.37, –2.39). Men weighed much more than women (+13.52 kg, 95% CI: 13.14, 13.90). In this Hispanic cohort, Black adults weighed substantially more than White adults, (+4.47 kg, 95% CI: 3.31, 5.63). The adults who smoked were 1.26 kg (95% CI: 0.70, 1.82) heavier than those who did not smoke. SARS-CoV-2 virus infection cases were 0.12 kg lighter than noncases (95% CI: −0.23, –0.02). Individuals in healthy food environments weighing 0.21 kg more than those in food swamp areas, but not statistically significant (p = 0.386). Notably, each unit increase in the Social Determinants of Health Index was associated with a weight loss of 0.26 kg (95% CI: −0.32, –0.20).
Comorbidity patterns showed complex associations (Table 3): depression (b = 1.11, 95% CI: 0.72, 1.50) was associated with higher weights, whereas diabetes (b = −1.39, 95% CI: −1.54, –1.25), CVA/TIA stroke (b = −0.97, 95% CI: −1.75, –0.18), and dementia (b = −3.05, 95% CI: −5.03, –1.07) significantly correlated with weight reduction.
The observed peak-then-decline weight pattern demonstrated strong statistical validity, with Holm-Bonferroni-adjusted paired t test analyses confirming significant year-to-year changes for most comparisons (Table 2). The exception was 2020 versus 2023 (p = 0.822), indicating that although weights in 2023 approached 2020 levels, they remained elevated compared to pre-pandemic baseline.
Pandemic peak analysis (2019 vs. 2021) (Tables 4, 5 and Figure 2)
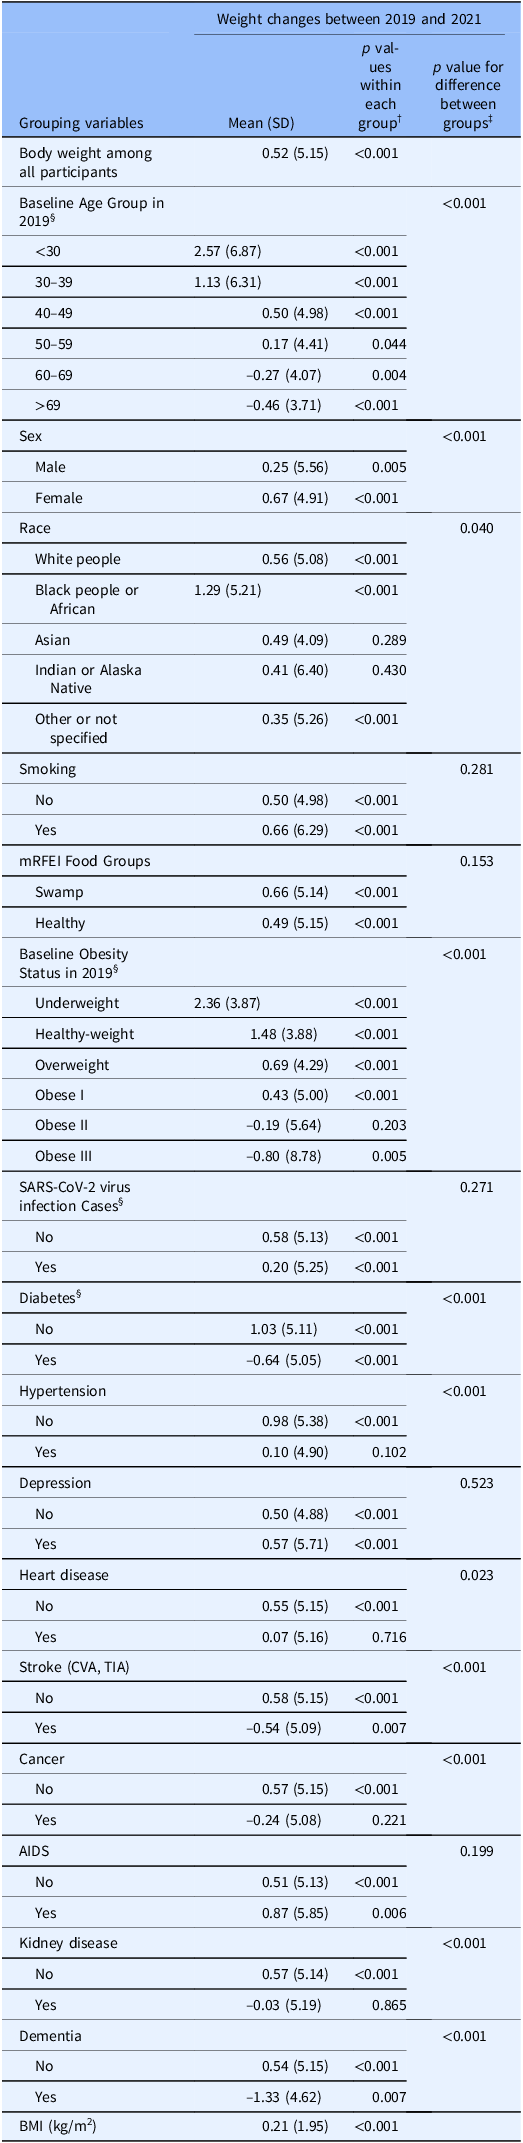
Our analysis specifically compared weight between 2019 (pre-pandemic) and 2021 (peak of pandemic), the two years most heavily influenced by SARS-CoV-2 virus pandemic. To examine weight changes in the same population while accounting for natural progression, we used baseline characteristics (including age groups, obesity status) in 2019, and SARS-CoV-2 virus infection and diabetes diagnoses by 2021, which explains why some values in Table 4 differ from Table 2. This approach revealed the pandemic’s distinct impact beyond normal temporal variations.
Change in body weight (kg) and BMI (kg/m2) between 2019 and 2021, among all participants and within subgroups

Table 4 Long description
A table comparing body weight changes between 2019 and 2021 across different subgroups. The table has 30 rows and 6 columns. Column headers are Grouping variables, Mean (SD), p-value for comparison between each group, and p-value for comparison between groups. Row labels include Body weight among all participants, Baseline Age Group in 2019, Sex, Race, Smoking, mRERI Food Groups, Baseline Obesity Status in 2019, SARS-CoV-2 virus infection cases, Diabetes, Hypertension, Depression, Heart disease, Stroke (ICVA, TIA), Cancer, AIDS, Kidney disease, Dementia, and BMI (kg/m2). Each row provides specific data points for the respective grouping variables.
§ The age groups and baseline obesity status in 2019 were used in order to compare weights in the same population. For the same reason, diabetes and SARS-CoV-2 virus infection diagnoses in 2021 were used.
† p values were from one-sample t tests when testing for change in weight/BMI between 2019 and 2021 equaled to zero or not, as well as change in weight within groups equaled to zero or not.
‡ p values were from independent t tests when comparing weight changes (2019–2021) between two different independent groups, or from one-way ANOVA tests when there were more than two groups (i.e., age, race, and baseline BMI status in 2019). Following significant ANOVA, post hoc Tukey HSD tests were conducted for pairwise comparisons. Key findings include: All pairs of age groups were significant (adjusted p < 0.05), except the pair of (40–49 vs. 50–59 years with p = 0.106), and the pair of (60–69 vs. > 69 years with p = 0.952); Only Black adults and Others reached significance (p = 0.030), all other racial pairing were nonsignificant; Significant differences were observed for most pairs of baseline BMI status, except (Underweight vs. Healthy-weight, p = 0.853), (Underweight vs. Overweight, p = 0.224), (Underweight vs. Obese I, p = 0.105), (Overweight vs. Obese I, p = 0.278) and (Obese II vs. Obese III, p = 0.051).
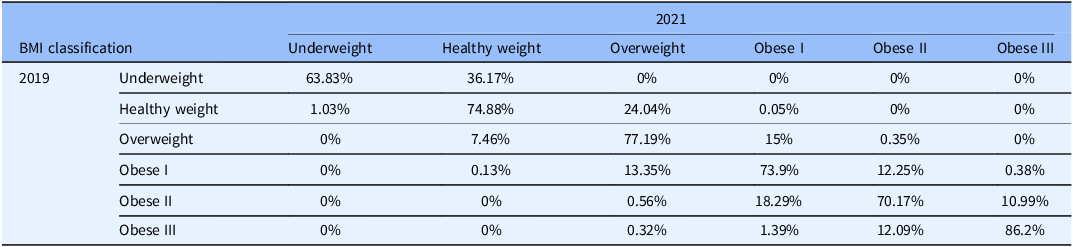
Change in BMI classification for 2021 compared to 2019 (expressed as row percentages)§ (N = 11,452)

Table 5 Long description
A table comparing BMI classifications between 2019 and 2021, expressed as row percentages. The table has 6 rows and 7 columns. The columns are labeled as Underweight, Healthy weight, Overweight, Obese I, Obese II, and Obese III for the year 2021. The rows are labeled as Underweight, Healthy weight, Overweight, Obese I, Obese II, and Obese III for the year 2019. Row 1: Underweight, 63.83 percent; Healthy weight, 36.17 percent; Overweight, 0 percent; Obese I, 0 percent; Obese II, 0 percent; Obese III, 0 percent. Row 2: Healthy weight, 1.03 percent; Healthy weight, 74.88 percent; Overweight, 24.04 percent; Obese I, 0.05 percent; Obese II, 0 percent; Obese III, 0 percent. Row 3: Underweight, 0 percent; Healthy weight, 7.46 percent; Overweight, 77.19 percent; Obese I, 15 percent; Obese II, 0.35 percent; Obese III, 0 percent. Row 4: Underweight, 0 percent; Healthy weight, 0.13 percent; Overweight, 13.35 percent; Obese I, 73.9 percent; Obese II, 12.25 percent; Obese III, 0.38 percent. Row 5: Underweight, 0 percent; Healthy weight, 0 percent; Overweight, 0.56 percent; Obese I, 18.29 percent; Obese II, 70.17 percent; Obese III, 10.99 percent. Row 6: Underweight, 0 percent; Healthy weight, 0 percent; Overweight, 0.32 percent; Obese I, 1.39 percent; Obese II, 12.09 percent; Obese III, 86.2 percent.
§ McNemar-Bower test was used to assess the changes in BMI status between 2019 and 2021, all p-values were less than 0.001.
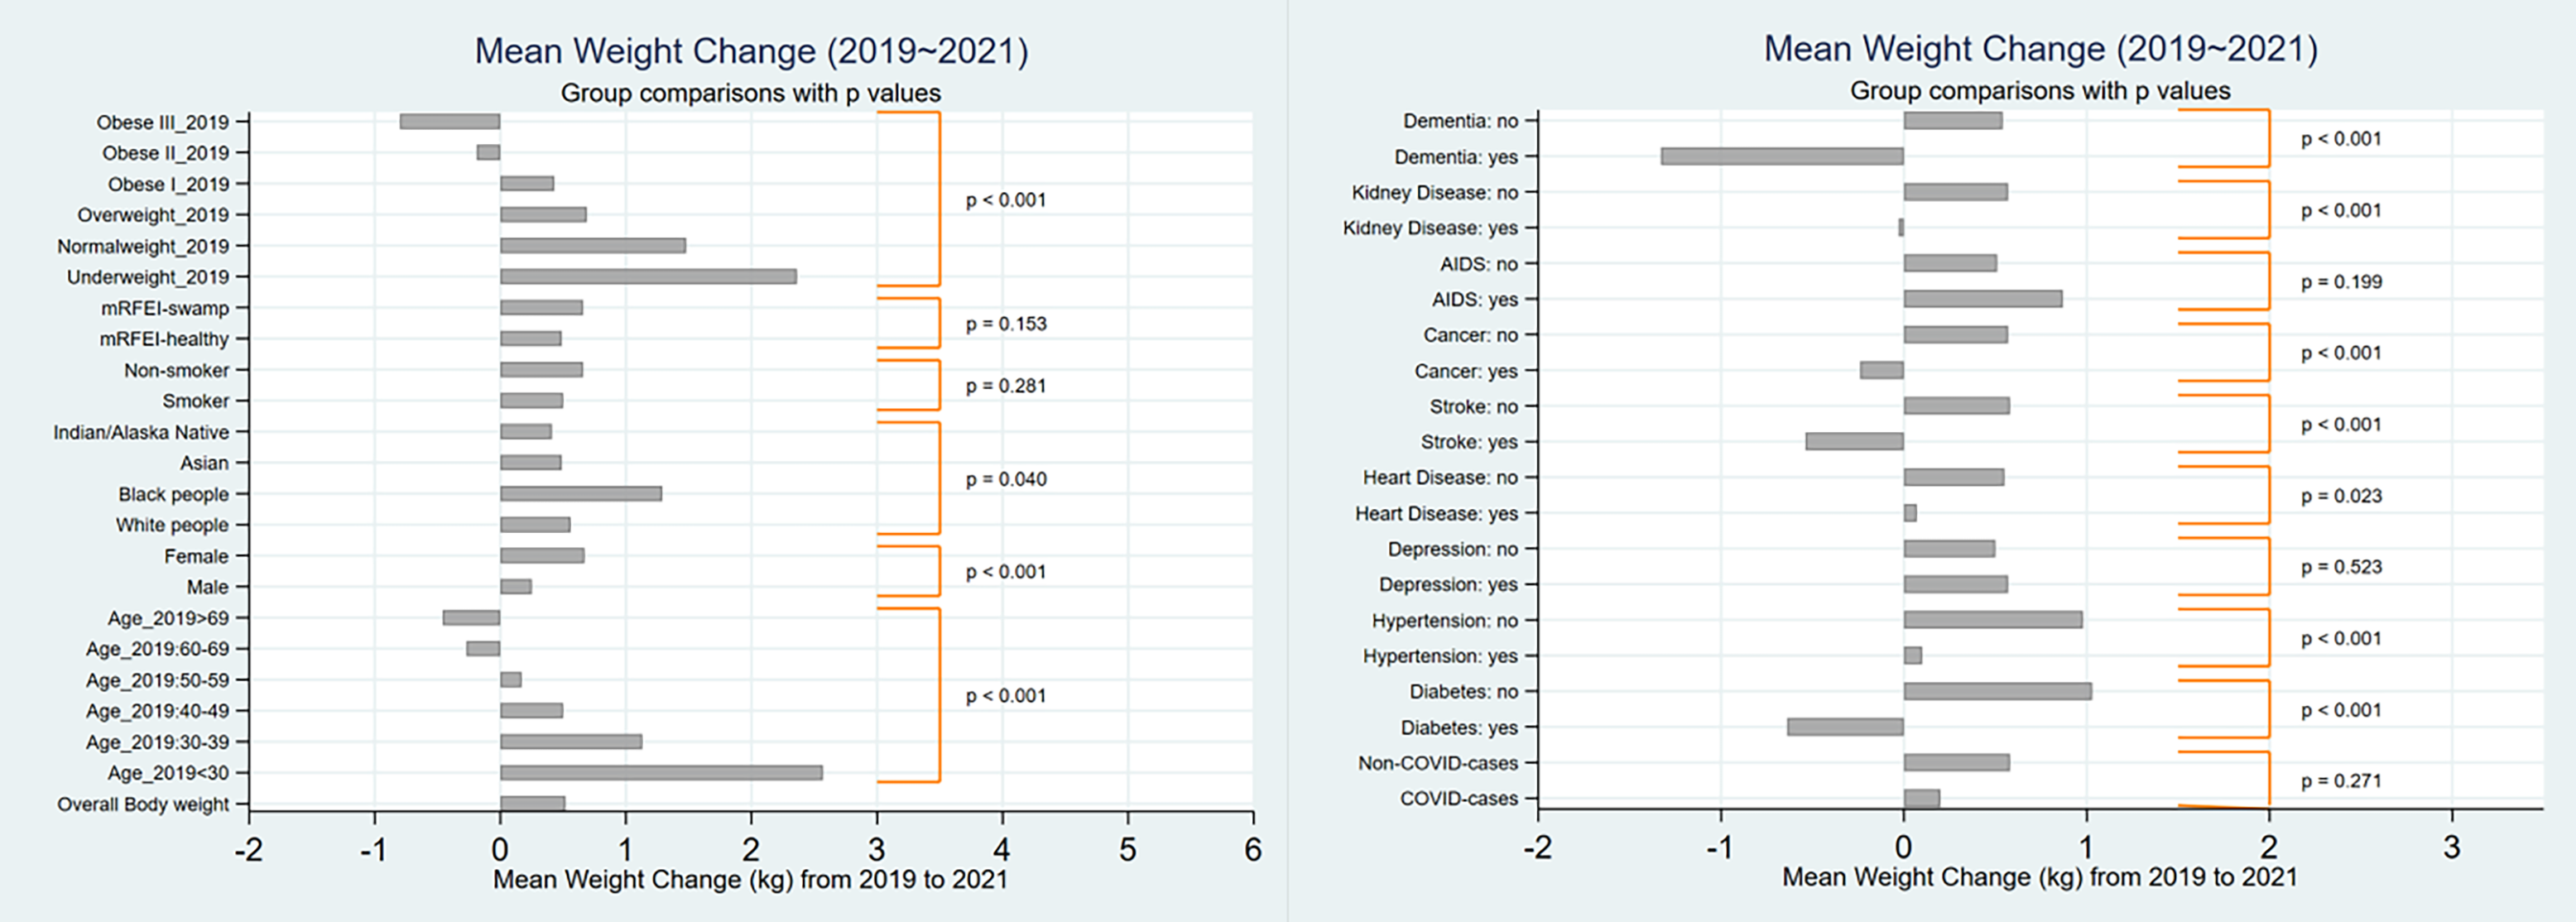
Mean of body weight change (2019–2021) overall and by groups (results from Table 4).

The data showed significant weight changes across the study population. Overall weight increased by 0.52 kg (p < 0.001), with a corresponding rise in BMI (mean = 0.21, SD = 1.95). This change reflected a different pattern: 55.0% of participants gained an average of 3.73 kg (BMI +1.42 kg/m2), while 44.0% lost an average of 3.50 kg (BMI –1.31 kg/m2). Age-stratified analyses showed significant differences (p < 0.001). From 2019 to 2021, younger adults (21–49 years) gained significantly weight (+0.50 to +2.57 kg), whereas those aged ≥ 60 years lost weight (–0.27 to –0.46 kg). Women gained more weight than men (0.67 vs. 0.25 kg). In terms of racial difference (p = 0.040), the greatest average gain was observed among Black adults (1.29 kg), followed by White (+0.56 kg), Asian (+0.49 kg) and Indian/Alaska Native (+0.41 kg) adults. Both adults who smoked (+0.66 kg) and those who did not smoke (+0.50 kg) gained weight, but the difference was nonsignificant (p = 0.281). Participants in food swamp areas gained more weight (but nonsignificant) than those in healthy food environments (0.66 vs. 0.50 kg, p = 0.153). Pre-pandemic obesity status significantly influenced weight trajectories (p < 0.001): underweight (+2.36 kg), healthy weight (+1.48 kg), overweight (+0.69 kg) and obese I (+0.43 kg) participants gained weight, while obese II (–0.19 kg) and III (–0.80 kg) participants lost weight. SARS-CoV-2 virus infection showed weight gains in both infected (+0.20 kg) and uninfected (+0.58 kg) individuals. Comorbidities demonstrated varied associations. Participants with diabetes, stroke, cancer, kidney disease, and dementia lost weight. Conversely, those with depression and AIDS gained weight. Those with hypertension (0.10 vs. 0.98 kg) and heart disease (0.07 vs. 0.55 kg) showed less weight gain compared to healthy individuals.
Changes in obesity were particularly noteworthy (p < 0.001) (Table 5): 74.4% maintained their pre-pandemic obesity grades, 16.5% progressed to higher grades and 9.1% declined to lower grades.
Discussion
Results revealed the dramatic metabolic impact of SARS-CoV-2 virus pandemic and the varied physiological adaptations of Hispanic adults faced with pandemic-related stress and lifestyle disruptions [Reference Khubchandani, Price, Sharma, Wiblishauser and Webb2,Reference Bennett, Young, Butler and Coe5,Reference Madan, Blonquist and Rao6,Reference Zeigler9,Reference Almousa and Alagal11,Reference Picchioni, Goulao and Roberfroid15,Reference Zupo, Castellana and Sardone38–Reference Chew and Lopez41]. Our findings aligned with previous reports of pandemic-related weight changes across different populations [Reference Khubchandani, Price, Sharma, Wiblishauser and Webb2,Reference Bennett, Young, Butler and Coe5,Reference Madan, Blonquist and Rao6,Reference Almousa and Alagal11,Reference Alshahrani, Alghannam and Taha17,Reference Anderson, Yoshida-Montezuma and Dewart42], while providing new insights into particular experiences of Hispanic adults.
The peak-then-decline temporal pattern is likely the result of viral attenuation, widespread vaccination [33,Reference Pariseault34,Reference Anthes and Ngo43], and subsequent reopening of workplaces, supermarkets, schools, and recreational facilities. The gradual and incomplete return to pre-pandemic weight levels by 2023 suggests lingering effects of pandemic-related lifestyle disruptions. The pattern was consistent across most demographic groups, including different age and racial categories, smoking status, and food environment classifications.
Adults over 59 years exhibited continuous weight loss (1.3–1.7 kg) throughout the pandemic, likely stemming from the complex interplay between biological aging processes and pandemic-related stresses that disproportionately affected older populations [Reference Fielding, Vellas and Evans44–Reference Elisabeth, Karlen and Magkos47]. Results suggested these combined effects might have doubled or tripled the usual weight loss rates in this vulnerable population [Reference Vetter, Drewelies and Düzel48], though direct pre-pandemic comparisons remained challenging due to limited baseline data.
Our study revealed age-dependent weight changes during the pandemic, consistent with previous research demonstrating that young adults are more susceptible to lifestyle disturbances [Reference Mulugeta, Desalegn and Solomon7,Reference Almousa and Alagal11,Reference Goitia, Chen, Patel, Herald and Lee13,Reference Huang, Chan and Ko18,Reference Freedman, Kompaniyets, Daymont, Zhao and Blanck19,Reference Tebar, Silva and Christofaro49,Reference Valabhji, Barron, Bradley, Bakhai, Khunti and Jebb50]. Hispanic women had greater long-term (including lockdown) weight gain than men, aligning with other studies [Reference Mulugeta, Desalegn and Solomon7,Reference Freedman, Kompaniyets, Daymont, Zhao and Blanck19,Reference Chew and Lopez41,Reference Valabhji, Barron, Bradley, Bakhai, Khunti and Jebb50]. This pattern may relate to women’s greater susceptibility to pandemic-related psychological stressors like insomnia, anxiety, and stress-related disorders [Reference yu, Wang, Ou-yang and yong51]. Racial differences were evident, with Black participants experiencing the most significant weight gain. Historical socioeconomic and environmental disadvantages may contribute to this finding, as these factors are well-documented drivers of nutritional and obesity differences [Reference Xiao, Myott, Schlundt and Stancil14,Reference Koebnick, Sidell and Li20,Reference Belanger, Hill, Angelidi, Dalamaga, Sowers and Mantzoros52].
Those adults who smoked gained more weight during the pandemic, possibly due to smoking’s metabolic effects [Reference Shimelpfening53,Reference Chiolero, Faeh, Paccaud and Cornuz54], increased smoking frequency [Reference Mulugeta, Desalegn and Solomon7,Reference Sidor and Rzymski55], and associated risk behaviors (e.g., low degree of physical activity and poor diet) [Reference Wiener, Waters and Morgan8,Reference Chiolero, Faeh, Paccaud and Cornuz54]. Participants in both food swamps and healthy food environments experienced weight gain during the pandemic, with weight gain slightly greater among those in food swamp neighborhoods. This is consistent with prior literature [Reference Goitia, Chen, Patel, Herald and Lee13,Reference Xiao, Myott, Schlundt and Stancil14,Reference Huang, Chan and Ko18], suggesting that disadvantaged neighborhood food environments (and the often accompanying socioeconomic factors) may contribute to elevated obesity risk.
Pre-existing medical conditions also influenced weight trajectories in distinct ways. Patients with stroke, AIDS, or dementia consistently maintained lower weights than their healthy counterparts. Similarly, individuals with higher CCI scores tended to weigh less, reflecting the cumulative metabolic burden of multiple chronic conditions. Conversely, those with diabetes, hypertension, depression, heart or kidney disease generally carried more weight, likely due to a combination of behavioral factors and medication side effects (e.g., antidepressants and beta-blockers) [Reference Sheps56] that alter metabolism, and disease-specific physiological changes. The SARS-CoV-2 virus pandemic amplified weight-related differences between healthy individuals and those with chronic conditions, potentially due to reduced healthcare access and heightened vulnerability to lifestyle disruptions, Without pre-pandemic longitudinal data, not all changes could be attributed to the pandemic; however, the timing and consistency of these patterns strongly suggested SARS-CoV-2 virus pandemic disruptions amplified existing health differences in weight management among medically vulnerable groups.
Weight loss during the pandemic was primarily observed among older adults and individuals with diabetes or class II/III obesity, a pattern that may reflect a combination of clinical, behavioral, and therapeutic factors. While unintentional weight loss in older adults can signal underlying illness or frailty, the concentration of weight reduction in those with severe obesity (particularly those with diabetes) raises the possibility of intentional, treatment-driven weight loss (e.g., adoption of GLP-1 receptor agonists and bariatric surgery) [57–Reference Watanabe, Kwon, Nan and Reikes60]. Our data did not include information on medication use, surgical history, or intent behind weight change, so distinguishing between therapeutic weight loss, lifestyle-driven changes, and illness-related weight loss was not possible.
Study strengths
The N3C clinical cohort offered a large, nationally representative sample of SARS-CoV-2 virus-tested individuals with harmonized and comprehensive data from multiple institutions across the U.S.. Second, our regression models stratified participants by pre-pandemic obesity categories and adjusted for baseline weight status to address the impact of weight change on varying health effects. Third, the within-person comparison using a longitudinal design with repeated measurements over five years allowed us to track weight changes in the same individuals, reduce potential bias and strengthen the validity of our findings regarding pandemic-related weight changes.
The modest magnitude of the observed average weight change (approximately 1 pound) might appear insignificant at the individual level. However, this seemingly minor increase translates into a substantial aggregate burden in the context of population health, as suggested by the “prevention paradox” theory put forward by Rose [Reference Rose61,Reference G.62].
Study limitations
Key factors, such as regional differences in lockdown policies and psychological factors such as anxiety and depression, were not considered in the study design. Despite adjusting for chronic disease and health status in our analyses, some residual confounders might remain. Other variables, such as mRFEI and SDoH, reflected average area-level rather than individual level, while SDoH, CCI and disease diagnoses were static throughout the study period. Additionally, weight measurements varied in frequency and timing across participants. We addressed this limitation by using annual averages, which effectively captured long-term trends but might mask shorter-term variations that could provide additional insights. Using Hispanic adults as the target population limited the generalizability of our findings to other ethnic groups. Future studies would benefit from detecting weight changes more frequently to better characterize the dynamic impacts of the pandemic and incorporating cross-ethnic comparisons.
Another limitation was the stringent requirement for a complete-case dataset, which likely introduced selection bias and constrained the generalizability of the findings. From an initial pool of approximately two million participants, the final sample (N = 11,452) included only those with plausible and nonoutlier values for body weight and height, complete annual outcome data throughout follow-up, and complete covariate data. This necessary but restrictive approach led to a drastic reduction in sample size, potentially making the final cohort unrepresentative of the broader target population. Future studies should employ advanced methods for handling missing data to retain a larger and more representative sample. In addition, while the N3C data enhanced geographic and provider difference, its population may not be fully representative of the entire U.S. population [63,Reference Lyu, Cui and Finkelstein64]. Differences in data collection practices across healthcare systems could introduce variability, although N3C data harmonization efforts helped mitigate this. Finally, although our longitudinal design provided valuable evidence for the associations between the pandemic and weight changes, potential unmeasured confounders precluded causal interpretations due to the observational nature of the data.
Conclusion
This study analyzed body weight changes among Hispanic adults in the U.S. during the SARS-CoV-2 virus pandemic using N3C data, revealing significant peak-and-decline patterns with notable variations across different demographic and clinical subgroups. These findings highlighted the disproportionate weight-related impacts of the pandemic on Hispanic population and underscored the need for targeted interventions.
Data availability
Data used in this study may be requested from NCATS (https://n3c.ncats.nih.gov/clinical-cohort) with some restrictions. Access to data requires data request approval from N3C and adherence to regulatory and training requirements that all N3C users must follow.
Acknowledgments
The analyses described in this manuscript were conducted with data or tools accessed through the NCATS N3C Data Enclave https://covid.cd2h.org and N3C Attribution & Publication Policy v 1.2-2020-08-25b supported by NCATS Contract No. 75N95023D00001. This research was possible because of the patients whose information is included within the data and the organizations (https://ncats.nih.gov/n3c/resources/data-contribution/data-transfer-agreement-signatories) and scientists who have contributed to the on-going development of this community resource (covid.cd2h.org/acknowledgements) [Reference Haendel, Chute and Bennett23].
The N3C data transfer to NCATS is performed under a Johns Hopkins University Reliance Protocol No. IRB00249128 or individual site agreements with NIH. The N3C Data Enclave is managed under the authority of the NIH; information can be found at https://ncats.nih.gov/n3c/resources.
The N3C Publication committee confirmed that this manuscript is in accordance with N3C data use and attribution policies; however, this content is solely the responsibility of the authors and does not necessarily represent the official views of the National Institutes of Health or the N3C program.
The authors would like to recognize the supports from the Hispanic in Research Capabilities Endowment (HiREC) program, and the Research Design, Compliance, and Data Management Core of the Alliance for Clinical & Translational Research program.
Author contributions
Kai Guo: Conceptualization, Formal analysis, Funding acquisition, Investigation, Methodology, Project administration, Supervision, Validation, Visualization, Writing-original draft, Writing-review & editing; Pedro J. Castro: Data curation, Formal analysis, Resources, Software, Validation, Writing-review & editing; Evangelia Morou-Bermudez: Validation, Writing-review & editing; Sona Rivas-Tumanyan: Validation, Writing-review & editing; Lourdes Esther Soto de Laurido: Validation, Writing-review & editing; Mary Helen Mays: Project administration, Resources, Software, Supervision, Validation, Writing-review & editing.
Funding statement
This study was supported through institutional funds provided by the University of Puerto Rico.
Competing interests
All authors declare that there were no relevant disclosures to the submitted material, and the research was conducted in the absence of any commercial or financial relationships that could be construed as a potential conflict of interest.

 Open access

