Introduction
Cranberry (Vaccinium macrocarpon Aiton (Ericaceae)) is native to northeastern North America. Although it has been consumed for centuries (Eck Reference Eck1990), it has only recently become an agricultural crop, particularly in Newfoundland, Newfoundland and Labrador, Canada. As of 2016, there were 7339 ha of commercially cultivated cranberries Canada-wide (Statistics Canada 2017), most of which were in Québec and British Columbia. Commercial cranberry production in Newfoundland began with government support for five pilot projects beginning in 1996. By 2013, there were 14 cranberry farms in the province, totalling approximately 81 ha (Paddon Reference Paddon2014).
With the expansion of cranberry cultivation in Newfoundland, there has been increased interest in supplemental pollination services provided by managed pollinators, such as honey bees (Apis mellifera Linnaeus (Hymenoptera: Apidae)), bumble bees (Bombus Latreille (Hymenoptera: Apidae)), or leaf-cutter bees (Hymenoptera: Megachilidae). Although cranberry flowers are self-compatible (Dana et al. Reference Dana, Steinmann and Goben1989; Sarracino and Vorsa Reference Sarracino and Vorsa1991), pollen is released before the stigma is receptive; thus, self-pollination is unlikely (Rigby and Dana Reference Rigby and Dana1972). In addition, cranberry has poricidal anthers (Buchmann Reference Buchmann, Jones and Little1983), which shed little pollen without sonication, also called buzz pollination. Bumble bees and many other native bees buzz-pollinate, but honey bees do not (MacKenzie Reference MacKenzie1994). At least 70% of fruit yield is the result of insect activity (Gaines-Day and Gratton Reference Gaines-Day and Gratton2015).
In areas with a well-established cranberry industry, supplemental pollination is typically required, particularly in locations with high agricultural intensity (e.g., Wisconsin, United States of America; Gaines-Day and Gratton Reference Gaines-Day and Gratton2015). However, supplementation does not always increase yield (e.g., Gaines-Day and Gratton Reference Gaines-Day and Gratton2015), and native pollinators may be required for maximal yield (Button and Elle Reference Button and Elle2014). In Newfoundland, agricultural intensity is low, cranberry farms are relatively small, and these are embedded in mostly natural habitats consisting of forests and bogs. Under these conditions, there may be sufficient native pollinators to maximise crop yield. As the industry develops, there is an opportunity to develop best practices early on, which could include relatively inexpensive farm management practices to ensure a healthy native pollinator population.
There are several compelling reasons for taking this approach. First, Newfoundland has a challenging climate, with a long winter and unpredictable spring weather followed by a short, cool summer. Native bees are likely to have adaptations to the local climate. Second, the honey bee population of the island is of considerable interest and value, as Newfoundland is one of the few remaining areas that is free of Varroa destructor Anderson and Trueman (Acari: Varroidae) (Williams et al. Reference Williams, Head, Burgher-MacLellan, Rogers and Shutler2010). Third, although there are managed honey bees, it is a very small population. As of 2018, there were approximately 400 hives among seven commercial bee keepers, and approximately 300 hives kept by hobbyists (C. Dempsey, personal communication), offering limited opportunities to use honey bees for supplemental pollination. It is also unclear whether honey bees would provide significant gains in cranberry yield due to the requirement for buzz pollination. Honey bees can collect pollen from cranberry by drumming on the anthers, but will forage on preferred species if they are available (Cane et al. Reference Cane, MacKenzie and Schiffhauer1993; Cane and Schiffhauer Reference Cane and Schiffhauer2001); with low agricultural intensity, such alternative floral resources are likely to be available. Finally, Bombus impatiens Cresson (Hymenoptera: Apidae), which is often used for crops requiring buzz pollination, is not permitted for use in Newfoundland due to concerns about cross-species disease or parasite transfer to honey bees and native bees. There is also a significant risk of its introduction to the island, as the species appears to have expanded its range into the adjacent Maritime provinces through escapes from commercially reared nests (Sheffield et al. Reference Sheffield, Kevan and Smith2003). There have been some records of escaped and overwintered queens in Newfoundland, but to date this species is not known to have become established (Sircom Reference Sircom2019).
This research was undertaken to help meet the pollination needs of the cranberry industry. The primary goals were to identify key pollinators and determine whether natural variation in their abundance was related to differences in cranberry yield among farms.
Methods
Cranberry farms
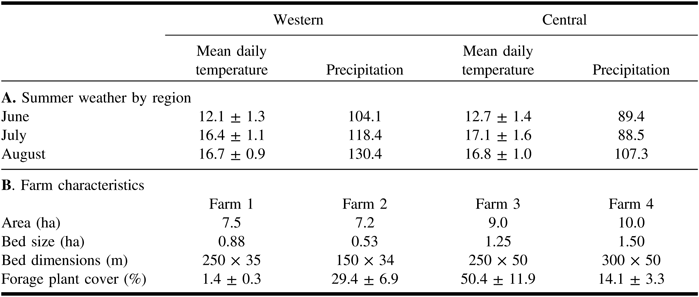
Sampling was carried out during 2014 and 2015 on four commercial cranberry farms on the island of Newfoundland, Canada. Two farms (Farm 1, 28 m above sea level; Farm 2, 50 m) were located in the Western Newfoundland Forest Ecoregion (Damman Reference Damman and South1983; Meades and Moores Reference Meades and Moores1994), near Stephenville. The others (Farm 3, 74 m; Farm 4, 99 m) were located in the Central Newfoundland Forest Ecoregion, near Grand Falls-Windsor. The climate is similar in the two locations, with slightly drier summers in Grand Falls (Table 1A). Two crop beds on each farm were sampled, all planted with the cultivar Pilgrim, of similar age and plant density. Farms 1 and 2 were slightly smaller in total area, with smaller individual crop beds, than Farms 3 and 4 (Table 1B). Despite the import restriction, Farm 1 was supplemented with colonies of commercially reared B. impatiens from early July until mid-August, whereas the other farms did not have any supplemental bees. In both years, there were approximately 25 quads of four colonies each on the entire farm, with six quads on berms adjacent to the studied beds. Honey bees were not present on any of the study farms.
Weather and size data for four commercial cranberry farms in western (Farms 1 and 2) and central (Farms 3 and 4) Newfoundland. A, Average summer weather conditions; B, dimensions and forage availability.

Mean daily temperature ± 1 standard error (°C) and monthly precipitation (mm) for Stephenville (western) and Grand Falls (central) stations from the Canadian Climate Normals, 1981–2010 (Government of Canada 2016). Bed dimensions are based on aerial photographs thus approximate, but representative. Forage plant cover on berms is given ± 1 standard error.
Bee collection
Bees were sampled using white, blue, and yellow pan traps, in transects of nine traps placed at 5-m intervals, alternating the three colours along each transect. The traps were made from 455-mL plastic cups set in stands approximately 25 cm tall, which held the cups at vegetation level and prevented these from being blown over. Blue and yellow cups were painted using Painter’s Touch (Concord, Ontario, Canada) in navy blue and sun yellow; white cups were left unpainted. The traps were approximately one-third filled with propylene glycol (Prestone, Chicago, Illinois, United States of America) plumbing antifreeze decoloured with approximately 3 mL/L household bleach), which was used as a trapping solution, instead of soapy water, because it acts as a short-term preservative, allowing traps to be emptied at longer intervals, and is not attractive to wildlife (Droege Reference Droege2015). The traps were emptied every 7–10 days, and the collected insects temporarily stored in 70% ethanol for transportation.
We opted for pan-trapping in this study due to constraints of time and personnel. Stephenville is approximately 85 km south, and Grand Falls-Windsor is approximately 265 km east of Corner Brook. Travelling such distances makes time-consuming sampling, such as sweep netting, difficult. In addition, the effectiveness of sweep netting is highly dependent on the experience of the person doing the sampling. With several students having varying levels of skills doing the sampling, there were issues of comparability. By using passive pan traps, a more thorough and uniform sampling was possible.
Pan-trapping has some drawbacks (Cane et al. Reference Cane, Minckley and Kervin2000), the chief in this context being that the collections may not be reflective of actual flower visitors, and that bee abundance may be inversely related to flower availability (Baum and Wallen Reference Baum and Wallen2011). To address the first of these concerns, sweep netting was carried out in the sampled crop beds on 21–22 July and 18–19 August 2015 to confirm that pan trap samples were representative of the community visiting the flowers. Also in 2015, individual bee foraging was observed in 1 × 1 m quadrats during 60-minute periods, recording the bee species if possible and the number of flowers visited. This was carried out in favourable weather (sunny to partly sunny, low wind speed, temperature > 18°C) on 28 and 30 July, and 4–5 and 12 August. This provides an indicator of the important floral visitors on these farms.
Vegetation surveys were conducted on three occasions (16 and 18 June, 14 and 15 July, 12 and 14 August 2015) to assess the availability of flowers immediately surrounding the crop beds. Three 1-m-wide belt transects were located at randomly selected locations around the crop bed, reaching from the middle of the berm to the edge of the bed. Cover was estimated for forage plants (i.e., known to be attractive to bees), non-forage plants (e.g., Bryophyta, Poaceae), and bare ground.
Collected bees were cleaned, pinned, and identified. Bombus specimens, including subgenus Bombus (Psithyrus) LePeletier (Hymenoptera: Apidae), were identified to species using Laverty and Harder (Reference Laverty and Harder1988); all other taxa were identified to genus using Packer et al. (Reference Packer, Genaro and Sheffield2007). Specimens have been stored at Grenfell Campus, Memorial University (Corner Brook, Newfoundland and Labrador, Canada).
Contribution of pollinators to fruit production
Sampling locations, separated by at least 5 m and avoiding areas with sparse vine growth, were established in each crop bed. At each location, two groups of unopened flowers (7–24, average 12 per group) were selected and the number of flowers recorded. In 2014, there were 25 locations selected in each crop bed, and 20 locations in 2015. In both years some replicates were lost due to damage, mostly by Alces alces (Linnaeus) (Artiodactyla: Cervidae), so the total number per bed varied. Each group was made up of one to three flowering uprights, most often two, generally on the same vine. At each location, one group was labelled and left accessible to pollinators to assess normal fruit set, while the other was covered with an open-bottom cage held to the ground with a metal skewer, to prevent access by flying insects. Cages were 10 cm in diameter and 15 cm deep, made of fibreglass window screen (1.6-mm openings) reinforced with a popsicle stick along the seam and the rims of two 455-mL plastic cups at the top and bottom of the cylinder, with screen over one end. Any berries were collected when mature, but not fully ripened, to avoid losses due to fruit dropping or being eaten by wildlife. These were refrigerated in sealed bags to reduce water loss and processed within one week of collection. Fruit were weighed on an analytical balance (0.1 mg accuracy).
Stigma loading
The amount of pollen delivered to receptive stigmas may be used as a proxy for pollinator effectiveness if the relationship between the amount of pollen delivered and fruiting response is known. In cranberry, maximum yield is achieved if the stigma receives eight tetrads (Cane and Schiffhauer Reference Cane and Schiffhauer2003), with little increase in fruit set, number of seeds per fruit, or fruit weight with higher loads. In 2015, stigmas were collected during early (21 and 22 July), mid (28 and 30 July), and late bloom (4 and 5 August). Flowers with receptive stigmas were collected along three transects in a crop bed, each transect consisting of three points separated by approximately 5 m. Transects were positioned parallel to the long dimension of the bed, with one 5 m into the bed on one side close to one end, one in the centre, and one 5 m into the bed on the opposite side and end. Slides were prepared by placing stigmas on melted glycerine gel with basic fuchsine stain (Parrish Reference Parrish2004) and were examined under a compound microscope. On each slide, the number of pollen tetrads adhering to five randomly selected stigmas was counted.
Data analysis
Rarefied bee species richness was calculated for each farm using raw counts based on a sample size of 25 in 2014 and 90 in 2015, to correspond with the lowest abundance recorded each year. For further analysis, bee abundances were standardised to 500 trap days.
Fruit set was calculated as the proportion of flowers in a group that produced fruit, separately for flowers with full pollinator access and those with pollinators excluded. Mean fruit weight was calculated separately for flowers with and without pollinator access. Stigma loading was assessed as tetrad count per stigma and as incomplete versus full pollination, where stigmas with ≥ 8 tetrads were considered fully pollinated (Cane and Schiffhauer Reference Cane and Schiffhauer2003).
General linear mixed models were used to explore the relationships between both fruit set (log-natural-transformed to improve normality) and fruit weight, in both cases with and without bee access and the abundance of Bombus (excluding subgenus Psithyrus). Bombus abundance and year were entered as fixed factors and farm was entered as a random factor. Significance was assessed using a likelihood ratio test comparing the full model with models omitting one fixed factor at a time.
Data on stigma loading and local forage availability were available only for 2015; thus, the relationship between stigma loading and both log-natural-transformed fruit set (as response) and Bombus abundance (as predictor), and between Bombus abundance and forage availability, were assessed using general linear models. Visual inspection of residual plots for all analyses revealed no obvious deviations from normality or homoscedasticity.
All statistical analyses were performed using R software version 3.4.3 (R Core Team 2017). Rarefied species richness values were calculated using vegan (Oksanen et al. Reference Oksanen, Blanchet, Friendly, Kindt, Legendre and McGlinn2017), and general linear models were produced using lme4 (Bates et al. Reference Bates, Maechler, Bolker and Walker2013). Figures were generated using ggplot2 (Wickham Reference Wickham2009).
Results
Fruit set and weight
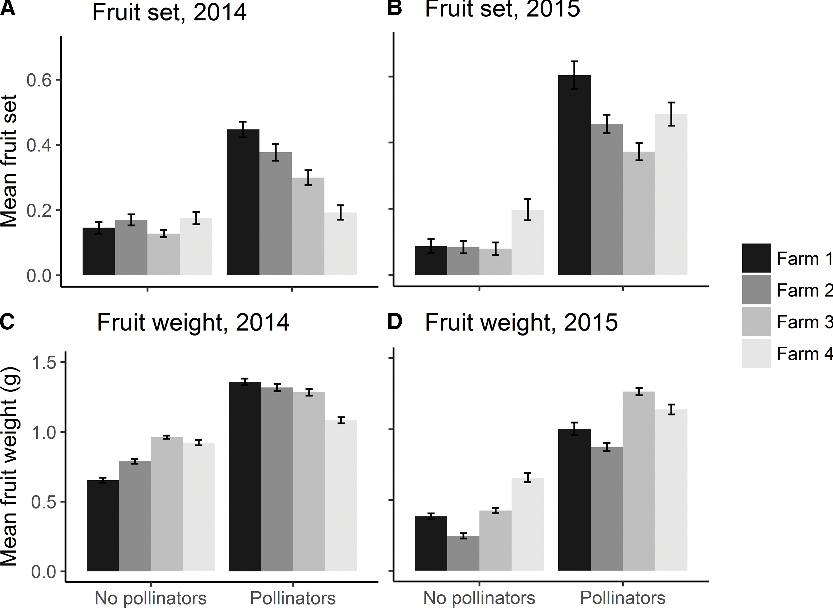
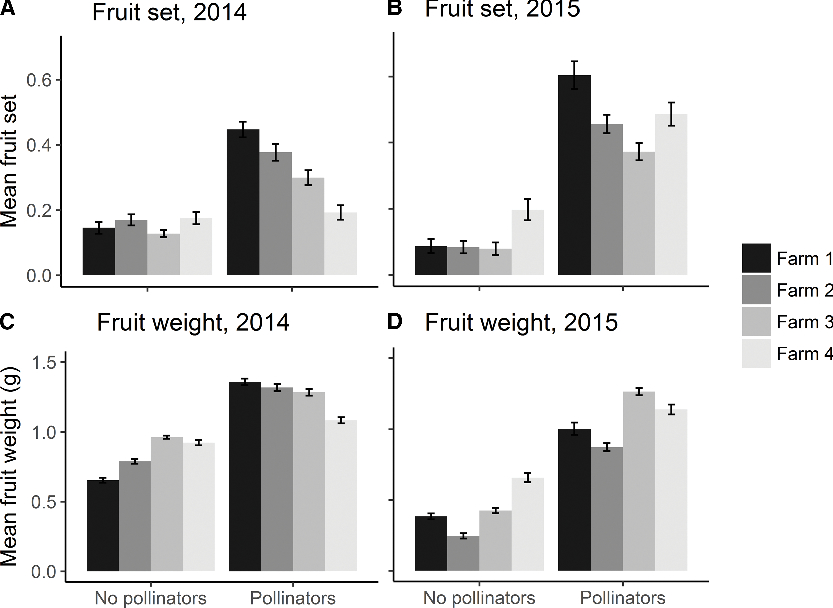
Fruit set was generally low, ranging from 19 ± 2% to 60 ± 4% (mean ± 1 standard error) with pollinators, and from 8 ± 2% to 20 ± 3% without pollinator access (Fig. 1). This was expected due to the bet-hedging strategy of cranberry (Brown and McNeil Reference Brown and McNeil2006), in which flowers pollinating later in the season are aborted if earlier pollinated flowers set fruit.
Cranberry fruit data from four Newfoundland cranberry farms in 2014 and 2015, with and without pollinator access. A, Mean fruit set (proportion of flowers in a group that produced fruit) in 2014; B, mean fruit set in 2015; C, fruit weight (g) in 2014; D, fruit weight in 2015. Mean ± 1 standard error.
Bee species richness and abundance
There were 18 taxa collected across all farms and years, consisting of seven Bombus species, three species of subgenus Psithyrus, which is a cleptoparasite of Bombus, and eight non-Bombus genera (Supplementary Table S1). By far the most abundant species collected was B. ternarius Say. Six other taxa were represented by ≥ 30 specimens; two of these (Lasioglossum Curtis (Hymenoptera: Halictidae) and Nomada Scopoli (Hymenoptera: Apidae)) were only identified to genus, and undoubtedly represent a number of species. There were 78 B. impatiens collected, all but one in 2015. This species was present on a single farm in commercially reared colonies, which were used despite the import restriction. In 2014, the colonies had clearly been used elsewhere and were at the end of the colony cycle; few foragers were seen, and when one quad was accidentally kicked, there was no response from any of the four nests. The 2015 colonies were more vigorous; foragers were frequently observed, and this was reflected in the higher pan trap captures. The other three common species, in order of descending abundance, were Bombus borealis Kirby, Bombus vagans bolsteri Smith, and Bombus terricola Kirby.
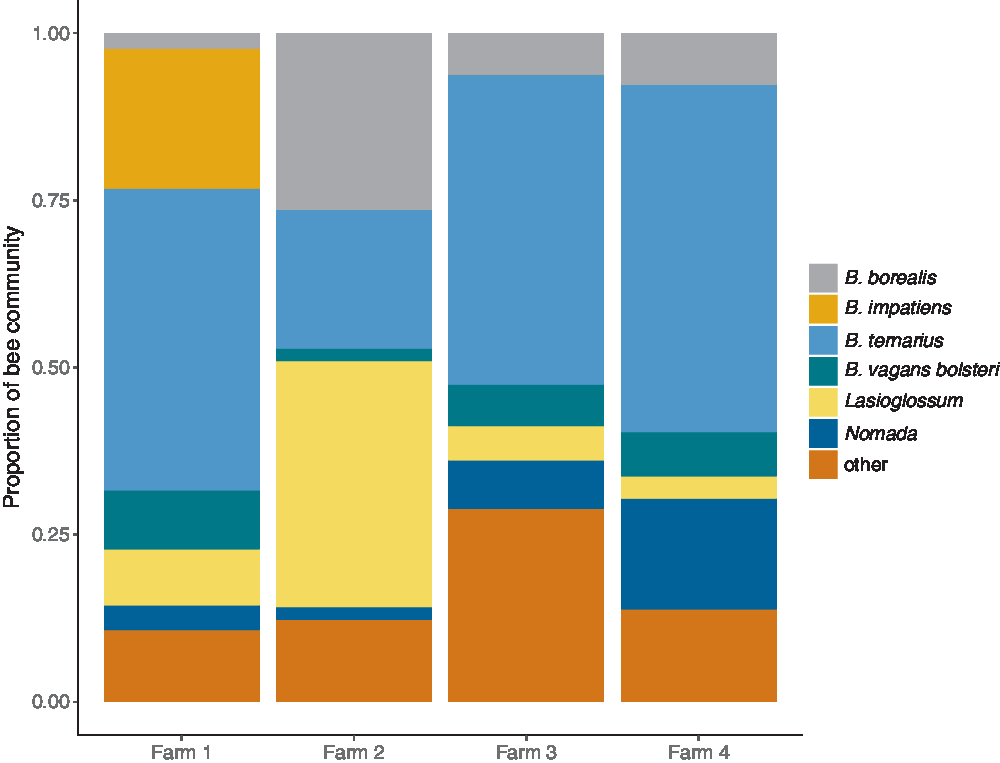
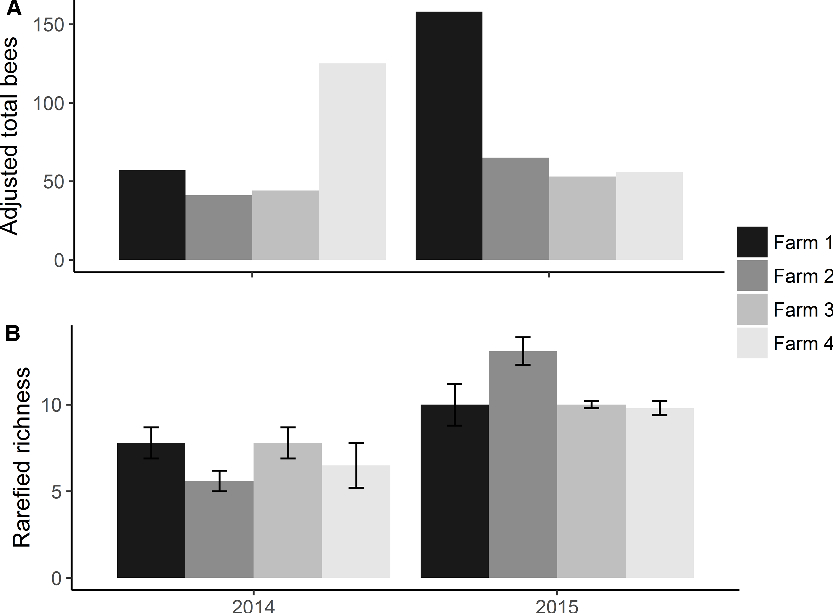
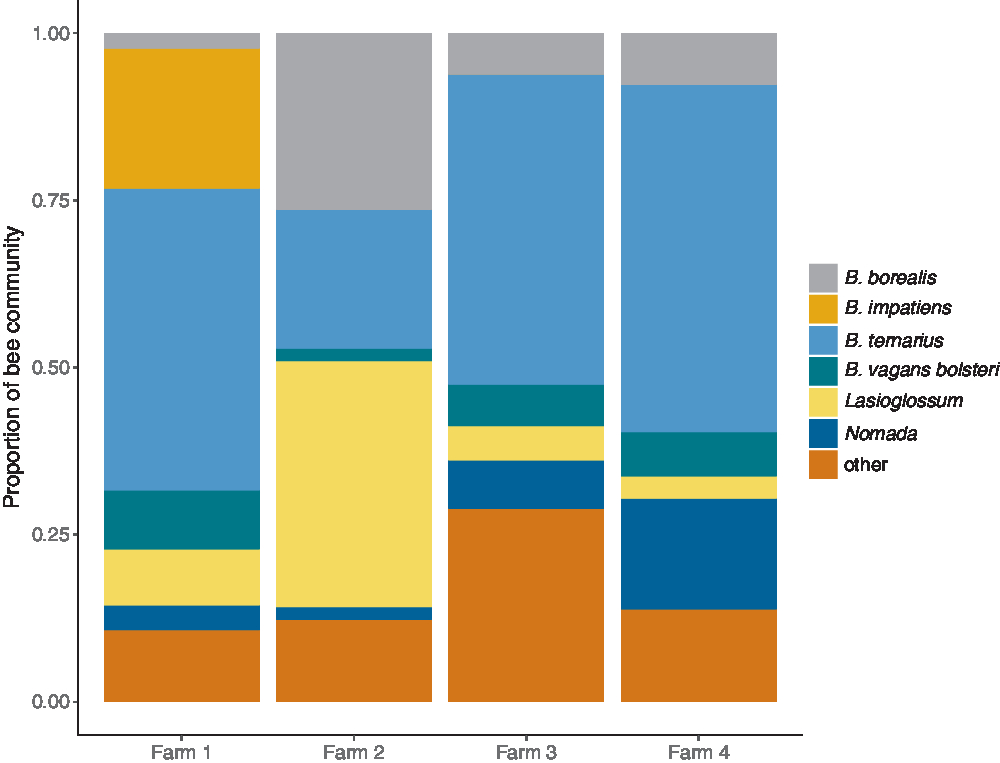
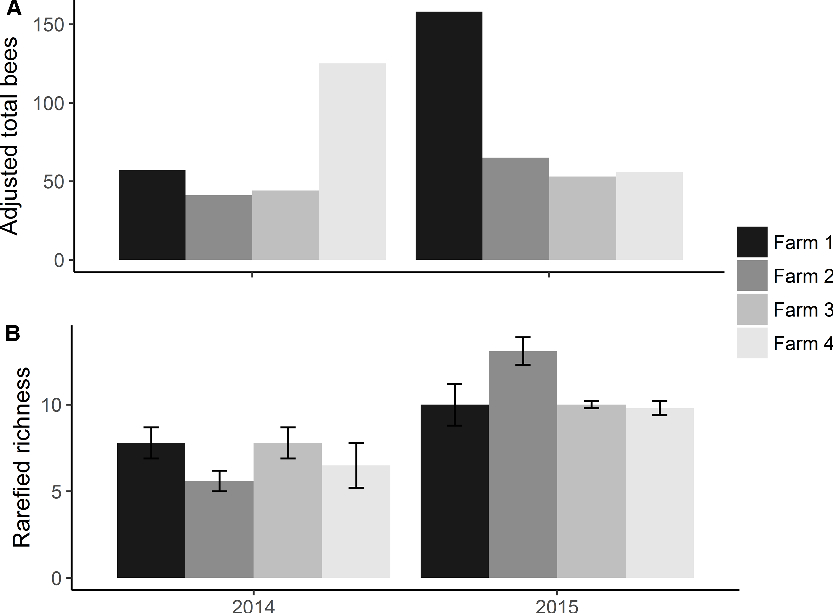
Community composition was similar among farms, except for Farm 2, which had fewer B. ternarius and more B. borealis and Lasioglossum species (Fig. 2). Rarefied taxonomic richness (± standard error) was lower in 2014 (5.59 ± 0.58 – 7.85 ± 0.87) than in 2015 (9.84 ± 0.38 – 13.13 ± 0.83), and total bee abundance was higher in 2015 (Fig. 3). Bombus species made up 49–85% of the bee community and were clearly the dominant pollinator. Analyses using Bombus abundance gave essentially the same results as total abundance; thus, relationships with Bombus, excluding subgenus Psithyrus, are reported here.
Species composition of the bee fauna on four commercial cranberry farms in western (Farms 1 and 2) and central (Farms 3 and 4) Newfoundland. For clarity, all taxa for which there were < 30 individuals collected across all farms and both years are displayed as “other.”
Bee abundance on four Newfoundland cranberry farms in 2014 and 2015. A, Adjusted to 500 trap days; B, taxonomic richness ± 1 standard error.
Forage availability
Crop beds were chosen to be of similar age and plant density, but coverage of forage plants on berms differed among farms. The cover of forage plants in belt transects was between 1.4 ± 0.3% and 50.4 ± 11.9% (mean ± 1 standard error) in 2015 (Table 1B), with the remainder mostly made up of bare ground. There was no relationship with Bombus abundance (F 1,2 = 2.043, P = 0.289) or taxonomic richness (F 1,2 = 0.076, P = 0.809).
Major pollinators
Sweep net sampling and observations of foraging bees identified a similar suite of dominant species as was found in the pan traps. Sweep net sampling over five days in 2015 yielded 54 bees in total, consisting of 36 B. ternarius, seven B. terricola, six B. vagans bolsteri, two B. impatiens, one B. borealis, and two Megachile Latreille (Hymenoptera: Megachilidae). During observations of foraging bees, there were 22 visits recorded by B. ternarius, 18 by B. terricola, 10 by B. vagans bolsteri, and 15 by various non-Bombus taxa such as Andrena Fabricius (Hymenoptera: Andrenidae) and Megachile species. On average, B. terricola individuals visited 37 flowers before leaving the quadrat, while B. ternarius visited an average of nine flowers. Andrena species visited 12 and B. vagans bolsteri visited 10 flowers per foraging bout, while the remaining non-Bombus taxa visited fewer than three flowers prior to leaving the quadrat. Considering both abundance and flower visits, Bombus species clearly dominate the pollinator communities on these farms.
Stigma loading
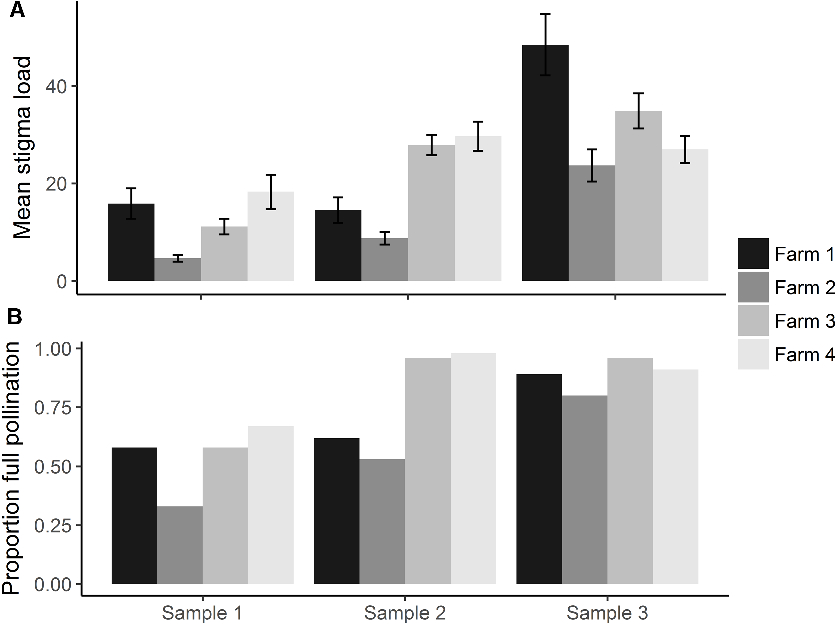
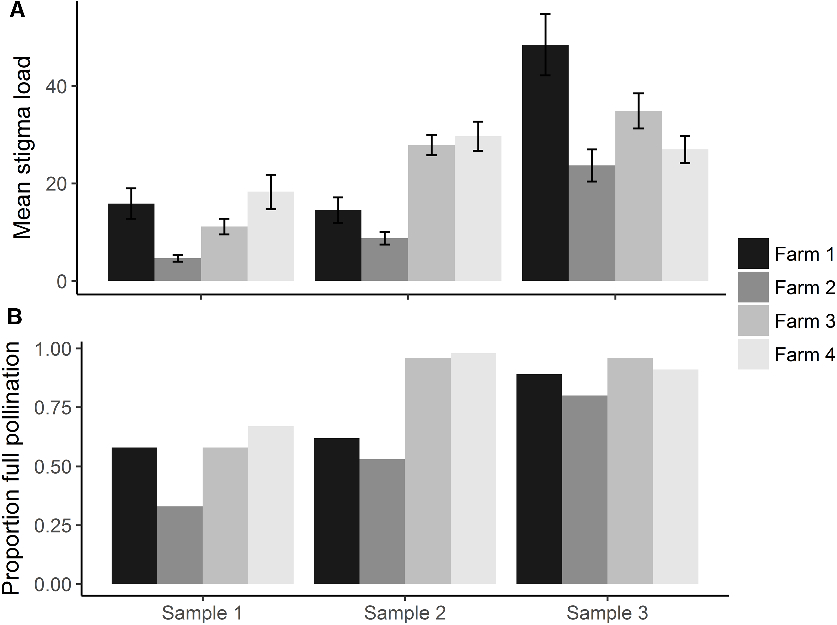
The average stigma load increased across the three sampling occasions. The proportion of stigmas receiving ≥ 8 tetrads increased over the season, with over 80% of stigmas being fully pollinated by the late bloom period (Fig. 4).
Stigma data from June, July, and August 2015. A, Mean stigma load ± 1 standard error; B, proportion of stigmas receiving ≥ 8 tetrads, i.e., fully pollinated.
Fruit yield predictors
Pan traps, sweep nets, and direct observations indicated that Bombus species, particularly B. ternarius, B. borealis, and B. terricola, were the dominant pollinators (see Major pollinators, above). Abundance was unrelated to the availability of forage plants (see Forage availability, above), suggesting that the pan trap captures were reflective of relative abundances among farms. Analyses were conducted using abundances based on pan traps for total Bombus, omitting the subgenus Psithyrus.
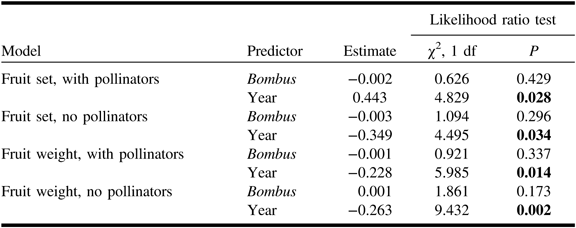
Likelihood ratio tests found no significant relationships between Bombus abundance and fruit set or weight (0.626 < χ 2 (1) < 1.861, 0.173 < P < 0.429; Table 2). Nor was there a relationship between fruit set and stigma loading at any time period, measured either as average number of tetrads per stigma (0.415 < F 1,2 < 0.803, 0.586 < P < 0.866) or the proportion of stigmas with ≥ 8 tetrads (0.037 < F 1,2 < 0.610, 0.516 < P < 0.866). Stigma load was also unrelated to Bombus abundance: average number of tetrads per stigma 0.245 < F 1,2 < 10.39, 0.084 < P < 0.67; proportion of stigmas with ≥ 8 tetrads 0.003 < F 1,2 < 0.378, 0.601 < P < 0.960.
Parameter estimates from general linear mixed models of fruit set and weight, with and without pollinator access, as a function of Bombus abundance (excluding subgenus Psithyrus) and sampling year, with farm as a random effect.
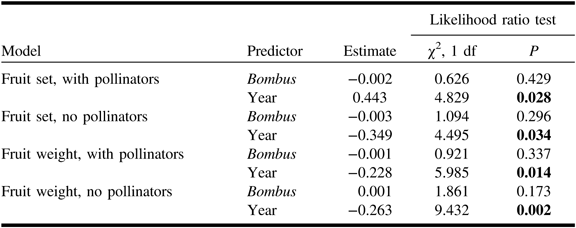
Significance of fixed effects assessed using a likelihood ratio test; P < 0.05 shown in bold.
Discussion
Contrary to expectation, there was no relationship between Bombus abundance and either the proportion of flowers setting fruit or the mean weight of individual fruit. Instead, there was significant variation between years. Fruit set in the absence of pollinators and fruit weight both with and without pollinators were all lower in 2015, while fruit set with pollinators was higher in 2015. This suggests that growing conditions were poorer in 2015, and the presence of bees compensated for those conditions in terms of fruit set but not weight. Other studies have found a relationship between bee abundance and yield (Evans and Spivak Reference Evans and Spivak2006; Ratti et al. Reference Ratti, Higo, Griswold and Winston2008); thus, it is likely that bee abundances exceeded some minimum threshold for full pollination on all of the farms in this study.
Another measure of pollinator effectiveness is stigmatic pollen load, which was measured in 2015. There was no significant relationship between fruit set and either average stigma load or the proportion of flowers receiving ≥ 8 tetrads on any of the three sampling occasions. That stigma loading is unrelated to fruit set or weight suggests that the plants are limited by factors other than pollination. The farms differ in management, although these all apply fertiliser, fungicide, and other treatments, as necessary, as commercial operations. The farms also had different microclimates. For example, Farm 4 was particularly windy, while Farm 2 was sheltered from most wind directions. Detailed weather observations were not available for the study areas, but weather conditions do have the potential to affect both bee activity and flower opening and thus fruit yield (Eaton and Murray Reference Eaton and Murray1997; Tuell and Isaacs Reference Tuell and Isaacs2010).
Other studies have demonstrated increases in cranberry yield as a result of pollinator abundance. On cranberry farms in British Columbia, Canada, higher fruit weight was associated with greater Bombus abundance as measured in pan traps, but similar to this study, per cent berry yield was not (Ratti et al. Reference Ratti, Higo, Griswold and Winston2008). On Wisconsin cranberry farms, both managed honey bees and wild bees, which included Bombus, contributed to pollination and fruit size (Evans and Spivak Reference Evans and Spivak2006), although increased honey bee abundance by itself was not sufficient to increase yield. Another study in Wisconsin (Gaines-Day and Gratton Reference Gaines-Day and Gratton2015) identified significant yield contributions by mechanical agitation such as wind and non-bee insects, most likely thrips (Thysanoptera). Other studies of the pollinators of commercial cranberry have not directly measured their impact on yield, instead focussed on their behaviour (e.g., MacKenzie Reference MacKenzie1994) or indirect measures of pollination ability, such as the pollen load carried by bees (e.g., Broussard et al. Reference Broussard, Rao and Stephen2011).
Studies in other cultivated Vaccinium Linnaeus species, which also require buzz pollination, have demonstrated benefits of increased pollinator abundance, measured in various ways. For example, fruit set, fruit weight, and the number of seeds per berry were increased by plantings of wildflowers adjacent to highbush blueberry (Vaccinium corymbosum Linnaeus) in Michigan, United States of America (Blaauw and Isaacs Reference Blaauw and Isaacs2014), and pollination deficits were reduced by increased bumble bee visits in lowbush blueberry (Vaccinium angustifolium Aiton) crops in British Columbia (Button and Elle Reference Button and Elle2014). However, previous work in lowbush blueberry in Newfoundland found no benefit of supplementation with either honey bees or B. impatiens (Hicks Reference Hicks2011).
The variability between the two years of sampling in this study suggests that factors other than pollination may be more important in determining crop yield in this system. Two studies in the related lowbush blueberry demonstrate this possibility. A study in New Brunswick, Canada, over two years in 48 commercial blueberry fields found year-to-year variation in the effect of supplemental pollination (Fulton et al. Reference Fulton, Jesson, Bobiwash and Schoen2015). Stigmatic pollen loads were higher with managed pollinators in one year, but not another, and seed set was increased, decreased, or unchanged, depending on the year and supplemental pollinator used. These suggest that other factors such as inbreeding depression or plant nutrition were more important in determining fruit yield. Similarly, a manipulative experiment on lowbush blueberry in Nova Scotia, Canada, crossing different levels of pollination with disease and pest management showed that increased yield was only possible with full pollination in combination with intensive crop management (Melathopoulos et al. Reference Melathopoulos, Tyedmers and Cutler2014).
The physical scale of the farms in this study may mean that pollinator services are unlikely to be limiting. As a relatively new industry in an area of low agricultural intensity, these farms have greater access by native pollinators than cranberry farms in other areas where the farms are larger or embedded in a matrix of intensive agriculture. Although the farms differed in total area and bed dimensions, they all were surrounded by natural habitat consisting mostly of forest and bog with smaller amounts of semi-natural habitats such as roadsides. Even the most heavily managed farms included areas of native vegetation, much of which included typical bog plants on which bees forage, such as rhodora (Rhododendron canadensis Linnaeus (Ericaceae)) and bog laurel (Kalmia polifolia Wangenheim (Ericaceae)). More disturbed areas had later-blooming forage plants such as goldenrods (Solidago Linnaeus (Asteraceae)) and fireweed (Chamerion angustifolium (Linnaeus) Holub (Onagraceae)). These plants are favoured by native bees, particularly Bombus (McCallum and McLean Reference McCallum and McLean2017); thus, all farms had forage available throughout the bee flight season.
Vaccinium crops grown at a larger scale or in areas with more agriculture often show signs of pollinator limitation. For example, in blueberry crops in Michigan that were stocked with honey bees, native bees provided 82% of pollination services in small fields, but only 12% in larger ones (Isaacs and Kirk Reference Isaacs and Kirk2010). Similarly, honey bees increased cranberry yield on Wisconsin farms, but only in landscapes with little woodland (Gaines-Day and Gratton Reference Gaines-Day and Gratton2015), which likely support fewer native bees. By contrast, lowbush blueberry in Newfoundland, which is cultivated at a similar scale to cranberry, did not benefit from the presence of supplemental pollinators (Hicks Reference Hicks2011). The farms studied here are relatively small and embedded in natural to semi-natural landscapes; thus, it seems likely that native bees are abundant enough to provide for the pollination needs of the crop. The cranberry flowers appeared to be receiving adequate pollen; by the end of the 2015 bloom period, 80–96% of stigmas examined had at least eight tetrads, the minimum required for full pollination. Nor was stigma load related to Bombus abundance, which suggests that abundance was high enough to provide full pollination on all farms.
One goal of this research was to identify key pollinators. While the concerns regarding the accuracy of pan trapping (Cane et al. Reference Cane, Minckley and Kervin2000) must be kept in mind, sweep netting and observations of foraging bees both supported the conclusion that Bombus species are the major pollinators in this crop. The lack of relationship between non-crop forage plant density and Bombus abundance suggests that floral density did not significantly skew the pan trap catches, and, perhaps of more importance to growers, having flowering plants close to the field did not draw pollinators out of the crop. The most abundant bee collected on most farms was B. ternarius. As the most common bee, it is likely to have been responsible for a large share of pollination in these crops. It is a member of subgenus Pyrobombus Dalla Torre, which are short-tongued to medium-tongued bees that are more likely to visit flowers such as cranberry that require them to hang upside down (P. Williams, personal communication). The importance of pollination by non-Bombus visitors is unknown. Previous work on Farms 1 and 2 (Hicks and Sircom Reference Hicks and Sircom2016) found that visits by Halictidae resulted in similar fruit set but smaller fruit, but further study is needed to understand the contribution of these smaller taxa.
The other goal of this study was to determine whether variation in native bee abundance was related to differences in yield. Growers could then implement simple, low-cost means to increase crop yield by enhancing native bee abundance on their farms. This was based on the widely held belief among growers that the primary limiting factor to increasing yield is pollination. This appears not to be the case. On these farms, there was sufficient pollen delivered by native bees to support the maximum yield possible, given the crop management practices or local conditions. Further research is necessary to determine whether the plants are limited by factors that are largely out of the control of the growers, such as temperature, or by management practices such as fertiliser application or disease control. Once the other limiting factors are identified and remediated, pollinator limitations may come into play, but at present, pollination is not limiting cranberry yield in Newfoundland.
Supplementary material
To view supplementary material for this article, please visit https://doi.org/10.4039/tce.2019.54.
Acknowledgements
This work was funded by an Ignite grant from the Research and Development Corporation of Newfoundland and Labrador to J.S. We acknowledge support from the Memorial University of Newfoundland School of Graduate Studies to G.A.J., and field and laboratory assistance from Tiffany Fillier, Jasmine Pinksen, and Erika Young.