Introduction
The Paris Biota is an exceptional early Spathian (Early Triassic) marine assemblage (Brayard et al., Reference Brayard, Krumenacker, Botting, Jenks, Bylund, Fara, Vennin, Olivier, Goudemand, Saucède, Charbonnier, Romano, Doguzhaeva, Thuy, Hautmann, Stephen, Thomazo and Escarguel2017) discovered in the Thaynes Group (sensu Lucas et al., Reference Lucas, Krainer, Milner, Lucas and Spielmann2007) within the northern and western parts of the western USA basin (Smith et al., Reference Smith, Laville, Fara, Escarguel, Olivier, Vennin, Goudemand, Bylund, Jenks, Stephen, Hautmann, Charbonnier, Krumenacker and Brayard2021). It appears to be the oldest-known diversified and complex Triassic marine assemblage following the Permian/Triassic boundary (PTB; ca. 252 Ma). Dated from immediately after the Smithian/Spathian boundary (ca. 249.2 Ma; Widmann et al., Reference Widmann, Bucher, Leu, Vennemann, Bagherpour, Schneebeli-Hermann, Goudemand and Schaltegger2020), it challenges the often assumed scenario of a globally delayed and slow post-PTB marine biotic recovery (e.g., Erwin, Reference Erwin1998; Sahney and Benton, Reference Sahney and Benton2008; Song et al., Reference Song, Wignall, Chen, Tong, Bond, Lai, Zhao, Jiang, Yan, Niu, Chen, Yang and Wang2011, Reference Song, Wignall and Dunhill2018; Chen and Benton, Reference Chen and Benton2012; Benton et al., Reference Benton, Zhang, Hu, Chen, Wen, Liu, Huang, Zhou, Xie, Tong and Choo2013). This assemblage is all the more remarkable because the Smithian-Spathian transition corresponds to the most severe environmental perturbations documented for the Early Triassic (Tozer, Reference Tozer1982; Dagys, Reference Dagys, Wiedmann and Kullmann1988; Hallam, Reference Hallam and Walliser1996; Payne, Reference Payne, Lehrmann, Wei, Orchard, Schrag and Knoll2004; Brayard et al., Reference Brayard, Bucher, Escarguel, Fluteau, Bourquin and Galfetti2006; Romano et al., Reference Romano, Goudemand, Vennemann, Ware, Schneebeli-Hermann, Hochuli, Brühwiler, Brinkmann and Bucher2013; Jattiot et al., Reference Jattiot, Bucher, Brayard, Monnet, Jenks and Hautmann2016; Goudemand et al., Reference Goudemand, Romano, Leu, Bucher, Trotter and Williams2019; Leu et al., Reference Leu, Bucher and Goudemand2019). The Paris Biota offers a unique opportunity to study one of the most important faunal shifts known: the transition between the Paleozoic and the Modern evolutionary faunas, which is assumed to have happened around the PTB (Sepkoski, Reference Sepkoski1981). The Paris Biota is composed of a mixture of long-term survivors and newly evolved taxa. It comprises almost all the clades of the Modern evolutionary fauna. It yielded algae, sponges (Botting et al., Reference Botting and Brayard2019), brachiopods, bivalves, echinoderms (Saucède et al., Reference Saucède, Vennin, Fara and Olivier2019; Thuy et al., Reference Thuy and Escarguel2019), cephalopods (Doguzhaeva et al., Reference Doguzhaeva, Brayard, Goudemand, Krumenacker, Jenk, Bylund, Fara, Olivier, Escarguel and Vennin2018; Brayard et al., Reference Brayard, Jenks and Bylund2019), vertebrate remains and coprolites (Romano et al., Reference Romano, Argyriou and Krumenacker2019), and arthropods (Lerner et al., Reference Lerner, Lucas and Lockley2017; Charbonnier et al., Reference Charbonnier and Brayard2019; Laville et al., Reference Laville, Smith, Forel, Brayard and Charbonnier2021). Among arthropods, many well-preserved decapods (an order of crustaceans characterized, among others, by the presence of 5 pairs of walking appendages) were uncovered. This is of major importance because they represent some of the earliest representatives of their order.
Only three decapod taxa have been reported so far from the Paleozoic: (1) Aciculopoda mapesi Feldmann and Schweitzer, Reference Feldmann and Schweitzer2010, which was described based on a unique specimen from southcentral Oklahoma, USA, and is the only known Paleozoic Dendobranchiata (Feldmann and Schweitzer, Reference Feldmann and Schweitzer2010); (2) Palaeopalaemon newberryi (Whitfield, Reference Whitfield1880), also from the Late Devonian of northeast Ohio, south New York State, central Kentucky, and southeast Iowa, USA, and corresponds to the oldest Pleocyemata documented (Schram et al., Reference Schram, Feldmann and Copeland1978); and (3) Eryma antiquum (Birshtein, Reference Birshtein1958), from the late Permian of Ukhta region, Siberia (Schram, Reference Schram1980), which is the oldest Erymidae reported, but whose systematic position above the superfamily rank remains uncertain (Devillez and Charbonnier, Reference Devillez and Charbonnier2017).
The Early Triassic fossil record of decapods is also very scarce. It is limited to an isolated specimen reported from the early Spathian at Bear Lake Hot Springs, Idaho, USA, designated by Schram (Reference Schram1971) as Litogaster turnbullensis, and the poorly age-constrained Dienerian–Smithian decapod-rich fossil sites from the Ambilobé region, NW Madagascar (Besairie, Reference Besairie1932; Marramà et al., Reference Marramà, Lombardo, Tintori and Carnevale2017; Laville et al., Reference Laville, Smith, Forel, Brayard and Charbonnier2021), that yield three species of Penaeoidea: Ifasya madagascariensis (Van Straelen, Reference Van Straelen1933), Ifasya straeleni Garassino and Teruzzi, Reference Garassino and Teruzzi1995, and Ambilobeia karojoi Garassino and Pasini, Reference Garassino and Pasini2002.
The Paris Biota decapod fauna includes two genera of Aegeridae, which is a family regarded as a potential stem-group of Penaeoidea (Burkenroad, Reference Burkenroad1963, Reference Burkenroad and Schram1983; Tavares and Martin, Reference Tavares, Martin, Schram and von Vaupel Klein2010) i.e., the oldest of the two Dendobranchiata superfamilies, the other one being Sergestoidea whose oldest representative is Paleomattea deliciosa Maisey and Carvalho, Reference Maisey and de Carvalho1995, from the Early Cretaceous of the Santana Formation, Brazil. It also includes representatives of two superfamilies of Glypheida (Pleocyemata), extending for one, and confirming for the other, their temporal range back to the Early Triassic. These new findings significantly increase the current knowledge of Early Triassic decapods by doubling the number of known taxa (from 3 to 6 species) for this interval. Additionally, we discuss in this work all known Triassic decapods, with a special emphasis on Dendobranchiata, as well as their taxonomic assignments. This leads to the revision of four species of Middle and Late Triassic Aegeridae, and to a revised family assignment of a Middle Triassic Glypheida. Based on this revised dataset of Triassic decapods, we investigate their early diversification after the PTB mass extinction. We further discuss our observations with regards to the ongoing debate of the accuracy and reliability of macroevolutionary signals derived from current online databases, especially concerning the post-PTB biotic recovery.
Geological setting
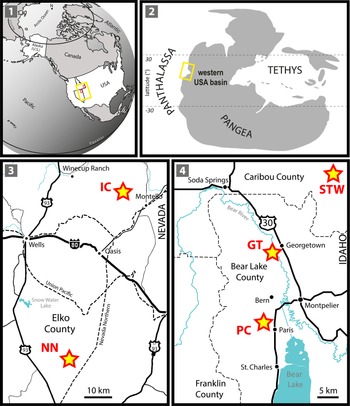
The Paris Biota has been documented in five different sites (Brayard et al., Reference Brayard, Krumenacker, Botting, Jenks, Bylund, Fara, Vennin, Olivier, Goudemand, Saucède, Charbonnier, Romano, Doguzhaeva, Thuy, Hautmann, Stephen, Thomazo and Escarguel2017; Smith et al., Reference Smith, Laville, Fara, Escarguel, Olivier, Vennin, Goudemand, Bylund, Jenks, Stephen, Hautmann, Charbonnier, Krumenacker and Brayard2021), all from the northern and western parts of the western USA basin (Fig.1). Two of these sites (NoName and Immigrant Canyon) are located in northeastern Nevada; the three others (Paris Canyon, Stewart Canyon, and Georgetown) are located in southeastern Idaho. At each site, fossils were collected from exposures of the Lower Triassic Thaynes Group (sensu Lucas et al., Reference Lucas, Krainer, Milner, Lucas and Spielmann2007), which is mainly characterized by alternating limestones and shales of Smithian–Spathian age, corresponding to relatively shallow, epicontinental marine depositional environments (e.g., Caravaca et al., Reference Caravaca, Brayard, Vennin, Guiraud, Le Pourhiet, Grosjean, Thomazo, Olivier, Fara, Escarguel, Bylund, Jenks and Stephen2018). During the Early Triassic, the western USA Basin was located at a near-equatorial latitude on the western margin of the Pangea (i.e., the eastern coast of the Panthalassa Ocean; Fig.1.2). Biostratigraphy in the region is well constrained by Smithian and Spathian ammonoid assemblages that recently have been partly revised within southeastern Idaho (Guex et al., Reference Guex, Hungerbühler, O'Dogherty, Atudorei, Taylor, Bucher and Bartolini2010; Jenks et al., Reference Jenks, Guex, Hungerbühler, Taylor, Bucher, Tanner, Spielmann and Lucas2013; Brayard et al., Reference Brayard, Jenks and Bylund2019). With the exception of those of the Immigrant Canyon site (Smith et al., Reference Smith, Laville, Fara, Escarguel, Olivier, Vennin, Goudemand, Bylund, Jenks, Stephen, Hautmann, Charbonnier, Krumenacker and Brayard2021), all decapod specimens were collected from early Spathian beds, corresponding to the Bajarunia-Tirolites-Albanites beds (Brayard et al., Reference Brayard, Jenks and Bylund2019). Immigrant Canyon fossils are from slightly younger fossiliferous levels belonging to the Prohungarites and Neopopanoceras beds of middle-late Spathian age (Smith et al., Reference Smith, Laville, Fara, Escarguel, Olivier, Vennin, Goudemand, Bylund, Jenks, Stephen, Hautmann, Charbonnier, Krumenacker and Brayard2021).
Location of the sites from which the Paris Biota has been reported. (1) Present-day map; (2) Early Triassic paleogeographic map; (3) simplified map of northeastern Nevada; (4) simplified map of southeastern Idaho. Yellow rectangle indicates the location of the western USA basin. Small red rectangles in (1) indicate the locations of map (3) and (4). Stars indicate the locations of sites from which the Paris Biota has been reported. IC = Immigrant Canyon; NN = NoName; STW = Stewart Canyon; GT = Georgetown; PC = Paris Canyon, original site of the Paris Biota. Maps after Romano et al. (Reference Romano, Kogan, Jenks, Jerjen and Brinkmann2012).

Material and methods
The Paris Canyon locality remains by far the most sampled site from which the Paris Biota has been documented (Smith et al., Reference Smith, Laville, Fara, Escarguel, Olivier, Vennin, Goudemand, Bylund, Jenks, Stephen, Hautmann, Charbonnier, Krumenacker and Brayard2021). Indeed, two thirds of the Paris Biota fossils come from this site. Therefore, most of the decapod specimens studied here are from Paris Canyon. Additionally, the Paris Canyon decapod specimens are slightly better preserved (i.e., more complete) than those from the other sites, and have the advantage of being preserved as calcium phosphate (Iniesto et al., Reference Iniesto, Thomazo and Fara2019), which tends to react well under UV illumination, facilitating anatomical observations. The specimens from Georgetown are also preserved in calcium phosphate, whereas those from NoName, Stewart Canyon, and Immigrant Canyon are carbonaceous.
The systematic work was established based on the best preserved specimens that we refer to as the “illustrated material.” However, other specimens that are referred to as “additional material” were also examined. Several specimens can occur on the same slab, and occasionally accumulate in masses of up to tens of specimens on the same slab. In such cases, the specimen repository numbers end in an additional letter to specify which specimen of the slab is indicated.
Specimens were examined under natural light, and under UV illumination using a Vilber Lourmat VL-115.L lamp with a wavelength of 365 nm in the dark. Photographs were taken using a Nikon D750 camera coupled to a AF-S VR Micro-Nikkor 105mm f/2.8 G IF-E lens. The brightness and contrast of each picture was optimized to highlight some anatomical parts using imageJ 1.52s and the auto “Brightness/Contrast…” tool. Unless specified otherwise, the line drawings were produced by the first author.
Repository and institutional abbreviation
All the studied specimens are held in the collections of the Université de Bourgogne, Géologie Dijon, France (UBGD).
Systematic paleontology
Phylum Arthropoda Latreille, Reference Latreille and Cuvier1829
Subphylum Crustacea Brünnich, Reference Brünnich1772
Class Malacostraca Latreille, Reference Latreille1802
Subclass Eumalacostraca Grobben, Reference Grobben1892
Superorder Eucarida Calman, Reference Calman1904
Order Decapoda Latreille, Reference Latreille1802
Suborder Dendrobranchiata Bate, Reference Bate1888
Superfamily Penaeoidea Rafinesque, Reference Rafinesque1815
Family Aegeridae Burkenroad, Reference Burkenroad1963
Included genera
Aeger Münster, Reference Münster1839; Acanthochirana Strand, Reference Strand1928; Anisaeger Schweitzer et al., Reference Schweitzer, Feldmann, Hu, Huang, Zhou, Zhang, Wen and Xie2014.
Emended diagnosis by Schweitzer et al. (Reference Schweitzer, Feldmann, Hu, Huang, Zhou, Zhang, Wen and Xie2014)
Carapace with long or short rostrum compressed laterally, with one subrostral spine or with several suprarostral and sometimes postrostral spines or no rostral spines at all; hepatic spine present; scaphocerite long; antennular flagellae short or long, basal articles not extending anteriorly more than one-third the length of the carapace; antennar flagellae long; third maxilliped long, usually longer than or as long as pereiopods, with multiple long, thin spines perpendicular to long axis; pereiopods ranging from overall long to overall short; pereiopods 1–3 chelate, may be spinose, 1–3 increasing in length posteriorly; pleonal somite 1 overlapping somite 2, somite 1 shorter than other somites; pleura rounded, may be spined or serrated; pleopods with two multiarticulate flagella each; exopodite of uropod usually with diaeresis; telson with at least one pair of movable spines, may have marginal setae distally.
Remarks
The family Aegeridae was erected by Burkenroad (Reference Burkenroad1963) and initially only included Aeger and Acanthochirana. Nonetheless, until Schweigert (Reference Schweigert2001) revised Aeger tipularius (Schlotheim, Reference Schlotheim1822), the type species of Aeger, and assigned it to Aegeridae, most authors continued to assign Acanthochirana and Aeger to Penaeidae (e.g., Förster, Reference Förster1967a; Glaessner, Reference Glaessner and Moore1969; Förster and Crane, Reference Förster and Crane1984; Garassino and Teruzzi, Reference Garassino and Teruzzi1990). Subsequently, Feldmann et al. (Reference Feldmann, Vega, Martinez-Lopez, González-Rodríguez, González-León and Fernández-Barajas2007) also confirmed the placement of Acanthochirana within Aegeridae as previously suggested by Etter (Reference Etter2004). Finally, Schweitzer et al. (Reference Schweitzer, Feldmann, Hu, Huang, Zhou, Zhang, Wen and Xie2014) added the genera Anisaeger and Distaeger to Aegeridae.
Careful examination of high-resolution pictures (Supplementary file 1; courtesy of Shixue Hu and Carrie Schweitzer) of the holotype of Distaeger prodigiosus (Middle Triassic, China) lead us to modify its placement within Aegeridae. Indeed, the initially described pediform third maxilliped with propodus showing scalloped upper and lower margins is most likely a first pereiopod showing a strong terminal chela with index and dactylus of equal size. Second and third pereiopods are also chelate. The reinterpretation of the hypertrophied third maxilliped as a chelate first pereiopod and the well-developed pereiopods of Distaeger still suggest a placement within Penaeoidea, but in a different family than Aegeridae.
The family Aegeridae has undergone multiple diagnosis modifications during the last two decades, as new species and genera were erected. Given the unclear, yet potentially basal phylogenetic positioning of this family, as suggested by several authors (Burkenroad, Reference Burkenroad1963, Reference Burkenroad and Schram1983; Tavares and Martin, Reference Tavares, Martin, Schram and von Vaupel Klein2010), and being an early member of the Modern Evolutionary Fauna (Sepkoski, Reference Sepkoski1981) following the PTB biotic crisis, it is crucial to correctly define the taxonomical limits of this family. The diagnosis remains too poorly restrictive, considering the important intra-family morphological variability and, in particular, within Aeger. Nonetheless, the main characteristics of Aegeridae, which differentiate them from other penaeoids, are the presence of a very long antennal flagellum, long pereiopods, and a hypertrophied spinose or setose third maxilliped at least as long as the pereiopods.
Genus Acanthochirana Strand, Reference Strand1928
- Reference Oppel1862
Acanthochirus Oppel, p. 97–98.
- Reference Strand1928
Acanthochirana; Strand, p. 40: nomen novum pro Acanthochirus.
Type species
Udora cordata Münster, Reference Münster1839 (part), by subsequent designation of Glaessner (Reference Glaessner and Pompeckj1929).
Other species
Triassic: Acanthochirana norica (Pinna, Reference Pinna1974) new combination; Acanthochirana spinifera (Schweitzer et al., Reference Schweitzer, Feldmann, Hu, Huang, Zhou, Zhang, Wen and Xie2014) new combination; Acanthochirana triassica Garassino et al., Reference Garassino, Schweigert and Muscio2013. Post-Triassic: Acanthochirana angulata (Oppel, Reference Oppel1862); Acanthochirana cordata (Münster, Reference Münster1839) (junior synonym: Acanthochirus longipes Oppel, Reference Oppel1862); Acanthochirana krausei (Förster, Reference Förster1967b); Acanthochirana liburiaensis Garassino et al. in Bravi et al., Reference Bravi, Garassino, Bartiromo, Audo, Charbonnier, Schweigert, Thévenard and Longobardi2014; Acanthochirana smithwoodwardi (Van Straelen, Reference Van Straelen1940) (junior synonym: Acanthochirus cenomanicus Glaessner, Reference Glaessner1945).
Emended diagnosis by Charbonnier et al. (Reference Charbonnier, Audo, Garassino and Hyžný2017)
Rostral carina with spines pointing forward; smooth rostrum, spineless; one epigastric spine in the third anterior of dorsal margin; weak cervical groove, not joined to dorsal margin; oblique branchiocardiac groove joined to hepatic groove at level of strong hepatic spine; short hepatic groove backward directed; cephalic region with postorbital spine; hypertrophied Mxp3 with rows of movable spines; branch-like Mxp3 dactylus; chelate P1–P3; achelate P4–P5; uropodal exopod without diaeresis.
Remarks
Acanthochirana is placed within Aegeridae based on the presence of a hepatic spine, a hypertrophied Mxp3 with rows of movable spines, and chelate P1–P3. Additionally, Acanthochirana exhibits a cervical, a branchiocardiac, and a hepatic groove. It also has a long scaphocerite and very long antennal flagellum, which are common features in Aegeridae. Acanthochirana can be distinguished from other Aegeridae based on its characteristic rostrum, usually moderately long, that presents multiple basal dorsal teeth. This genus also exhibits a distinctive spinose Mxp3 that is hypertrophied, but just moderately longer than the pereiopods, and with a branch-like dactylus, unlike that of Aeger, which is considerably longer than the pereiopods, or that of Anisaeger, which has an acuminate (brush-tip shaped) dactylus and is not (or only very thinly) setose. When identifiable, Acanthochirana carapace grooves are also discriminant.
Acanthochirana norica (Pinna, Reference Pinna1974) new combination
- Reference Pinna1974
Antrimpos noricus Pinna, p. 14, pl. 2–11, figs. 4–8.
- Reference Pinna1976
Antrimpos noricus; Pinna, p. 34, pl. 1, figs.1, 2; pl. 3, fig.2.
- Reference Dalla Vecchia1990
Antrimpos sp; Dalla Vecchia, p. 131, photo 37.
- Reference Dalla Vecchia1991
Antrimpos sp; Dalla Vecchia, p. 26.
- Reference Garassino, Teruzzi and Dalla Vecchia1996
Antrimpos noricus; Garassino et al., p. 30.
Holotype
Almost complete individual (n° 3380) from the Zambelli Rocco collection reposited at the Museo civico di Scienze Naturali di Bergamo, Italy. The specimen was collected near the village of Cene (Val Seriana, Bergamo, Italy) in the Norian Zorzino Limestone Formation (Pinna, Reference Pinna1974).
Original diagnosis by Pinna (Reference Pinna1974; translated from Italian and simplified based on description of the holotype)
Rather elongated rostrum with two suprarostral teeth and no infrarostral teeth; antennal angle rather acute, bearing an antennal spine; presence of supraorbital and hepatic spines; a gastro-frontal groove from which a gastro-orbital groove departs dorsoventrally towards the hepatic spine; and an hepatic groove under the hepatic spine and that bends forward and downwards towards the pterygostomial angle; antennae very robust; antennal flagella very long; scaphocerite well developed; Mxp3 well developed with propodus, carpus, and merus carrying two rows of dense and robust spines along their anterior and posterior margin; P1–P3 chelate; P4–P5 achelate; s1–s3 increasing in length with rounded pleura; s4–s5 axially keeled; s6 elongated, longer than high; pl1–pl5 of considerable size; pl1 often transformed in petasma; pl2–pl5 composed of subrectangular basipodite that bear two very long flagella; telson triangular; uropod rounded; uropodal endopod slightly longer than exopod, both far exceeding length of telson.
Emended diagnosis by Pinna (Reference Pinna1976; translated from Italian; partial modification of original diagnosis following discovery of additional, better-preserved specimens)
The posterior margin of the carapace is slightly more sinuous than previously reconstructed because the lower part projects more markedly backwards; the rostrum also possesses a series of suprarostral teeth arranged along the entire central portion of the rostrum, and a well-developed infrarostral tooth in the apical position, additionally to the two proximal suprarostral teeth previously recognized. The uropodal exopod is much longer than the endopod and presents a diaeresis.
Remarks
Antrimpos noricus was first described by Pinna (Reference Pinna1974) based on 149 specimens from the Norian (Upper Triassic) of Cene (Lombardy, Italy). Pinna (Reference Pinna1974) provided a thorough study, including a full description of the holotype, a reconstruction of the species, and a discussion on its ontogenetic variations and its exuvia. Later, Pinna (Reference Pinna1976) described 34 specimens from the Norian (Upper Triassic) of Valvestino, a neighboring locality in Lombardy. Despite the presence of new characters (i.e., posterior margin of the carapace slightly more sinuous, additional suprarostral teeth and well-developed infrarostal teeth, uropodal exopod much longer than endopod, uropodal exopod with diaeresis), Pinna (Reference Pinna1976) ascribed these specimens to Antrimpos noricus, considering that observed differences between the Cene and the Valvestino specimens were of taphonomic origin, the Valvestino specimens being better preserved. Garassino et al. (Reference Garassino, Teruzzi and Dalla Vecchia1996) later described nine specimens from Rio Seazza (Preone, Italy), one specimen from Caprizzi (Socchieve, Italy), and one specimen from Forni di Sopra (Udine, Italy), all Norian in age. Based on the similarities between these specimens and the specimens from Valvestino, they ascribed them to Antrimpos noricus. However, Garassino et al. (Reference Garassino, Teruzzi and Dalla Vecchia1996) raised the hypothesis of the existence of two distinct taxa. Unfortunately, the illustrations provided by Pinna (Reference Pinna1974, Reference Pinna1976) and Garassino et al. (Reference Garassino, Teruzzi and Dalla Vecchia1996) are not sufficient to clarify this matter. However, they are sufficient to identify a well-developed scaphocerite, a very long antennal flagellum, a well-developed spinose Mxp3, and chelate P1–P3 increasing in length posteriorly. These characters are diagnostic of Aegeridae and therefore we proposed to assign Antrimpos noricus to this family. Additionally, based on the holotype and its associated original description, Antrimpos noricus has a moderately long rostrum with basal infrarostral teeth, a short hepatic groove, a hepatic spine, a postorbital spine (initially interpreted as supraorbital spine), a short cervical groove (initially interpreted as gastro-orbital groove), and a Mxp3 spinose and rather robust that is about as long as the pereiopods. These features are typical of Acanthochirana, supporting the new combination Acanthochirana norica (Pinna, Reference Pinna1974). This taxon is easily distinguished from other Acanthochirana species because it is the only known member of its genus to have two basal suprarostal teeth and an antennal spine.
Acanthochirana spinifera (Schweitzer et al., Reference Schweitzer, Feldmann, Hu, Huang, Zhou, Zhang, Wen and Xie2014) new combination
Reference Schweitzer, Feldmann, Hu, Huang, Zhou, Zhang, Wen and Xie2014 Anisaeger spiniferus Schweitzer et al., p. 464, figs. 8, 9.
Holotype
Complete specimen (LPI-40455) from the Anisian Luoping Biota, Yunnan Province, China; reposited at the Chengdu Institute of Geology and Mineral Resources, Chengdu, Sichuan Province, China.
Original diagnosis by Schweitzer et al. (Reference Schweitzer, Feldmann, Hu, Huang, Zhou, Zhang, Wen and Xie2014)
Carapace with slender, postorbital spine triangular, hepatic spine needle-like; rostrum elongate bearing three suprarostral and one subrostral spine; pleura smooth, with dorsal keel on somite 6; pleura of somites 4–6 with serrate posterior margins.
Remarks
This species was initially attributed to Anisaeger, which was erected by Schweitzer et al. (Reference Schweitzer, Feldmann, Hu, Huang, Zhou, Zhang, Wen and Xie2014) based on An. spiniferus and the type species, An. brevirostrus. The main arguments used to erect Anisaeger and to attribute An. spiniferus to it were the sizes of the pereiopods, which were interpreted as distinctively smaller than those found in other genera of Aegeridae, and the only very moderately longer Mxp3 in comparison to the pereiopods. In Aeger, the pereiopods are distinctively long, and the Mxp3 is significantly more developed and longer than them. However, in Acanthochirana the size of the pereiopods and the difference in size between them and the Mxp3 is much lesser, and therefore, similar to that observed in Anisaeger. Such characteristics are therefore no longer sufficient to discriminate Anisaeger.
The postorbital spine of An. spiniferus, and its short cervical groove inclined anteroventrally at ~45° with a hepatic needle-like spine at its base, are shared cephalothoracic features with many Acanthochirana species. Additionally, An. spiniferus has a long rostrum with multiple basal and proximal suprarostral spines and one subrostral spine. The subrostral spine may be interpreted as corresponding to Aeger. However, neither the carapace features, nor the cephalothoracic appendages corroborate such interpretation. In contrast, if not for the subrostral spine, the An. spiniferus rostrum is reminiscent of the rostrum in Acanthochirana.
Based on the shared characters between An. spiniferus and Acanthochirana species, we propose the new combination Acanthochirana spinifera (Schweitzer et al., Reference Schweitzer, Feldmann, Hu, Huang, Zhou, Zhang, Wen and Xie2014). This taxon differs from the other Acanthochirana species by its subrostral spine. It also exhibits a s4–s6 with dorsal margin distinctively serrated and a dorsally keeled s6.
Genus Aeger Münster, Reference Münster1839
- Reference Münster1839
Aeger Münster, p. 64–65.
Type species
Macrourites tipularius Schlotheim, Reference Schlotheim1822, by subsequent designation of Woods (Reference Woods1925).
Other species
Triassic: Aeger gracilis Förster and Crane, Reference Förster and Crane1984; Aeger lehmanni (Langenhan, Reference Langenhan1910); Aeger luxii Huang et al., Reference Huang, Feldmann, Schweitzer, Hu, Zhou, Benton, Zhang, Wen and Xie2013; Aeger straeleni Glaessner, Reference Glaessner1930. Post-Triassic: Aeger brevirostris Van Straelen, Reference Van Straelen1923; Aeger brodiei Woodward, Reference Woodward1888; Aeger elegans Münster, Reference Münster1839; Aeger elongatus Garassino and Teruzzi, Reference Garassino and Teruzzi1990; Aeger foersteri Garassino and Teruzzi, Reference Garassino and Teruzzi1990; Aeger franconicus Förster, Reference Förster1980; Aeger hidalguensis Feldmann et al., Reference Feldmann, Vega, Martinez-Lopez, González-Rodríguez, González-León and Fernández-Barajas2007; Aeger insignis Oppel, Reference Oppel1862; Aeger laevis (Blake, Reference Blake, Tate and Blake1876); Aeger libanensis Roger, Reference Roger1946; Aeger macropus Garassino and Teruzzi, Reference Garassino and Teruzzi1990; Aeger marderi Woodward, Reference Woodward1866; Aeger muensteri Garassino and Teruzzi, Reference Garassino and Teruzzi1990; Aeger robustus Garassino and Teruzzi, Reference Garassino and Teruzzi1990; Aeger rostrospinatus Garassino and Teruzzi, Reference Garassino and Teruzzi1990; Aeger spinipes (Desmarest, Reference Desmarest1817).
Emended diagnosis by Charbonnier et al. (Reference Charbonnier, Audo, Garassino and Hyžný2017).—Rostrum with one infrarostral spine; cervical groove steeply inclined, not joined to the dorsal margin, joined to antennal groove; oblique and sinuous branchiocardiac groove, crossing entire carapace from posterior margin to the hepatic region; convex hepatic groove joined anteriorly to cervical groove and posteriorly to branchiocardiac groove; short inferior groove backward directed, not joined to ventral margin; hypertrophied Mxp3 with rows of movable spines; branch-like Mxp3 dactylus; chelate P1–P3 with chelae bearing movable spines on outer margins; achelate P4–P5, smooth; uropodal exopod with diaeresis.
Remarks
Aeger is by far the most diverse genus in the family Aegeridae (Schweitzer et al., Reference Schweitzer, Feldmann, Garassino, Karasawa and Schweigert2010). It is distinguishable from the other genera of the family by its characteristic third maxillipeds that are distinctively longer than the pereiopods and that bear long movable spines. Additionally, it has a specific rostrum that is variable in length and with variable suprarostral spines, depending on the species, but always with a single infrarostral spine.
Aeger sp.
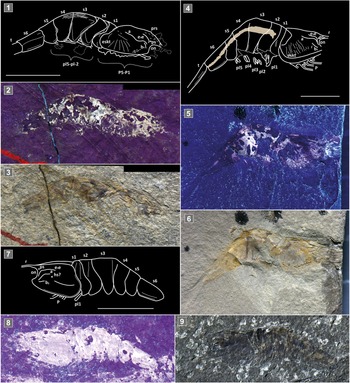
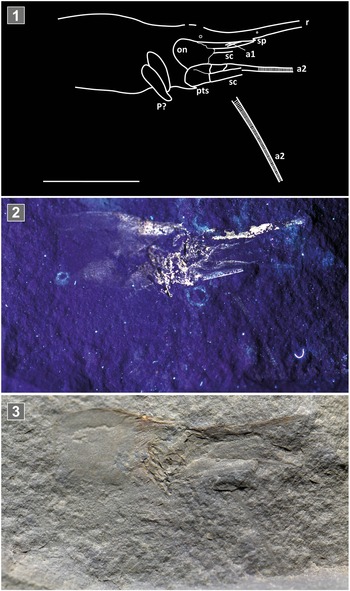
Figures 2, 3
- Reference Brayard, Krumenacker, Botting, Jenks, Bylund, Fara, Vennin, Olivier, Goudemand, Saucède, Charbonnier, Romano, Doguzhaeva, Thuy, Hautmann, Stephen, Thomazo and Escarguel2017
Caridean shrimp; Brayard et al., p. 4, fig. 4.F; fig. 6.D–F; fig. S19.C–I; fig. S20.D.
- Reference Sepkoski2021
Penaeoid shrimp; Smith et al., p. 2, fig. 3B, C.
Aeger sp. (1–3) Right lateral view of specimen UBGD30555a; (4–6) right lateral view of specimen UBGD30558; (7–9) left lateral view of specimen UBGD30553a. (1, 4, 7) Line drawings; (2, 5, 8) under UV illumination; (3, 6, 9) under natural illumination. Abbreviations: a = branchiocardiac groove; b1 = hepatic groove; e1e = cervical groove; eskt = endophragmal skeleton; hs = hepatic spine; on = optical notch; P = pereiopod; pl = pleopod; prs = postrostral spine; ps = postorbital spine; r = rostrum; s = pleonal somite; t = telson. The beige color corresponds to digestive track traces. Scale is 1 cm.

Aeger sp. specimen UBGD294002. (1) Line drawing; (2) under UV illumination; (3) under natural illumination. Abbreviations: a1 = antennula; a2 = antenna; on = optical notch; P = pereiopod; pts = pterygostomial spine; r = rostrum; sc = scaphocerite; sp = subrostral spine. Scale is 1 cm.

Description
Carapace.—Carapace seemingly thin, subtriangular. Posterior margin thinly rimmed and strongly convex posterio-ventrally, covering s1. Dorsal margin straight along the cardiac and gastric regions, and presenting a lump towards the frontal region above the orbital notch that may host a postrostral spine. Straight ventral margin. Anterior margin with a well-pronounced orbital notch, and a distinct antennal notch terminated ventrally by a sharp pterygostomial spine pointing outwards in adult specimens. Rostrum very long and granular, presenting multiple tubercle-like marks, with a single small infrarostral spine. Steeply inclined cervical groove, forming a strong angle half way through, as it starts posteriorly parallel to dorsal margin and ends anteriorly parallel to the orbital notch. Long and sinuous branchiocardiac groove joining cervical groove anteriorly in the antennal region of the carapace. Short hepatic groove steeply inclined in antennal region, not joined to cervical or branchiocardiac groove. Postorbital spine present.
Pleon.—s1–s6 smooth. s1–s3 roughly the same height, although gradually longer posteriorly. s1–s2 with sinuous posterior margins and s2 also with a sinuous anterior margin. Tergopleuron of s2 slightly front-turned. s3 is the highest and longest somite and is subtriangular with a rounded termination. s4–s5 suboval with a rounded termination, higher than long, and of the same length although s4 is higher than s5. s4–s5 anterior margin slightly convex with posterior margin slightly concave and presenting an axial notch. s6 elongated, longer than high, subrectangular and axially keeled. s6 ventral margin thinly rimmed. Telson badly preserved in all studied specimens.
Cephalic appendages.—Antennular peduncle barely perceptible and only a small piece of thin antennular flagellum identified. Antenna with rather long peduncle composed of three segments increasingly thinner and longer distally. Antennal flagellum multi-articulated, incomplete but seemingly very long. Pointed scaphocerite, straight and potentially slightly curved upwards.
Thoracic appendages.—Although not well preserved, they seem rather long and slender.
Pleonal appendages.—Pairs of pleopods moderately long, ovoid, fan-like. No traces of pleopod flagella. First pair distinctively bigger than the others, possibly petasma. No uropods preserved.
Internal structures.—Multiple specimens (UBGD30558 and some of the additional material) exhibit remains of the digestive track throughout the pleon. The intestine extends parallel to the median line, slightly dorsally from s1 to s6 and terminates posteriorly just beneath the telson.
Illustrated material
UBGD30558, UBGD30555a, UBGD30553a, and UBGD294002 from Paris Canyon, Idaho, USA (early Spathian, Early Triassic).
Additional material
The majority of the specimens on slabs UBGD30553 and UBGD30635 from Paris Canyon, Idaho, USA (early Spathian, Early Triassic); UBGD33011BIS (not “UBGD33011” as mentioned in Smith et al., Reference Smith, Laville, Fara, Escarguel, Olivier, Vennin, Goudemand, Bylund, Jenks, Stephen, Hautmann, Charbonnier, Krumenacker and Brayard2021) and UBGD294003 from Georgetown locality, Idaho, USA (early Spathian, Early Triassic).
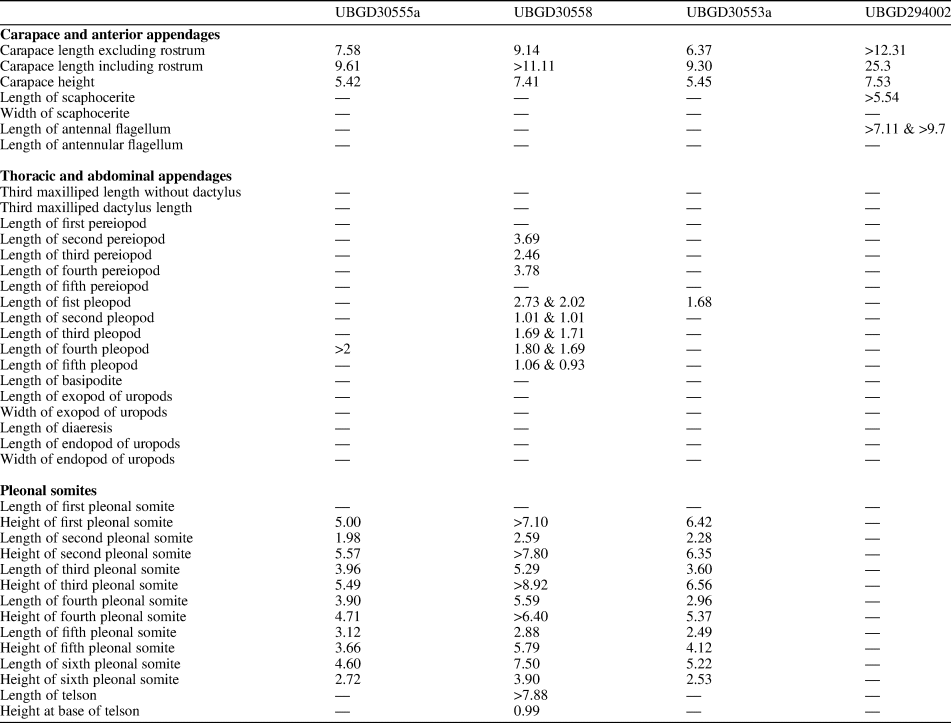
Measurements
See Table 1.
Measurements (in mm) of specimens of Aeger sp. When both left and right appendages were measurable, both measures are given.

Remarks
The large majority of the sampled specimens are small (2–3 cm), rather stocky, and occur in mass (>30 specimens on a 35 × 35 cm slab). They present cephalic structures diagnostic of Aeger (e.g., cervical groove steeply inclined, not joined to the dorsal margin, joined to antennal groove that in our specimens is most probably mingled with the anterior section of the branchiocardiac groove; oblique and sinuous branchiocardiac groove; hepatic groove; postorbital spine). Unfortunately, the lack of complete rostrum and cephalothoracic appendages prevents identification at the species level.
One specimen (UBGD294002), much larger but poorly preserved, is also ascribed to Aeger sp. It consists of an isolated and incomplete carapace. Based on the preservation state of the posterior part of the carapace, this specimen probably corresponds to an exuvia. Nonetheless, the rostrum is partially preserved and appears to be elongated, granular, and with only one isolated infrarostral spine, which is reminiscent of the rostrum of Aeger.
To avoid any overestimation of diversity, and given that we suspect the two distinct morphs (small stocky versus large with infrarostral spine) may represent two different ontogenetic stages of the same taxon, we choose to ascribe both morphs to Aeger sp. pending discovery of additional material. The genus Aeger was known from the Middle Triassic (Anisian Luoping Biota; Huang et al., Reference Huang, Feldmann, Schweitzer, Hu, Zhou, Benton, Zhang, Wen and Xie2013) to the Late Cretaceous (Cenomanian and Santonian Lebanon Konservat-Lagerstätten; Charbonnier et al., Reference Charbonnier, Audo, Garassino and Hyžný2017). These specimens therefore represent the oldest known occurrence of Aeger, extending its range by about 5 Ma into the early Spathian (Early Triassic).
Genus Anisaeger Schweitzer et al., Reference Schweitzer and Feldmann2014
- Reference Schweitzer and Feldmann2014
Anisaeger Schweitzer et al., p. 459–461.
Type species
Anisaeger brevirostrus Schweitzer et al., Reference Schweitzer, Feldmann, Hu, Huang, Zhou, Zhang, Wen and Xie2014, by original designation. The name An. brevispinus [sic] is used several times in the figure captions corresponding to illustrations of An. brevirostrus provided by Schweitzer et al. (Reference Schweitzer, Feldmann, Hu, Huang, Zhou, Zhang, Wen and Xie2014). This is obviously a misspelling.
Other species
Triassic: Anisaeger longirostrus n. sp.; Anisaeger atavus (Bill, Reference Bill1914) n. comb.; Anisaeger crassipes (Bronn, Reference Bronn1858) n. comb.
Original diagnosis by Schweitzer et al. (Reference Schweitzer, Feldmann, Hu, Huang, Zhou, Zhang, Wen and Xie2014).—Carapace small to moderate size, laterally compressed; rostrum short, upturned, and lacking spines to long, upturned, and bearing suprarostral and subrostral spines. Pleon with smooth terga and generally rounded pleural terminations; somites 5 and 6 axially keeled. Telson sharply pointed, with or without articulated spines. Uropodal exopod without diaeresis. Third maxilliped relatively short, setose or spinose. Pereiopods generally short; pereiopods 1–3 with small chelae. Pleopods with a pair of annulated terminal processes.
Emended diagnosis (present work)
Rostrum of variable length, from moderately short (equal to the length of the eye) to very long (length of the carapace); smooth rostrum without spines; cephalothorax with hepatic and postorbital spines; s1 narrower and shorter than s2, with a strong anteriorly incurved ventral termination; s6 longer than the others, and dorsally keeled; hypertrophied third maxilliped just slightly longer than pereiopods with an acuminate dactylus; all pereiopods developed and of medium length; pereiopods not setose or spinose; P1–P3 chelate; P4 and P5 achelate. Pleopods with a pair of annulated terminal processes.
Remarks
The placement of Anisaeger within Aegeridae is based on the presence of a hepatic spine, a long scaphocerite, a long antennal flagellum, well-developed third maxillipeds and pereiopods, chelate pereiopods 1 to 3, and pleopods composed of two multi-articulated flagella each. As mentioned previously, Anisaeger was erected based on An. brevirostrus (type species) and An. spiniferus. These two taxa are significantly different (e.g., respectively, a short smooth rostrum versus a long rostrum with multiple basal teeth and one subrostral spine, and smooth posterior margin of s4–s6 versus a serrated posterior margin of s4–s6). They thus do not pertain to the same genus. Anisaeger spiniferus is assigned to Acanthochirana (see section on this genus), and based on observations made on An. longirostrus n. sp., and on An. brevirostrus, we provide herein a new diagnosis for Anisaeger.
Additionally, Anisaeger was until now only reported from the Middle Triassic of South China (Luoping Biota, Anisian; Schweitzer et al., Reference Schweitzer, Feldmann, Hu, Huang, Zhou, Zhang, Wen and Xie2014). Our revision shows that this genus was also present in the Middle and Late Triassic of Europe (Anisian of France and Carnian of Austria; Bronn, Reference Bronn1858; Bill, Reference Bill1914). The specimens from the Paris Biota described below not only extend the temporal range of the genus by 5 Myr into the early Spathian (Early Triassic), but also considerably extend its spatial distribution into eastern Panthalassa.
Anisaeger atavus (Bill, Reference Bill1914) new combination
Supplementary file 2
- Reference Bill1914
Penaus atavus Bill, p. 305, pl. 11, fig. 3; pl. 12, fig. 4.
- Reference Gall1971
Antrimpos atavus; Gall, p. 50, pl. 12, figs. 1–3.
- Reference Schweitzer, Feldmann, Garassino, Karasawa and Schweigert2010
Antrimpos atavus; Schweitzer et al., p. 9.
Neotype
Holotype destroyed. Neotype designated by Gall (Reference Gall1971): almost complete specimen (PEN 1) from the Anisian Grès à meules Formation, France, and reposited in the Grauvogel-Gall collection at the Ecole et Observatoire des Sciences de la Terre, Strasbourg, France.
Emended diagnosis by Gall (Reference Gall1971; translated from French)
Crustacean with a narrow and elongated body, laterally compressed, generally fossilized in the dorso-ventral position. Thin and smooth cephalothoracic carapace, bearing three pairs of short grooves (cervical, hepatic, and branchiocardiac) and two pairs of spines in the anterior region. It is extended in front by a long and pointed rostrum, adorned with a few dorsal teeth in the large specimens. Abdomen longer than the cephalothorax, formed of six segments, the last of which is about twice as long as it is high. Triangular telson, finished in a point. Short antennae formed by two unequal rami. Antennae with a long multi-jointed whip and a broad scale with the outer edge differentiated into a thorn. Third maxilliped with stiff bristles. Slender and smooth thoracic legs, the first three ending in a claw. Abdominal appendages unknown. Strongly chitinized uropods; the exopodite is articulated.
Remarks
Penaus atavus was described based on eight specimens from the Upper Buntsandstein (Middle Triassic) Grès à Voltzia Formation (Bill, Reference Bill1914). These specimens were described as having very long antennal flagellum, hypertrophied third maxillipeds that were spinose or setose (as evinced by pits along the appendages), chelate pereiopods 1–3, and with a first pleonal somite shorter than the others. Bill (Reference Bill1914) attributed these specimens to the Penaeidae mainly on the basis of the chelae observed on the first three pereiopods. Unfortunately, all specimens originally housed at the University of Strasbourg were destroyed by fire in 1967. Gall (Reference Gall1971) later erected a neotype after examining over a hundred specimens also sampled from the Grès à Voltzia Formation. Considering the characters described by Bill (Reference Bill1914), he established a new diagnosis accompanied by a schematic reconstruction in which the species is described with cervical, hepatic, and branchiocardiac grooves, two spines in the anterior part of the carapace, a dorsally keeled s6 longer than high, and a long rostrum with basal spines on the largest specimens. The illustrations provided by Bill (Reference Bill1914) and Gall (Reference Gall1971) do not allow confirmation of the presence of basal spines on the rostrum. Without any justification, the species was assigned to the “wastebasket” genus Antrimpos by Gall (Reference Gall1971).
Given the distinctive hypertrophied setose third maxilliped, this species should be regarded as an Aegeridae. Additionally, the presence of (1) two anterior spines on the carapace that most probably correspond to the hepatic and postorbital spines, (2) the branchiocardiac cervical and hepatic grooves, (3) the s6 dorsally keeled, and (4) the hypertrophied third maxilliped as long as the pereiopods, suggest it belongs to Anisaeger. We therefore propose the new combination Anisaeger atavus. Anisaeger atavus (Bill, Reference Bill1914) differs from other Anisaeger species by the presence of a third maxilliped of the same length as the pereiopods, thinly setose, and that is terminated by a straight sharp dactylus.
Anisaeger longirostrus new species
Figures 4–6
- Reference Brayard, Krumenacker, Botting, Jenks, Bylund, Fara, Vennin, Olivier, Goudemand, Saucède, Charbonnier, Romano, Doguzhaeva, Thuy, Hautmann, Stephen, Thomazo and Escarguel2017
Penaeoid shrimp; Brayard et al., p. 4, fig. 6.C; fig. S20.A, E.
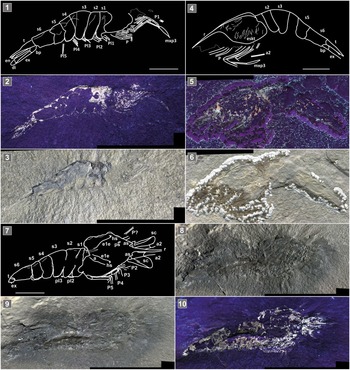
Anisaeger longirostrus n. sp. (1–3) Right lateral view of holotype specimen UBGD294000; (4–6) left lateral view of paratype specimen UBGD30559; (7–10) dorsal view of paratype specimen UBGD294001. (1, 4, 7) Line drawings; (2, 5, 10) under UV illumination; (3, 6, 8, 9) under natural illumination. Abbreviations: a = branchiocardiac groove; a2 = antenna; as = antennal spine; bp = basipodite; di = diaeresis; e1e = cervical groove; en = endopodite; eskt = endophragmal skeleton; ex = exopodite; hs = hepatic spine; mxp3 = third maxilliped; P = pereiopod; pl = pleopod; ps = postorbital spine; r = rostrum; s = pleonal somite; sc = scaphocerite; t = telson. Scale is 1 cm.

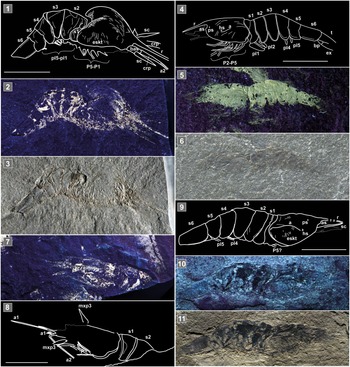
Anisaeger longirostrus n. sp. (1–3) Dorso-right lateral view of paratype specimen UBGD294004; (4–6) left lateral view of specimen UBGD30553b; (7, 8) left lateral view of specimen UBGD294005c; (9–11) right lateral view of paratype specimen UBGD33022BIS. (1, 4, 8, 9) Line drawings; (2, 5, 7, 10) under UV illumination; (3, 6, 11) under natural illumination. Abbreviations: a = branchiocardiac groove; a1 = antennula; a2 = antenna; as = antennal spine; bas = basicerite; bp = basipodite; crp = carpocerite; eskt = endophragmal skeleton; ex = exopodite; hs = hepatic spine; mxp3 = third maxilliped; P = pereiopod; pl = pleopod; ps = postorbital spine; r = rostrum; s = pleonal somite; sc = scaphocerite; t = telson. Scale is 1 cm.

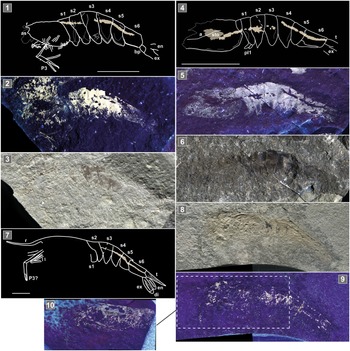
Anisaeger longirostrus n. sp. (1–3) Left lateral view of specimen UBGD294005a; (4–6) left lateral view of specimen UBGD294005b; (7–9) left lateral view of specimen UBGD30555b; (10) mirrored counter-impression of UBGD30555b. (1, 4, 7) Line drawings; (2, 5, 9, 10) under UV illumination; (3, 6, 8) under natural illumination. Abbreviations: a = branchiocardiac groove; as = antennal spine; bp = basipodite; di = diaeresis; en = endopodite; ex = exopodite; P = pereiopod; pl = pleopod; r = rostrum; s = pleonal somite; sto = stomach traces; t = telson. The beige color corresponds to digestive-track traces. Scale is 1 cm.

Type material
The holotype is UBGD294000 and paratypes include, UBGD30559, UBGD294001, and UBGD294004 from Paris Canyon, Idaho, USA (early Spathian, Early Triassic). UBGD33022BIS [not “UBGD33022” as mentioned in Smith et al., Reference Smith, Laville, Fara, Escarguel, Olivier, Vennin, Goudemand, Bylund, Jenks, Stephen, Hautmann, Charbonnier, Krumenacker and Brayard2021] is from the NoName locality, Nevada, USA (early Spathian, Early Triassic).
Diagnosis
Carapace with a very long spineless rostrum; postorbital spine present; cervical groove inclined and terminated by an hepatic spine; long oblique branchiocardiac groove; well pronounced orbital notch; third maxilliped smooth and slightly longer than pereiopods; acuminate dactylus of third maxilliped; pereiopods 1–3 with moderate sized chelae; s1 narrower and shorter than s2, with a strong anteriorly incurved ventral termination; s3 higher than others and triangular; lateral keel on s5 and s6. Uropodal exopod with diaeresis.
Description
Carapace.—Thin subrectangular carapace, narrower anteriorly than dorsally, with straight ventral margin, and dorsal margin gently arched. Anterior margin with well pronounced orbital notch and distinct antennar notch, both notches being separated by a sharp protuberance and possibly even an antennar spine. Thinly rimmed posterior margin, ventrally rounded and slightly concave dorsally. Smooth and long rostrum, straight or slightly upturned and without spines. Small postorbital spine pointing anteriorly. Short inclined cervical groove terminated anteriorly by a hepatic spine. Long and shallow branchiocardiac groove.
Pleon.—s1–s6 tergopleura smooth with a thin rim on the external margin. Terga of s1 to s4 smooth, and with a thin dorsal carina on s5 and s6. s1 higher than long, narrower and shorter than s2, with tergopleuron strongly concave anteriorly, ending with a sharp to narrowly rounded extremity, and with a convex to slightly sinuous posterior margin. s2 higher than long, rather triangular with anterior margin of tergopleuron straight or slightly concave, posterior margin straight, and a rounded termination. s3 is higher and longer than the others, triangular, and overlapping s2. s4 is ovoid with a rounded end, about the same dimension as s2 with an anterior margin slightly convex and a posterior margin slightly concave with an axial notch. s5 is the smallest, slightly higher than long, with a convex anterior margin, a concave posterior margin also presenting an axial notch, and a rounded termination. s6 is elongated, longer than high, subrectangular. s5 and s6 show traces of an axial keel. Straight, triangular and elongated telson, about as long as s6 and sharply terminated.
Cephalic appendages.—No clear remains of antennular peduncle. Antennulae with two, thin, long multi-articulated flagella (~length of the carapace). Antenna composed of a smooth elongated peduncle with three elongated segments slightly thinner and gradually longer distally. Antennal flagellum multi-articulated and very long. Scaphocerite composed of two distinct parts: a spine that is rigid, and a blade that is thinner. The spine is straight, long, extending beyond antenna basal elements and with a sharp distal extremity. The blade is rather smooth, ovoid with a rounded termination, wide, and extending above the scaphocerite spine.
Thoracic appendages.—Maxillipeds 1 and 2 not preserved. Mxp3 smooth, well developed, moderately longer than the pereiopods. Mxp3 carpus and propodus slender and very elongated, roughly equally long. Mxp3 dactylus large and acuminate. Pereiopods moderately long, slender and smooth. P1–P3 gradually longer posteriorly and with moderate sized chelae. P4 and P5 achelate.
Pleonal appendages.—Protopodite of pleopods moderately long, ovoid to slightly triangular, preserved in pairs. No remains of pleopod flagella. First pair of pleopods distinctively bigger than others in some specimens, potentially petasma. Rounded to subtriangular uropodal basipodite. Uropodal exopod and endopod ovoid with smooth lateral margins, and rounded distal margins. Uropodal exopod slightly shorter or the same length as the telson, and slightly longer than uropodal endopod, both uropodal exopod and endopod present marks of longitudinal streaks. Uropodal exopod with diaeresis.
Internal structures.—Several specimens exhibit remains of digestive system. Even part of the stomach, located in the hepatic region, is occasionally preserved (Fig.6. 4-5). The digestive tractus extends anteriorly in the carapace to the hepatic region, horizontally and axially. It extends parallel to median line, slightly dorsally throughout the pleon and terminates posteriorly just beneath the telson.
Etymology
The specific epithet refers to the elongated rostrum.
Additional material
UBGD294005a, UBGD294005b, UBGD294005c, UBGD294006, UBGD30553b, UBGD30555b, UBGD294007 and UBGD294008 from Paris Canyon, Idaho, USA (early Spathian, Early Triassic).
Measurements
Available in Table 2.
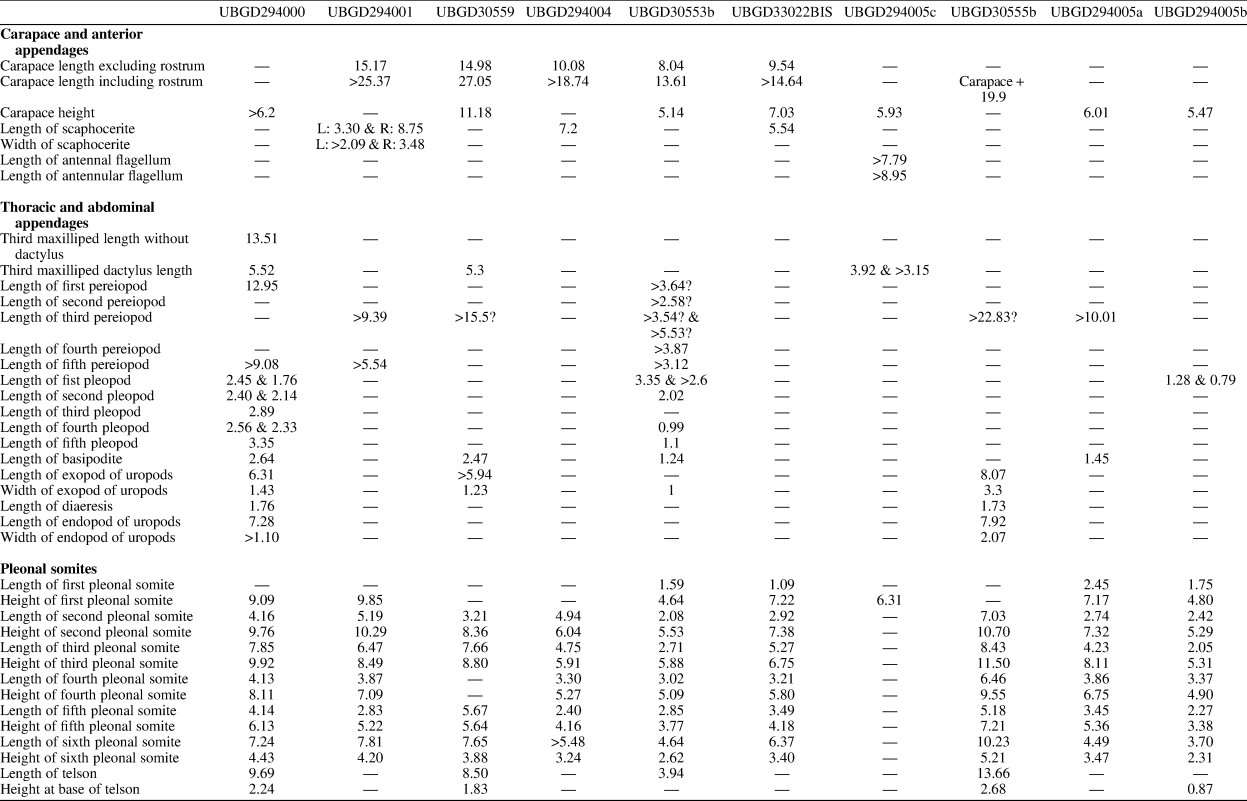
Measurements (in mm) of specimens of Anisaeger longirostrus n. sp. When both left and right appendages were measurable, both measures are given.

Remarks
The specimens exhibit spineless, well-developed thoracic appendages, long scaphocerites, and third maxillipeds moderately longer than the pereiopods. These characters are diagnostic of Aegeridae. With their moderately long thoracic appendages, these specimens differ from Aeger species that bear very long thoracic appendages, and very well-developed third maxillipeds, usually spinose or setose. The long and spineless rostrum of these specimens also distinguishes them from Acanthochirana. The only other Aegeridae having a spineless rostrum is Anisaeger.
Sampled specimens are flattened but abundant, which allowed us to distinguish recurrent anatomical features from simple compression artefacts. These features are the inclined cervical groove, the long and oblique branchiocardiac groove, and the hepatic and postorbital spines. Hepatic and postorbital spines as well as a shallow cervical groove were also identified in An. brevirostrus, but no branchiocardiac carina were reported so far from the latter. However, this difference should be taken with caution because it may result from a taphonomic bias (i.e., the compression of the carapace may have erased some cephalic features). There are, however, other features differentiating the two species. The rostrum of An. longirostrus n. sp. is very long (Table 2), but it is never much longer than the eyestalks in An. brevirostrus. Anisaeger brevirostrus also exhibits setal pits on the third maxilliped whereas An. longirostrus n. sp. does not exhibit any setose or spinose thoracic appendages, implying that if setose or spinose thoracic appendages were present, they were very thin. Finally, the third maxilliped of An. longirostrus n. sp. is much slenderer than that of An. brevirostrus, and terminated by an acuminate dactylus.
Anisaeger crassipes (Bronn, Reference Bronn1858) new combination
- Reference Bronn1858
Aeger crassipes Bronn, p. 26, pl. 5, figs. 1, 2 (not pl. 4, fig. 5).
- Reference Van Straelen1928
?Aeger crassipes; Van Straelen, p. 497.
- Reference Glaessner1930
Antrimpos crassipes; Glaessner, p. 139, pl. 6, fig. 1; pl. 10, fig. 4.
- Reference Glaessner1965
Antrimpos crassipes; Glaessner, p. 112, fig. 1.
- Reference Schweitzer, Feldmann, Garassino, Karasawa and Schweigert2010
Antrimpos crassipes; Schweitzer et al., p. 9.
- Reference Hyžný and Zorn2016
Antrimpos crassipes; Hyžný and Zorn, p. 137, pl. 14, fig. 1.a–c.
- Reference Hyžný and Garassino2022
“Genus? crassipes” Hyžný and Garassino, p. 69, figs. 1–4.
Type material
Syntypes figured by Bronn (Reference Bronn1858, pl. 5, figs.1, 2 [not pl. 4, fig. 5]) and from the Carnian Raibl Formation, Italy, possibly lost.
Emended diagnosis by Glaessner (Reference Glaessner1930; translated in modern terms)
Carapace and rostrum poorly preserved; s1–s3 with rounded tergopleura; s4 and s5 with subtriangular tergopleura; s6 longer than the others; s5 and s6 with median lateral keel; telson as long as s6; uropods third longer than telson, with longitudinal carina; very long multi-articulated antennal flagellum; oval scaphocerite; third maxilliped with foliole-shaped dactylus; P1–P3 with elongate chelae; P3 longer that P1 and P2; short P4, P5 achelate; pleopods with exopodite and endopodite of same length; first pleopods arched and heavily calcified (petasma).
Remarks
Aeger crassipes was described based on four specimens from the Carnian Raibl Formation, Italy (De Zanche et al., Reference De Zanche, Gianolla and Roghi2000). As specified by Bronn (Reference Bronn1858), the specimens are poorly preserved, complicating their identification. Nonetheless, he identified five pairs of pereiopods and long antennae. Additionally, he also noticed a long third maxilliped that he identified as a 6th pair of pereiopods. Based on the similarities of its overall shape, the antennae, the thoracic appendages, and the uropods, Bronn (Reference Bronn1858) assigned these specimens to Aeger. Finally, based on the rather robust P4 and P5 differing from those of other Aeger species that are usually filiform, he erected Aeger crassipes. Later, Glaessner (Reference Glaessner1930) revised this species based on 23 specimens, also from the Raibl Formation, and among which six exhibited the carapace and pleon, and three also had pereiopods. He described a triangular foliole-shaped dactylus for the third maxillipeds that are long, and three anterior pairs of pereiopods that are chelate, the third pair of pereiopods being the longest. The apparent absence of traces of setose or spinose on the third maxillipeds was mentioned by Glaessner (Reference Glaessner1930). He also provided a species reconstruction in which the rostrum is long and spineless. Considering that this species has the general characteristics of Penaeoidea but not those of Aeger, and finding more shared features with Antrimpos than with Aeger, Glaessner (Reference Glaessner1930) proposed the new combination Antrimpos crassipes (Bronn, Reference Bronn1858). Schweitzer (Reference Schweitzer, Feldmann, Garassino, Karasawa and Schweigert2010) followed this opinion. Nowadays however, Antrimpos is considered as a “wastebasket” taxon (e.g., Garassino and Teruzzi, Reference Garassino and Teruzzi1995; Garassino et al., Reference Garassino, Schweigert and Muscio2013; Robalino et al., Reference Robalino, Wilkins, Bracken-Grissom, Chan and O'Leary2016). Finally, Hyžný and Garassino (Reference Hyžný and Garassino2022) restudied the original material of Bronn (Reference Bronn1858) and Glaessner (Reference Glaessner1930). After not being able to identify any important diagnostic character that would support an attribution to one of the two genera Aeger or Antrimpos, Hyžný and Garassino (Reference Hyžný and Garassino2022) suggested placing this taxon in open nomenclature as “Genus? crassipes (Bronn, Reference Bronn1858);” however, they did not consider an attribution to any other genera.
After examining the illustrations in Bronn (Reference Bronn1858) and Glaessner (Reference Glaessner1930), we identified the presence of well-developed third maxillipeds, at least as long as the pereiopods, P1–P3 chelate with the third pair longer than the others, very long antennal flagellum, and pleopods with two multi-articulated flagella each. These characters suggest that Antrimpos crassipes should be reassigned to Aegeridae. Additionally, given the presence of a spineless rostrum, Mxp3 that is about as long as the pereiopods, which themselves are moderately long, the absence of traces of setose or spinose on the Mxp3 that are terminated by an acuminate dactylus, and the s1 narrower and shorter than s2 with a strong anteriorly incurved ventral termination, we argue for an assignment to Anisaeger. Anisaeger crassipes (Bronn, Reference Bronn1858) n. comb. differs from Anisaeger brevispinus by its long rostrum, and the seemingly smooth Mxp3. Anisaeger crassipes n. comb. also shows relatively robust thoracic appendages, among which the P1–P3 are terminated by relatively big chelae, contrary to Anisaeger longirostrus n. sp. in which the thoracic appendages are rather slender and the P1–P3 only exhibit moderate-sized chelae.
Suborder Pleocyemata Burkenroad, Reference Burkenroad1963
Infraorder Glypheidea Winkler, Reference Winkler1882
Superfamily Glypheoidea Winkler, Reference Winkler1882
Family Litogastridae Karasawa et al., Reference Karasawa, Schweitzer and Feldmann2013
Genus Litogaster Meyer, Reference Meyer1847
- Reference Meyer1847
Litogaster Meyer, p. 137.
Type species
Litogaster obtusa (Meyer, Reference Meyer1844), by monotypy (junior synonym: Litogaster ornata Meyer, Reference Meyer1851).
Other species
Triassic: Litogaster durlachensis (Förster, Reference Förster1967a); ?Litogaster keuperinus Kuhn, Reference Kuhn1939; Litogaster limicola (König, Reference König1920); ?Litogaster luxoviensis Étallon, Reference Étallon1859; Litogaster tiefenbachensis Assmann, Reference Assmann1927; Litogaster tuberculata Assmann, Reference Assmann1927; Litogaster turnbullensis Schram, Reference Schram1971.
Emended diagnosis by Charbonnier et al. (Reference Charbonnier, Garassino, Schweigert and Simpson2013).—Subcylindrical carapace, laterally compressed; spatulate, spineless rostrum; cephalic region with longitudinal inflected carinae; very deep cervical groove, steeply inclined, ventrally joined to antennal groove, delimiting relatively narrow cephalic region; ventral margin of antennal-pterygostomial region slightly convex; antennal groove rounded ventrally; deep, narrow postcervical groove, dorsally incurved, not joined to dorsal margin but joined ventrally to branchiocardiac groove, forming elongate and narrow lobe; very short cardiac groove, slightly convex posteriorly; intercervical groove absent; deep, narrow branchiocardiac groove, dorsally incurved, joined to dorsal margin of carapace; deep hepatic groove, semicircular at intersection with branchiocardiac groove and straight before joining cervical groove; inflated adductor muscle insertion area; deep inferior groove, convex posteriorly, joined to hepatic groove.
Litogaster turnbullensis Schram, Reference Schram1971
Figures 7, 8
- Reference Schram1971
Litogaster turnbullensis Schram, p. 534, figs. 1–3.
- Reference Amati, Feldmann and Zonneveld2004
Litogaster turnbullensis; Amati et al., p. 150, fig. 2.2.
- Reference Chablais, Feldmann and Schweitzer2010
Litogaster turnbullensis; Schweitzer et al., p. 19.
- Reference Karasawa, Takahashi, Doi and Ishida2013
Litogaster turnbullensis; Karasawa et al., p. 79.
- Reference Laville, Smith, Forel, Brayard and Charbonnier2013
Litogaster turnbullensis; Charbonnier et al., p. 229, figs. 495, 496.
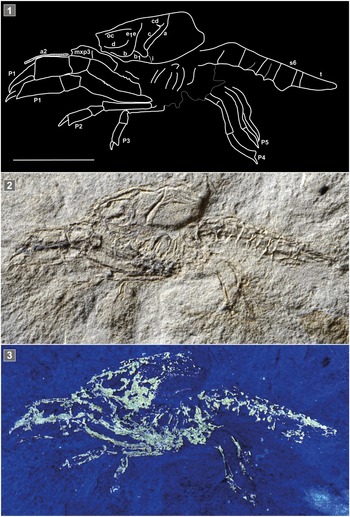
Litogaster turnbullensis Schram, Reference Schram1971. Left lateral view of an exuvia, specimen UBGD30557. (1) Line drawing; (2) under natural illumination; (3) under UV illumination. Abbreviations: a = branchiocardiac groove; a2 = antenna; b = antennal groove; b1 = hepatic groove; c = postcervical groove; cd = cardiac groove; d = gastro-orbital carina; e1e = cervical groove; i = inferior groove; mxp3 = third maxilliped; oc = orbital carina; P = pereiopod; s = pleonal somite; t = telson. Scale is 1 cm.

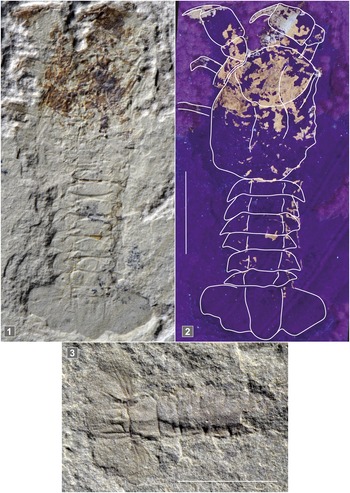
Litogaster turnbullensis Schram, Reference Schram1971. (1, 2) Dorsal view of UBGD30560; (3) dorsal view of specimen UBGD30548. (1, 3) Under natural illumination. (2) under UV illumination. Scale is 1 cm.
Type material
Holotype by monotypy (FMNH PE 16215) from the Early Triassic, Upper Siltstone Member of the Thaynes Formation of locality NW1/4, NW1/4, sec. 19, T.15S, R45E, on the top of a ridge about three-quarters of a mile east of Hot Springs, Bear Lake, Idaho, United States of America.
Original diagnosis by Schram (Reference Schram1971)
Decapod of moderate size; rostrum short and spatulate; carapace granulose in texture; postcervical and branchiocardiae grooves parallel and gently directed posteriad; doublure on posterior margin of carapace; abdominal terga smooth; telson subrectangular; exopod of uropod with diaeresis.
Emended diagnosis (present work)
Subcylindrical carapace granulose in texture, with a short spatulate rostrum without spines; distinct orbital notch; well-pronounced antennal and orbital carina; antennal groove weakly rounded ventrally, forming flat antennal lobe and joined to rimmed ventral margin of cephalic region; postcervical and branchiocardiae grooves parallel and gently directed posteriorly; subchelate P1–P3; P1 merus with dorsal and ventral spiny margins; P3 merus with spiny ventral margin; abdominal terga smooth; s2–s6 terga with median raised longitudinal carina; subrectangular telson rounded distally; uropodal endopod and exopod as long as telson, with strong median longitudinal carina; exopod of uropod with diaeresis.
Description
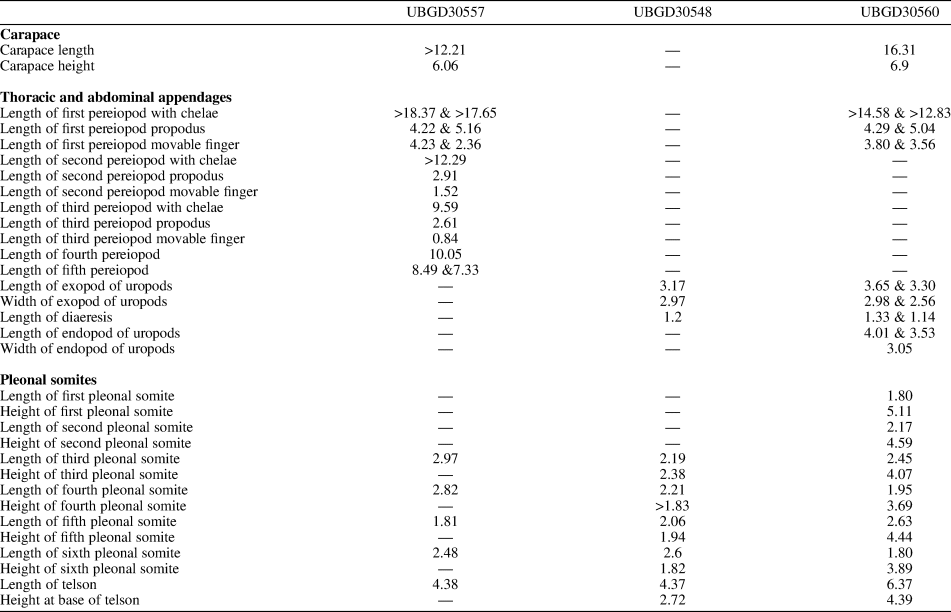
Carapace.—Laterally compressed, subcylindrical carapace (UBGD30557: CL = 16.31 mm, CH = 6.9 mm); short, spineless rostrum; distinct orbital notch; cephalic region with two tuberculated carinae, slightly raised; orbital and gastro-orbital carinae distinct, approaching each other distally; deep, straight cervical groove, intercepting dorsal midline at ~80° angle; cervical groove ventrally joined to antennal groove, delimiting narrow cephalic region; ventral margin of antennal-pterygostomial region slightly convex; antennal groove weakly rounded ventrally, forming flat antennal lobe and joined to rimmed ventral margin of cephalic region; weak postcervical groove, incurved dorsally, not joined to dorsal margin but joined ventrally to branchiocardiac groove, forming elongate, narrow lobe; very short cardiac groove, interrupted before joining dorsal midline; weak branchiocardiac groove, incurved dorsally, reaching dorsal midline at ~70° angle; hepatic groove, semicircular at intersection with branchiocardiac groove and straight before joining cervical groove; inferior groove not visible; raised adductor muscle insertion area. All regions of carapace finely tuberculated.
Cephalic appendages.—Poorly preserved, only a fragment of probable antennal flagellum is visible.
Thoracic appendages.—Subchelate P1, largest and stoutest; cylindrical P1 merus with spiny dorsal and ventral margins; tronconical P1 carpus as long as high; subrectangular P1 propodus, at least two times as long as high; P1 dactylus large, elongate, and distally curved; subchelate P2–P3; P3 merus with spiny ventral margin; achelate P4–P5 more slender than P1–P3.
Pleon.—s1 shorter than others; subrectangular s2–s5, equal in size, with smooth terga and mucronate tergopleura; subrectangular s6 shorter than previous ones, with triangular tergopleura; s2–s6 terga with median raised longitudinal carina; subrectangular telson with rounded distal extremity, marked with faint median and lateral longitudinal carinae.
Pleonal appendages.—Uropodal endopod and exopod as long as telson, with strong median longitudinal carina; uropodal exopod with straight diaeresis.
Illustrated material
Three specimens from the Paris Biota (from Paris Canyon, Idaho, USA): UBGD30557 is a subcomplete specimen preserved in left lateral view showing a disarticulation between the carapace, the pleon, the endophragmal skeleton and the pereiopods, which suggests a probable exuvia origin; UBGD30560 is a subcomplete specimen preserved in dorso-ventral position; UBGD30548 is an isolated pleon preserved in dorsal view.
Measurements
See Table 3.
Measurements (in mm) of specimens of Litogaster turnbullensis. When both left and right appendages were measurable, both measures are given.

Remarks
The three new specimens sampled from the Paris Biota show diagnostic characters of Litogaster (e.g., the carapace groove pattern with the postcervical and branchiocardiac grooves joined ventrally, the short cardiac groove, and the semicircular hepatic groove). The subchelate P1–P3 are also very typical of Litogaster. The finely tuberculated ornamentation, the presence of a clear orbital notch, and the well-pronounced antennal and orbital carinae suggest placement in Litogaster turnbullensis.
Superfamily Pemphicoidea Van Straelen, Reference Van Straelen1928
Family Pemphicidae Van Straelen, Reference Van Straelen1928
Included genera
Pemphix Meyer, Reference Meyer1835; Pseudopemphix Wüst, Reference Wüst1903; Oosterinkia Klompmaker and Fraaije, Reference Klompmaker and Fraaije2011.
Emended diagnosis by Charbonnier et al. (Reference Charbonnier, Audo, Garassino and Schweigert2015)
Carapace with strongly inflated cephalothoracic regions; spatulate, dorsoventrally flattened rostrum; orbital, gastro-orbital and antennal ridges absent in cephalic region; gastro-orbital groove with two wide branches; very deep cardiac groove; postcervical and branchiocardiac directed toward the dorsal margin with angle ~30° and converging dorsally, but without dorsal connection; biconvex hepatic groove; subchelate pereiopods 1–3; uropodal exopodite with straight diaeresis; subrectangular telson with rounded extremity.
Genus Pemphix Meyer, Reference Meyer1835
- Reference Meyer1835
Pemphix Meyer, p. 328.
Type species
Palinurus sueurii Desmarest, Reference Desmarest1817, by subsequent designation of Glaessner (Reference Glaessner and Pompeckj1929).
Other species
Triassic: Pemphix malladai Vìa, Reference Vìa1971; Pemphix silesiacus Assmann, Reference Assmann1927; Pemphix sueurii (Desmarest, Reference Desmarest1817).
Emended diagnosis by Feldmann et al. (Reference Feldmann, Schweitzer and Karasawa2015)
Subcylindrical carapace slightly compressed dorsoventrally, strongly sculptured by deep grooves; gastric, hepatic, meso- gastric, metagastric, and epibranchial regions well defined; cervical, postcervical, and branchiocardiac grooves well developed; long and spatulate rostrum lacking supra- and subrostral teeth but broadly rimmed; short antennules; long antennae with leaf-shaped scaphocerite; pereiopod 1 strongly developed and subchelate; pereiopods 2–3 slender and subchelate; pereiopods 4–5 with terminal dactylus; subrectangular pleonal somites with wide articulating rings; tergopleura blunt-triangular, directed posteriorly; subrectangular telson; exopodite with diaeresis.
Emended diagnosis (present work)
Carapace tuberculate with strongly inflated cephalothoracic regions; gastric, hepatic, meso- gastric, metagastric, and epibranchial regions well defined; spatulate rostrum, broadly rimmed; long antennae with leaf-shaped scaphocerite; short antennules; orbital, gastro-orbital and antennal ridges absent in cephalic region; gastro-orbital groove with two wide branches; very deep cardiac groove; postcervical and branchiocardiac directed toward the dorsal margin with angle ~30° and converging dorsally but without dorsal connection; biconvex hepatic groove; subchelate pereiopods 1–3; pereiopod 1 strongly developed; pereiopods 4–5 achelate; subrectangular pleonal somites; tergopleura blunt-triangular, directed posteriorly; uropodal exopodite with straight diaeresis; subrectangular telson with rounded extremity.
Type material
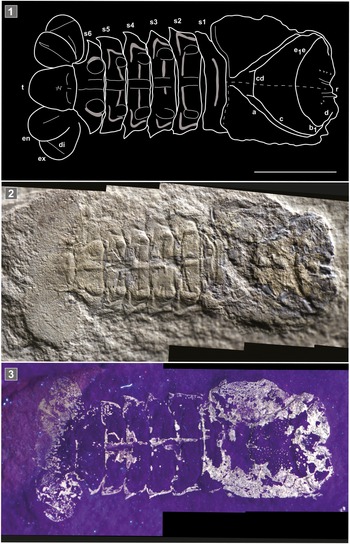
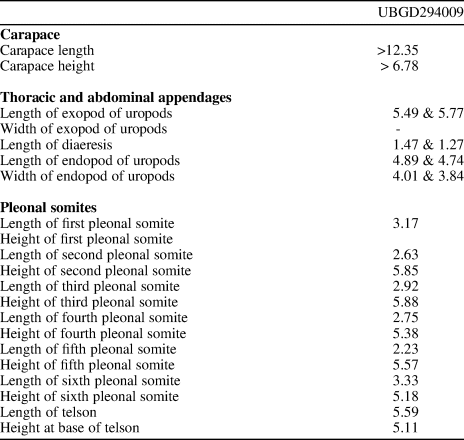
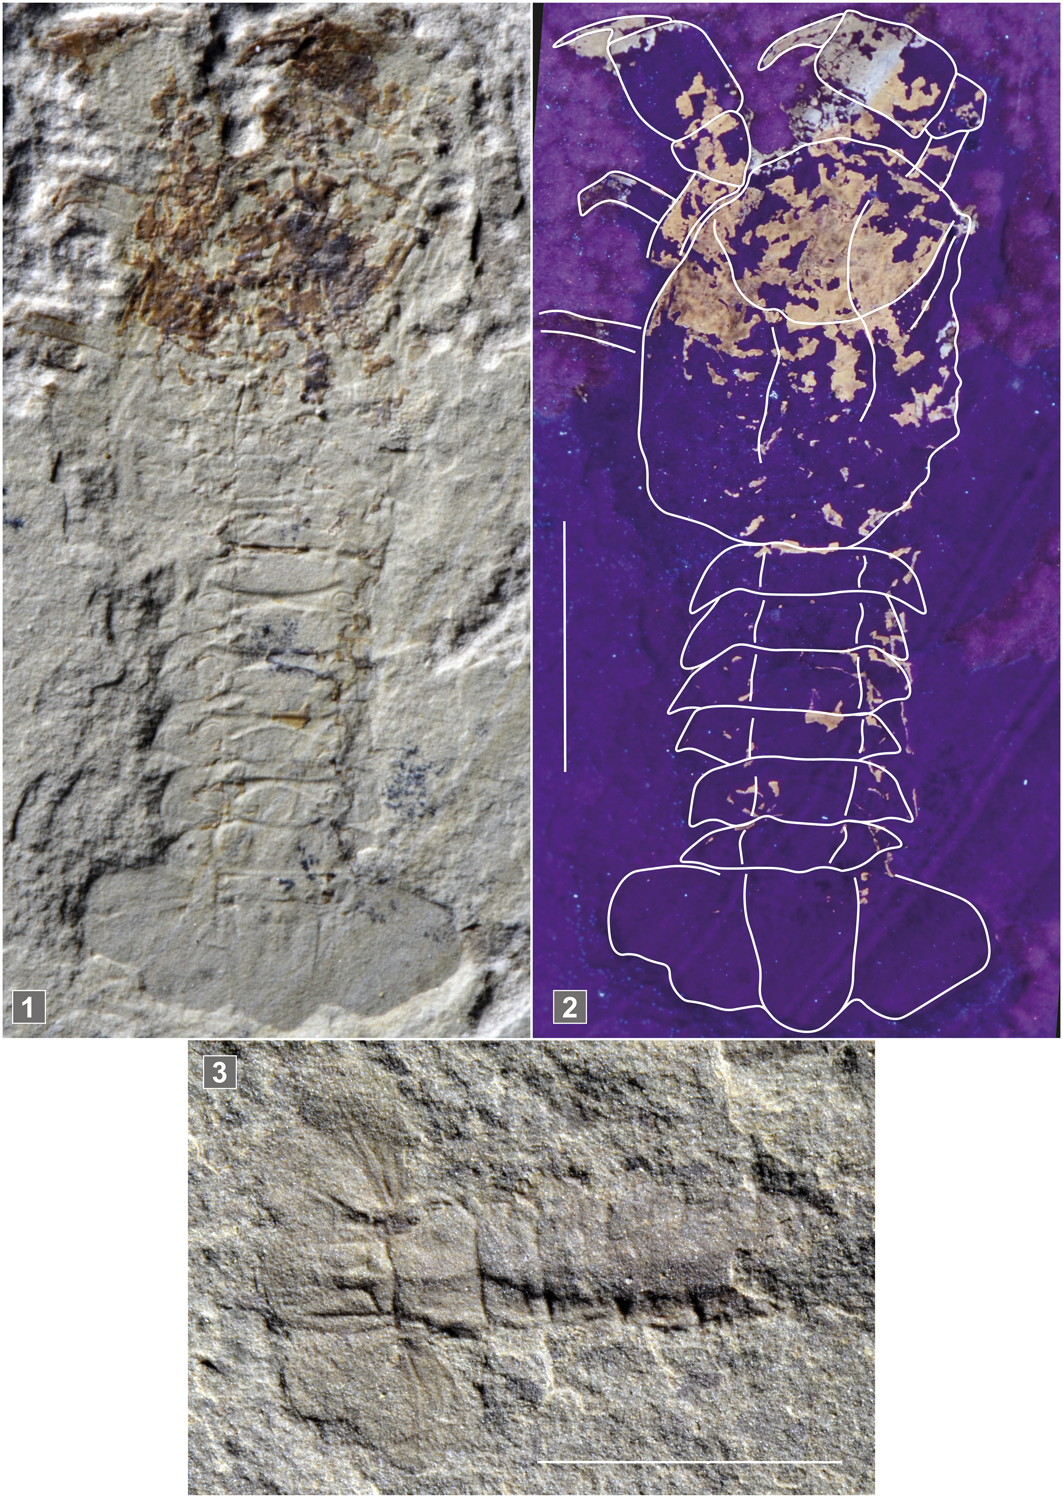
Holotype by monotypy UBGD294009, subcomplete specimen from Paris Canyon, southeastern Idaho, USA (early Spathian, Early Triassic), preserved in dorso-ventral position, showing fragmentary carapace, complete pleon and tail fan; early Spathian, Early Triassic.
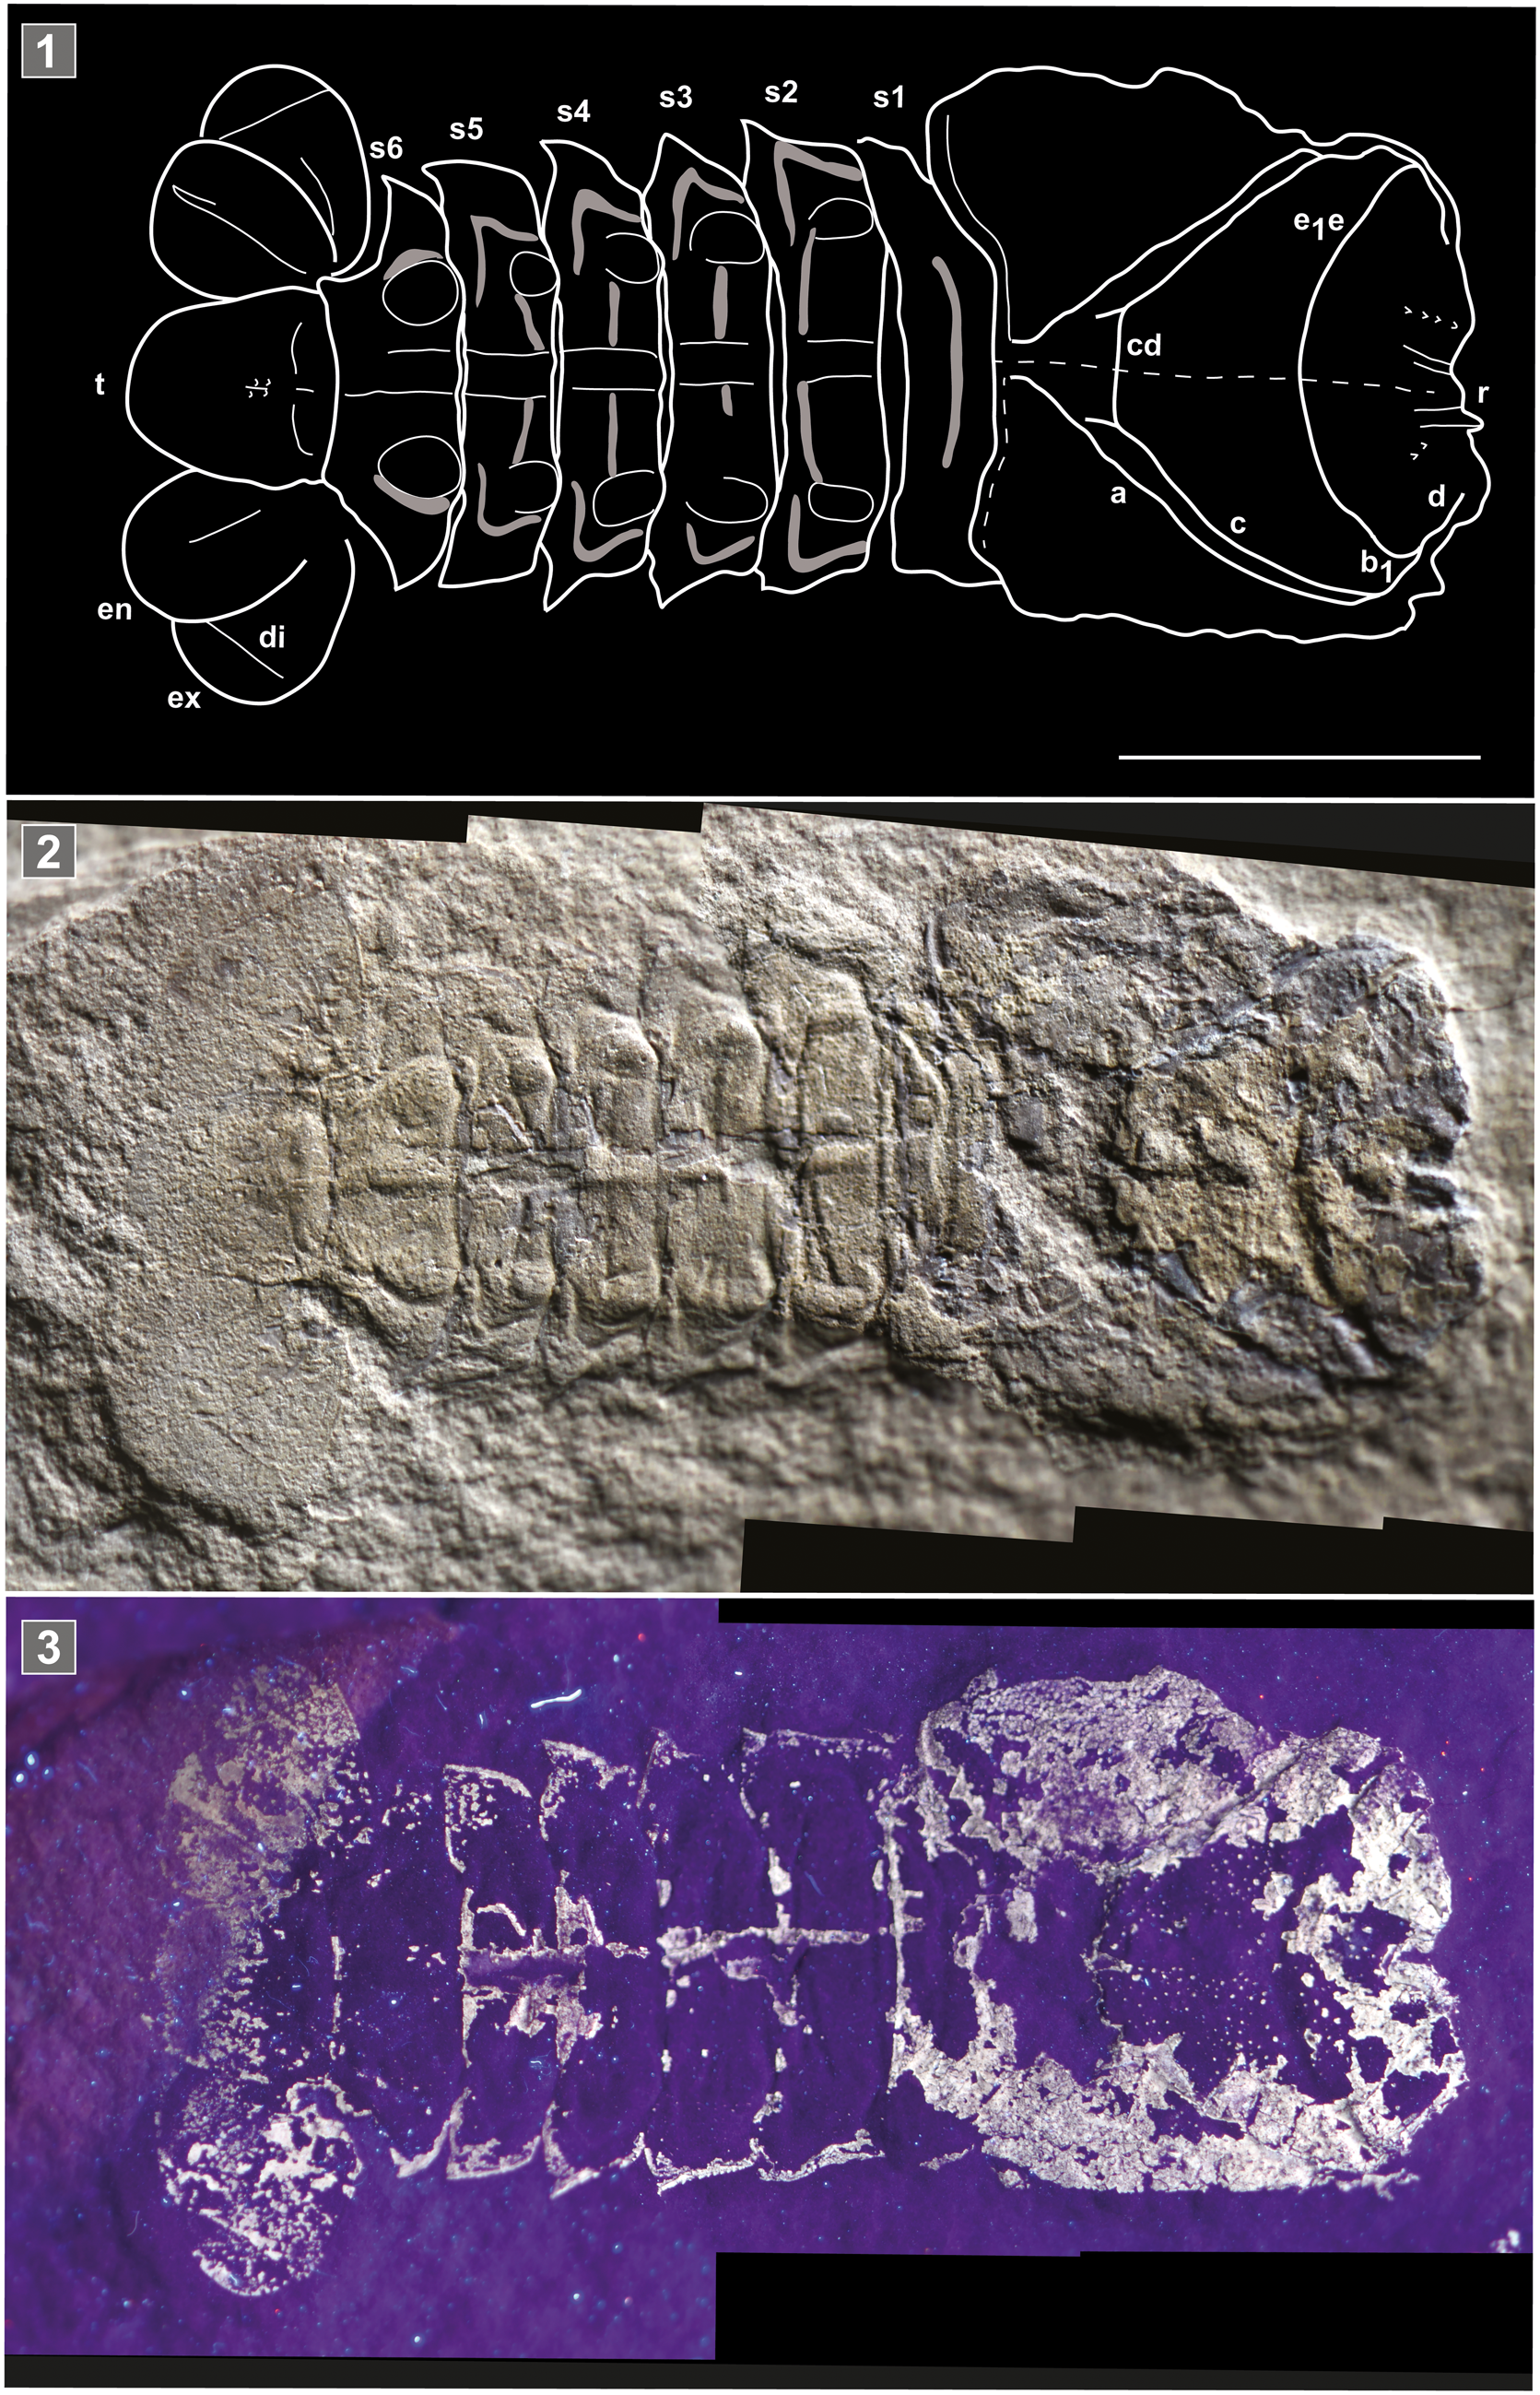
Pemphix krumenackeri n. sp. Dorsal view of holotype specimen UBGD294009. (1) Line drawing (by Julien Devillez and Sylvain Charbonnier); (2) under natural illumination; (3) under UV illumination. Abbreviations: a = branchiocardiac groove; b1 = hepatic groove; c = postcervical groove; cd = cardiac groove; d = gastro-orbital carina; di = diaeresis; e1e = cervical groove; en = endopodite; ex = exopodite; r = rostrum; s = pleonal somite; t = telson. Scale is 1 cm.
Diagnosis
Carapace tuberculate with strongly inflated cephalothoracic regions; rostrum large and dorsoventrally flattened; very deep cervical groove; branchiocardiac grooves directed dorsally and converging close to postero-dorsal extremity; moderately biconvex hepatic groove; deep cardiac groove joined ventrally and slightly anteriorly to postcervical groove; cardiac groove cutting dorsal midline perpendicularly; strongly sculptured pleonal somites with one transversal groove interrupted by a short median carina on s2–s5 terga, and strong nodulose process rimmed by one triangular groove at the fold separating tergopleuron from tergum on s2–s5 tergopleura; telson with one pair of broad proximal tubercles; uropods as long as telson, with one longitudinal carina; uropodal exopod with straight diaeresis.
Description
Carapace.—Carapace with originally strongly inflated cephalothoracic regions; rostrum not preserved, except the basis, broadly rimmed, suggesting a large, dorsoventrally flattened shape; very deep cervical groove; gastro-orbital groove poorly preserved, with two wide branches but only the dorsal one is well visible; postcervical and branchiocardiac grooves directed toward the dorsal margin with an angle of ~30° and converging posteriorly, but without dorsal connection; moderately biconvex hepatic groove; deep cardiac groove joined ventrally and slightly anteriorly to postcervical groove; cardiac groove cutting dorsal midline perpendicularly; ornamentation of carapace poorly preserved, but remains of small tubercles are present on cephalic and branchial regions.
Pleon.—Pleon as wide as carapace; subrectangular s1, smaller than others; s1 tergum with short transversal groove; s2–s5 of similar size and shape; s2–s5 terga with one transversal groove interrupted by a short median carina, s2–s5 tergopleura with one strong nodulose process rimmed by one triangular groove at the fold separating tergopleuron from tergum; s2–s5 tergopleura acuminate; s6 tergum with median carina; s6 tergopleuron with one strong nodulose process rimmed by incurved groove, at the fold separating tergopleuron from tergum; subrectangular telson with rounded extremity; telson with one pair of broad proximal tubercles.
Pleonal appendages.—Pleopods not preserved; uropods as long as telson, with one longitudinal carina; uropodal exopod with straight diaeresis.
Etymology
The specific epithet honors L. J. Krumenacker, discoverer of the Paris Canyon fossiliferous site.
Measurements
See Table 4.
Measurements (in mm) of specimens of Pemphix krumenackeri n. sp. When both left and right appendages were measurable, both measures are given.

Remarks
Pemphix krumenackeri n. sp. shows diagnostic characters of Pemphix Meyer, Reference Meyer1835, such as the carapace groove pattern (very deep cervical groove, parallel postcervical and branchiocardiac grooves, very deep cardiac groove cutting dorsal midline perpendicularly) and the originally strongly inflated regions of carapace (flattened on the fossil). Schweitzer et al. (Reference Schweitzer, Feldmann, Garassino, Karasawa and Schweigert2010) listed three species in Pemphix: Pemphix sueurii (Desmarest, Reference Desmarest1817) from the Middle Triassic of France and Germany; P. silesiacus Assmann, Reference Assmann1927, from the Middle Triassic of Poland; and P. malladai Vìa, Reference Vìa1971, from the Middle Triassic of Spain. Pemphix krumenackeri n. sp. differs from the type species by its strongly sculptured pleonal somites (almost smooth, with wide articulating rings in P. sueurii). Pemphix silesiacus is very close to P. sueurii, but much smaller and with a gastric region without strong sculpture (after Förster, Reference Förster1967). A potential synonymy between these two species was raised, but not solved because only one of the 21 original type specimens listed by Assmann (Reference Assmann1927) was recovered and studied by Förster (Reference Förster1967a). The poor preservation of Pemphix malladai Vìa, Reference Vìa1971, precludes any comparison with other Pemphicidae species and even raises the question of its placement within Pemphix. Pemphix krumenackeri n. sp. represents the oldest known Pemphix species, expanding the temporal extent of the genus back to the Early Triassic, and extending its spatial range to the American continent.
Genus Oosterinkia Klompmaker and Fraaije, Reference Klompmaker and Fraaije2011
- Reference Klompmaker and Fraaije2011
Oosterinkia Klompmaker and Fraaije, p. 6.
Type species
Oosterinkia neerlandica Klompmaker and Fraaije, Reference Klompmaker and Fraaije2011, by monotypy.
Emended diagnosis
As for type species, by monotypy.
Oosterinkia neerlandica Klompmaker and Fraaije, Reference Klompmaker and Fraaije2011
Type material
Holotype by monotypy (MAB k2854) from the Anisian Quarry I of the Winterswijk quarry complex, eastern Netherlands. Stored at Oertijdmuseum De Groene Poort, Boxtel, Netherlands.
Original diagnosis by Klompmaker and Fraaije (Reference Klompmaker and Fraaije2011)
Cephalothorax cylindrical; triangular rostrum; median line present; intercalated plate on gastric part; strong cervical groove; small, faint postcervical groove parallels stronger branchiocardiac groove; cephalothorax partly smooth or pitted. Terga and epimeres pitted; epimeres with pointed, slightly posteriorly directed tip. Spade-shaped telson with longitudinal groove but without bristle structure; exopod with diaeresis.
Emended diagnosis
Subcylindrical carapace slightly compressed dorsoventrally, sculptured by deep grooves; deep cervical groove; postcervical and branchiocardiac grooves directed toward the dorsal margin and converging dorsally but without dorsal connection; gastro-orbital groove with two wide branches; deep hepatic groove; gastric, hepatic, meso- gastric, metagastric, and epibranchial regions well defined; spatulate rostrum, dorsoventrally flattened, broadly rimmed; strong antenna with leaf-shaped scaphocerite; subrectangular pleonal somites with wide articulating rings; tergopleura blunt-triangular, directed posteriorly; subrectangular telson; exopodite with diaeresis.
Remarks
Oosterinkia was placed among the Erymidae Van Straelen, Reference Van Straelen1925. However, after careful examination of the original figures, the carapace with inflated cephalothoracic regions, the spatulate rostrum (even if broken), the gastro-orbital groove with two wide branches, the postcervical and branchiocardiac directed toward the dorsal margin and converging dorsally but without dorsal connection, and the uropodal exopod with straight diaeresis are actually diagnostic characters of Pemphicidae (see diagnosis proposed by Charbonnier et al., Reference Charbonnier, Audo, Garassino and Schweigert2015). Oosterinkia differs from Pemphix and Pseudopemphix by the absence of a very deep cardiac groove, its less strongly inflated cephalothoracic regions (e.g., cardiac region: short and raised in Pemphix, large and very raised in Pseudopemphix, large and flat in Oosterinkia), and its partially smooth or pitted carapace (strongly tuberculated in Pemphix and Pseudopemphix).
Diversification trends data
Following the taxonomical work, we listed all the Triassic decapods known to date (Table 5; Supplementary file 3). Seventy-five species are listed, along with their age and location, going from the Olenekian (Smithian + Spathian substages of the Early Triassic) to the Rhaetian, and from all continents except Oceania and Antarctica. When taxa were reported from two closely located sites and from the same age, they were grouped under the same locality name. For each listed taxon, the taxonomic and systematic validity was verified. Several taxonomic and systematic issues were raised, especially regarding Aegeridae. Therefore, when illustrations were sufficient to have solid arguments to reattribute the species, we did so, despite not having seen the type material, either because it is missing (e.g., type specimens of Penaeus atavus, Bill, Reference Bill1914, destroyed by fire) or it was not easily accessible. A first graphic representation of the decapod taxonomic richness is presented by epoch in Figure 10.1 and by stage in Figure 10.2. However, there is a strong correlation between the raw taxonomical richness and the number of sites from which the taxa were reported (Fig. 10.3, 10.4). In order to minimize a possible co-variance between the two latter, we also studied the mean of the observed alpha diversity of each site [αs] per studied interval (Fig. 10.5, 10.6). This mean [αm] was calculated for each time interval following  $\alpha _m = {{\mathop \sum \nolimits_{i = 1}^S \alpha _S} \over N}$, where N is the number of sites, S, of the interval (Whittaker, Reference Whittaker1960). This approach has the advantage of being easily applicable to any dataset in which the sampling sites are reported. It is favored to other model-based approaches (e.g., subsampling models, coverage-based models, rarefaction models) due to the limited size of the dataset. Such an approach is all the more important when the fossil record is highly heterogeneous (Fig. 10.3, 10.4), as is the case for the Triassic (Muscente et al., Reference Muscente, Schiffbauer, Broce, Laflamme, O'Donnell, Boag, Meyer, Hawkins, Huntley, McNamara, MacKenzie, Stanley, Hinman, Hofmann and Xiao2017).
Triassic decapod diversity trends based on the newly compiled dataset. (1, 2) Taxonomic richness; (3, 4) number of sites from which Triassic decapods have been reported; (5, 6) mean of observed alpha diversity. (1, 3, 5) Per epoch; (2, 4, 6) per stage.

List of all valid Triassic decapod taxa known to date and their respective stratigraphic range per series and stage. Classification is based on Schweitzer et al. (Reference Schweitzer, Feldmann, Garassino, Karasawa and Schweigert2010), Karasawa et al. (Reference Karasawa, Schweitzer and Feldmann2013), Devillez et al. (Reference Devillez, Charbonnier and Barreil2019), and Audo et al. (Reference Audo, Barriel and Charbonnier2021).

Discussion
The Paris Biota decapods
The first field collections of the Paris Biota yielded ~4550 fossil specimens, among which ~350 were decapods (articulated + disarticulated; Smith et al., Reference Smith, Laville, Fara, Escarguel, Olivier, Vennin, Goudemand, Bylund, Jenks, Stephen, Hautmann, Charbonnier, Krumenacker and Brayard2021). We can now assess that this material comprises at least four species representing three superfamilies of Decapoda. In comparison, the renowned and well-studied Anisian Luoping Biota (>18,500 arthropods; Hu et al., Reference Hu, Zhang, Chen, Zhou, Lü, Xie, Wen, Huang and Benton2011), which is often regarded as the first fully recovered marine fauna following the PTB crisis (Hu et al., Reference Hu, Zhang, Chen, Zhou, Lü, Xie, Wen, Huang and Benton2011; Chen and Benton, Reference Chen and Benton2012; Benton et al., Reference Benton, Zhang, Hu, Chen, Wen, Liu, Huang, Zhou, Xie, Tong and Choo2013), preserves seven species of four different superfamilies of Decapoda (Feldmann et al., Reference Feldmann, Schweitzer, Hu, Zhang, Zhou, Xie, Huang and Wen2012; Huang et al., Reference Huang, Feldmann, Schweitzer, Hu, Zhou, Benton, Zhang, Wen and Xie2013; Schweitzer et al., Reference Schweitzer, Feldmann, Hu, Huang, Zhou, Zhang, Wen and Xie2014; Table 5; Supplementary file 3). Another well-known decapod-rich Triassic formation, this time from Europe, is the Anisian Grès à Voltzia Formation, which hosts five species of four different superfamilies.
The decapod assemblage of the Paris Biota is only the second Early Triassic decapod assemblage known to date. The other known Early Triassic decapod assemblage is from the Dienerian–Smithian of Ambilobé, ~150 km SW of Diego Suarez (Antsiranana), NW Madagascar (Besairie, Reference Besairie1932). Three species of Penaeidae (Ambilobeia karojoi Garrasino and Pasini, 2002; Ifasia dagascariensis (Van Straelen, 1933); Ifasia straeleni Garrasino and Teruzzi, Reference Garassino and Teruzzi1995) have been reported from this area. In addition to the specimens from Madagascar, only one other Early Triassic decapod, Litogaster turnbullensis, which was identified by Schram (Reference Schram1971) based on a single isolated specimen from the Thaynes Group of southeastern Idaho, USA, has been documented until now. However, this specimen was found in a neighboring locality of Paris Canyon and is early Spathian in age. Therefore, this specimen is likely another component of the Paris Biota that is known to extend throughout the northern part of the western USA basin (Smith et al., Reference Smith, Laville, Fara, Escarguel, Olivier, Vennin, Goudemand, Bylund, Jenks, Stephen, Hautmann, Charbonnier, Krumenacker and Brayard2021). By doubling the number of known Early Triassic decapod taxa, the Paris Biota specimens significantly increase our knowledge on the diversity of this clade during this geological interval.
The two new Aegeridae taxa (Aeger sp. and Anisaeger longirostrus n. sp.) described in this work are both the earliest representatives of their respective genera and the earliest representatives of Aegeridae. They thus extend the temporal range of these genera and this family back into the Early Triassic (Fig. 11). These occurrences of aegerids, which are 5 Ma older than previously reported, are all the more important because this family has been suggested as a basal group within Penaeoidea (Burkenroad, Reference Burkenroad1963, Reference Burkenroad and Schram1983; Tavares and Martin, Reference Tavares, Martin, Schram and von Vaupel Klein2010). With the isolated Famennian (Devonian) specimen of Aciculopoda mapesi Feldmann and Schweitzer, Reference Feldmann and Schweitzer2010, and the previously mentioned Malagasy Penaeidae, for which the dating is rather poorly constrained (Marramà et al., Reference Marramà, Lombardo, Tintori and Carnevale2017; Laville et al., Reference Laville, Smith, Forel, Brayard and Charbonnier2021), the Paris Biota specimens represent some of the oldest occurrences of Dendobranchiata (Schram, Reference Schram1977, Reference Schram1980; Schram et al., Reference Schram, Feldmann and Copeland1978; Feldmann and Schweitzer, Reference Feldmann and Schweitzer2010). They therefore fill-in an important gap in the history of this group, from which present-day representatives are well studied for their economic interest (Farfante, Reference Farfante1988; Cervantes-Hernández et al., Reference Cervantes-Hernández, Gómez, Serrano, Cruz and Berumen2010; Robalino et al., Reference Robalino, Wilkins, Bracken-Grissom, Chan and O'Leary2016; Fernández de Alaiza García Madrigal et al., Reference Fernández de Alaiza García Madrigal, Silva, Tavares and Ballester2018), but whose origin remains elusive.
Updated stratigraphic ranges of the decapods studied here.

Pemphix krumenackeri n. sp. extends the temporal range of Pemphicoidea by over 2 Myr back into the Early Triassic (Fig. 11), and expands its spatial distribution to the American continent, as up till now this family was only known from the Middle–Late Triassic of Europe (Amati et al., Reference Amati, Feldmann and Zonneveld2004; Karasawa et al., Reference Karasawa, Schweitzer and Feldmann2013; Schweitzer and Feldmann, Reference Schweitzer and Feldmann2014). The temporal extent of Glypheidea was thought to extend from the Early Triassic to nowadays. However, only one specimen (L. turnbullensis, described by Schram in 1971) was reported from the Early Triassic, leaving some uncertainty as to the actual origin of this group. The co-occurrence of Pemphix krumenackeri n. sp. and Litogaster turnbullensis in the Paris Biota confirms the appearance and diversification of Glypheidea as soon as the Early Triassic.
Diversification trends during the Triassic
The decapods of the Paris Biota significantly increase the known diversity of Early Triassic decapods, and therefore provide new insights into the Triassic diversification of this clade. We discuss the latter using a compiled and revised list of Triassic decapods (Table 5; Supplementary file 3).
A first comparison can be made between our dataset and other available Triassic decapod datasets, such as the Paleobiology Database (PBDB; search “Decapoda, Triassic”, downloaded on June 18th, 2021; Table Supplementary file 4). At first, it appears that the two datasets are rather similar in terms of decapod taxonomic richness (PBDB: 63 species and 20 higher rank taxa; Supplementary file 5; our dataset: 74 species, including the 3 new ones from the Paris Biota). However, 29 taxa reported in our dataset (>40% of the total, the newly described taxa excluded) do not occur in the PBDB dataset (Supplementary file 6), implying the latter is still incomplete. Additionally, a third of the species listed in the PBDB dataset are incorrectly recorded (Supplementary file 5). Most of these records concern the temporal range of taxa (e.g., Jurassic, Cretaceous, and even Paleocene occurrences are registered as being Triassic; Supplementary file 5). Some other issues, such as synonymy mistakes, invalid taxa, and even some microcoprolites registered as valid decapod species, also have been noticed (Supplementary file 5). It thus appears that the PBDB Triassic decapod dataset is inadequate to analyze Decapoda diversity trends throughout the Triassic.
Based on our dataset at the epoch scale, decapods apparently underwent an important diversification throughout the Triassic (Fig. 10.1). However, at the stage scale (Fig. 10.2), this trend is more contrasted, with the Anisian and Norian being the most diverse stages. This differential pattern likely results from heterogeneity of the decapod fossil record and sampling effort. Indeed, very few sites have been intensively sampled comparatively to the majority of them (e.g., in southwest of Germany and Guizhou Province of China for the Anisian, and in the Italian Lombardy region for the Norian). Additionally, certain time intervals are much better represented than others, with more known fossiliferous localities.
Based on αm, the Triassic decapod diversification trend significantly differs from that observed on the raw richness at all taxonomic ranks (Fig. 10). At the epoch scale, whereas the taxonomical richness gradually increases (Fig. 10.1), αm at each taxonomical level remains rather constant throughout the Triassic (Fig. 10.6). At the stage scale, whereas the Olenekian appears to be the poorest Triassic stage and the Anisian appears to be the richest (Fig. 10.2), the Olenekian exhibits αm comparable to that of the Anisian and lower than that of the Norian (Fig. 10.6). These differences illustrate how the heterogeneity of the fossil record can strongly bias observed diversity trends. Evolution of the apparent decapod mean alpha diversity (αm) throughout the Triassic (Fig. 10.5, 10.6) can be interpreted in two ways:
(1) If considered that the taxonomy and systematics of Triassic decapods remain too amiss - then any apparent diversity trend should be considered hardly interpretable. The Triassic decapod taxonomy and systematic inaccuracy likely originate from the scarce occurrences of Triassic decapods that led to important knowledge gaps. Such poor fossil record is not specific to decapods (Twitchett, Reference Twitchett2001; Muscente et al., Reference Muscente, Schiffbauer, Broce, Laflamme, O'Donnell, Boag, Meyer, Hawkins, Huntley, McNamara, MacKenzie, Stanley, Hinman, Hofmann and Xiao2017), implying that similar hiatus likely exist for other organisms
(2) If considered that the taxonomy and systematics of Triassic decapods are reliable and the data is accurate (such assumption can only be asserted after having carefully studied the corresponding literature) - then no increase in alpha diversity is documented for the Triassic decapods (Fig.9. 5-6). Additionally, it appears that decapods were already well diversified as soon as the Early Triassic (at least relatively to what is actually known from the rest of the Triassic). This contrasts with the generally assumed model of a delayed post-PTB biotic recovery of Early Triassic marine organisms (e.g., Chen and Benton, Reference Chen and Benton2012).
Ultimately, neither of these interpretations supports a delayed post-PTB biotic recovery scenario for decapods.
Conclusions
The Paris Biota offers an exceptional window into Early Triassic marine ecosystems. This is all the more important as the Early Triassic is assumed to be the time interval during which the Modern evolutionary fauna arose, and thus, to be the time of diversification of many modern clades, including decapods (Sepkoski, Reference Sepkoski1981).
Among the Paris Biota Dendrobranchiata, Aeger sp. and Anisaeger longirostrus n. sp. extend the temporal range of their respective genera by 5 Myr back into the Early Triassic. Additionally, they represent the oldest known specimens of Aegeridae, also extending the temporal range of this family by 5 Myr back into the Early Triassic. In fact, if not for Aciculopoda mapesi Feldmann and Schweitzer, Reference Feldmann and Schweitzer2010, that was described based on a single poorly preserved specimen, and the poorly age-constrained Malagasy specimens, the Paris Biota Aegeridae represent the oldest Dendrobranchiata currently known, thus providing a new anchor point for future studies on this group.
Regarding the Paris Biota Pleocyemata, the newly sampled specimens of L. turnbullensis, previously known from a single isolated and disarticulated specimen, confirm the existence of this taxon as soon as the Early Triassic, and, more specifically, as soon as the early Spathian. Pemphix krumenackeri n. sp. represents the oldest known species of its genus and of the superfamily Pemphicoidea, extending their temporal ranges by about 2 Ma into the Early Triassic. In addition, Pemphix krumenackeri n. sp. is now the co-oldest Glypheidea known, with L. turnbullensis.
The co-occurrence of these decapods in the Paris Biota provides evidence for an early diversification of this group, as soon as the early Spathian. This is congruent with available decapod phylogenies and diversification models that argue for a Triassic diversification of these groups (Gherardi et al., Reference Gherardi, Souty-Grosset, Vogt, Diéguez-Uribeondo, Crandall, Schram and von Vaupel Klein2010; Lavalli and Spanier, Reference Lavalli, Spanier, Schram and von Vaupel Klein2010; Schweitzer and Feldmann, Reference Schweitzer and Feldmann2014; Robalino et al., Reference Robalino, Wilkins, Bracken-Grissom, Chan and O'Leary2016; Wolfe et al., Reference Wolfe, Breinholt, Crandall, Lemmon, Lemmon, Timm, Siddall and Bracken-Grissom2019). In addition, all the Paris Biota taxa extend the Triassic spatial range of their respective genera and/or family (that were up to now only known from Europe and Asia) to the North American continent. This suggests transoceanic dispersals for these taxa, which is a feature observed in other clades at least transiently during the Early Triassic (e.g., ammonoids—Brayard et al., Reference Brayard, Bucher, Escarguel, Fluteau, Bourquin and Galfetti2006; Jattiot et al., Reference Jattiot, Bucher, Brayard, Monnet, Jenks and Hautmann2016; thylacocephalans—Laville et al., Reference Laville, Smith, Forel, Brayard and Charbonnier2021; marine vertebrates—Tintori et al., Reference Tintori, Hitij, Jiang, Lombardo and Sun2014). Another interpretation could lie in the incomplete knowledge of an otherwise cosmopolitan decapod distribution during the Triassic.
The description of the Paris Biota specimens also led to a taxonomic and systematic revision of Triassic decapods, highlighting the significance of this biota in the debates on the Early Triassic recovery and on the rise of the modern ecosystems. Using a refined dataset of known Triassic decapod taxa that strongly differs from that of the PBDB, we showed that: (1) the apparent increase in decapod taxonomic richness throughout the Triassic mainly results from the heterogeneity of the fossil record and/or the sampling intensity; (2) Decapoda alpha diversity was relatively high as soon as the Early Triassic; and (3) Decapoda alpha diversity seems to have remained rather constant throughout the Triassic. A considerable amount of sampling, taxonomic and systematic work on Triassic decapods remains to be done if we are to understand the early diversification of decapods and the underlying processes. However, we hope the present contribution will constitute one step further in that direction.
Acknowledgments
We thank N. Goudemand, E. Vennin, P. Guenser, D. Stephen, and L.J. Krumenacker for their help during fieldwork. We also acknowledge D. Audo and M. Hyžný for their constructive comments on an earlier version of the manuscript. This work was supported by the ANR project AFTER (ANR-13-JS06-0001-01) and the French “Investissements d'Avenir” program, project ISITE-BFC (ANR-15-IDEX-03). We acknowledge the Bear Lake County road department and D.M. Clow (Ogden) for allowing access to the studied exposures at Paris Canyon. We thank the BLM (Permit N-094706) and US Forest Service (Caribou National Forest, Special Use Permit CT5.01) for allowing access and collection at the NoName and Stewart Canyon sites. The Winecup Gamble Ranch is thanked for allowing access to the Immigrant Canyon site. Sample management and valorization benefited from ANR-11-INBS-0004-RECOLNAT.
Data availability statement
Data available from the Dryad Digital Repository: https://doi.org/10.5061/dryad.hmgqnk9jp.