

INTRODUCTION
No one fails to notice patterned recurrence, from the emergence and departure of the sun each day to like-in-kind events of daily life. The measurement of time, and calendars that track it, are built on this notion and so instantiate a cyclic time construct. Linear or unidirectional time, too, is a universal experience, in recurring patterns of event sequences; calendars represent it in terms of cyclically repeating units, some being cycles (multiples) of smaller units – days within months, months within years, years within decades, then centuries, then millennia. In such representations, incorporating cyclic and linear patterns within a single mutually consistent structure, the salience of the distinction can seem subtle.
This paper suggests that Mesoamerican daykeepers anticipated the dates on which solar and lunar eclipses might occur using what I call an “eclipse-family” construct, and that the eclipse table of the Dresden Codex instantiates this practice. This representation for the timing of eclipses is intriguing in that eclipse families are temporary concurrent cycles, each only partly overlapping with any other in linear time. At any time, between 12 and 14 lunar eclipse families and between nine and 11 solar families were in progress in Mesoamerica; daykeepers would have been monitoring the progress of more than 20 overlapping cycles. Eclipse families differ structurally from the cycles that were formalized into calendrical units: each month is followed by another, each year and each katun by another; but every eclipse family comes into existence at a fixed point in history and, within about two centuries, dies out while its contemporaries live on. In this respect, like the Babylonian Saros, eclipse families are an interesting category within cognitive anthropology as an unambiguously cyclic conceptualization for the unfolding of recurring events.
BACKGROUND TO THIS STUDY
The eclipse table of the Dresden Codex (Figure 1) is by far the most significant pre-Columbian document reflecting indigenous Mesoamerican eclipse theories, and one of the most detailed and compelling documents concerning indigenous Mesoamerican astronomical knowledge within a calendrical framework. Bricker and Bricker's (Reference Bricker and Bricker2011:249–366) monumental treatment is an accessible and thorough exposition of its calendrical structure, and critically reviews the most relevant literature. For the work reported here, Lounsbury's (Reference Lounsbury1978:789–804) discussion is the crucial source because it establishes the intended DC dates and interstation intervals of the body of the table, which form the basis for this study. (The date of each station in the table is recorded in three ways: directly in the DC, in days since the base date of the table, and in days since the preceding date. Lounsbury shows that no record is three ways inconsistent, and identifies as intended placements those recorded in two or all three representations; DC dates prove to be the most reliable. Lounsbury's resolution of this issue is generally accepted [see for example Bricker and Bricker Reference Bricker and Bricker1983:1]).
The eclipse table of the Dresden Codex, pp. 51a–58b. The pages are read in sequence across the top halves of each page (pp. 51a–58a), then across the bottom halves (pp. 51b–58b). The top of the first two pages is the table's “preface”; the remaining pages are the “body” of the table, or the “table proper.” Photographs courtesy of the Sächsische Landesbibliothek - Staats- und Universitätsbibliothek Dresden (http://www.slub-dresden.de/sammlungen/handschriften/maya-handschrift-codex-dresdensis/). Individual pages joined and contrast digitally enhanced by author.

Förstemann (Reference Förstemann1891, Reference Förstemann1901) demonstrated that pages 53a–59a and 51b–59b of the Mayan screenfold manuscript in Dresden’s Königliche Sächsische Landesbibliothek present a table of 69 successive Mayan dates, most of them separated from the preceding date by five or six lunations (hereafter, usually “months”). Bowditch (Reference Bowditch1910:211–225) corrected and summarized the data, and listed for each station its distance into the table in terms of average lunations. Robert Willson (Reference Willson1924), an astronomer at Harvard University, seems to have been the first to recognize these pages as eclipse related. While scanning Bowditch's table, probably early in 1912, he noticed the entry 6585.32 for its 38th station; recognizing it as the 223-month saros interval, a key construct in Babylonian and Greek eclipse theory, he immediately concluded that these pages concerned eclipses (Willson Reference Willson1924:9).
A 223-month interval is within half a day of the time it takes for the moon to pass from one point where it crosses the plane of the earth's orbit around the sun (a node of the moon's orbit) to another, 38(!) times; it is near dates of nodal passages that solar and lunar eclipses occur. The table's complete span of 405 months is very close to that of 69 nodal passages.
The 405-month length of the eclipse table is also equal to 46 passes through the DC, to within about one-ninth of a day. Almost all Mayan almanacs are structured in terms of DC dates, and the length of the eclipse table seems universally accepted as a direct commensuration of 405 months with 46 × 260 days based on this near equivalence. Evidence presented in this paper supports a version of this hypothesis, mediated by a shorter and less precise, but more broadly useful, commensuration of 88 months with 10 × 260 days.
This study explores the properties and the interpretive consequences of a construct I refer to as an “eclipse family,” a representation for the timing of eclipses that emerged in my recent work on patterns of recurrence of lunar eclipses in the DC (Justeson Reference Justeson, Dowd and Milbraith2015:335–341). Applying an eclipse-family representation depends on adopting one of two interpretations for the general function of the eclipse table.
One interpretation is that the table concerns eclipse stations—dates on which daykeepers might expect a solar or lunar eclipse to be seen. The fullest and most rigorous modern analysis from this perspective is due to Lounsbury. This line of interpretation has been based largely on analysis of the body of the table (the “table proper,” pp. 53a–58a and 51b–58b), and on a seeming correspondence of intervals among its stations to intereclipse intervals, exemplified by the saros interval of 223 months.
An alternative interpretation is that the table concerns eclipse seasons, which are spans associated with nodal passages, during which solar and/or lunar eclipses might be seen. The fullest and most rigorous analysis from this perspective is due to Harvey and Victoria Bricker. It is founded crucially on the table's preface (pp. 51a–52a), associated with an interpretation of the long count date 9.16.4.10.8, universally accepted as the formal base of the table, as also the intended historical base date of the table proper. For proponents of a Goodman-family correlation, this date falls in November of 755 c.e., about 16 days after the nodes; such a placement for the table's base precludes an eclipse station interpretation.
This paper undertakes an application of the eclipse-family framework to the interpretation of the eclipse table. As a representation specifically for the timing of eclipses in the DC, it can be applied only (or most) straightforwardly under an assumption that the eclipse table's calendrical stations approximate the dates on which an eclipse might take place. The results of this application yield independent evidence supporting the eclipse-station framework for interpreting the table proper.
The analysis of the eclipse table presented here is anchored empirically in a survey of all lunar and solar eclipses worldwide between 100 b.c.e. and 1500 c.e., and analytically by applying the Mesoamerican-inspired calendrical construct of eclipse families to characterize the timing of eclipses in the pan-Mesoamerican DC. These two elements provide a basis for an interrelated set of interpretive results concerning this table. This paper argues that: (1) 55 identifiable “underlying” stations, and these alone, would have been considered by the table's designers as possible dates for an eclipse – the table's other 14 stations being contrived to fill in the pattern of a station every five or six months; (2) the formatting of the table's 69 lunar stations is designed so that the underlying stations would be identifiable by trained users; (3) the specific dates of these 55 stations were not determined by observation, but by a computing algorithm, based on a short-term equating of 17 months with 502 days (so these dates might depart by a day or so from the actual date of new or full moon); (4) the table's stations were intended to characterize the timing of solar and not of lunar eclipses (this conclusion not being unique to this paper); (5) the table was intended to characterize the timing of solar eclipses only within a single pass through the table, most likely from April 1083 c.e. to January 1116 c.e.; (6) less securely, Lowland Mayan daykeepers probably made conscious use of some form of eclipse-family construct to characterize and to anticipate the dates of eclipses.
ECLIPSE FAMILIES: A MESOAMERICAN CALENDRICAL MODEL FOR ECLIPSE RECURRENCE
The pan-Mesoamerican DC of 260 days was the key framework for calendrical divination, prognostic and diagnostic, throughout Mesoamerica in pre-Columbian times. Lowland Mayan screenfold manuscripts are overwhelmingly laid out in terms of this calendrical cycle and repetitions of it. In the Dresden Venus table, for reasons discussed below, this involves a commensuration of the DC cycle with the indigenous 365-day year; in its eclipse and Mars tables, dates are recorded exclusively in the DC.
Absent compelling evidence to the contrary, I take it as axiomatic that Lowland Mayan eclipse theory emerged from local eclipse observations, or from a more broadly Mesoamerican eclipse theory based on Mesoamerican eclipse observations. This paper therefore analyzes the patterns of eclipse occurrence in the DC by evaluating all eclipses in the 1600 years from 100 b.c.e. to 1500 c.e. for their visibility in Lowland Mayan territory. The data on which these judgments are based are from the National Aeronautics and Space Administration's (NASA) lunar and solar eclipse canons (Espenak and Meeus Reference Espenak and Meeus2006, Reference Espenak and Meeus2009); the Appendix details how I have evaluated observability in this region.
In my recently proposed eclipse-family representation for the timing of eclipses, an interval of 88 months is the key to a simple procedure that daykeepers could have used to anticipate every lunar and every solar eclipse visible in Mesoamerica.Footnote 2 The eclipse-family construct emerges straightforwardly from cataloguing eclipses observable (see Appendix) by Lowland Mayan daykeepers. It is valid in the tropics, at least within 21° of the equator, in the sense that every eclipse visible there would be anticipated; many eclipses visible only outside the tropics are not captured by it. Analysis of the stations in the Dresden eclipse table in terms of an eclipse-family representation of eclipse dates yields direct and indirect evidence that Mayan daykeepers operated with some such construct, and that the table was designed to anticipate solar eclipses specifically. Calibrating the table's stations to an eclipse-family representation permits a placement of the table in historical time.
Structural Properties of Eclipse Families
Eclipses occur when a full moon or new moon occurs within a few days of a date of nodal passage, when the moon crosses the plane of the earth's orbit around the sun. Nodal passages average 173.30906 days apart (Gingerich Reference Gingerich, Stahlman and Gingerich1963:xv); this figure, confirmed by linear regression over eclipse dates in the 1,600 years of the survey, is critical for understanding the timing of eclipses in terms of the DC and, more specifically, in terms of the temporal relationships among eclipses that are captured by an eclipse-family representation.
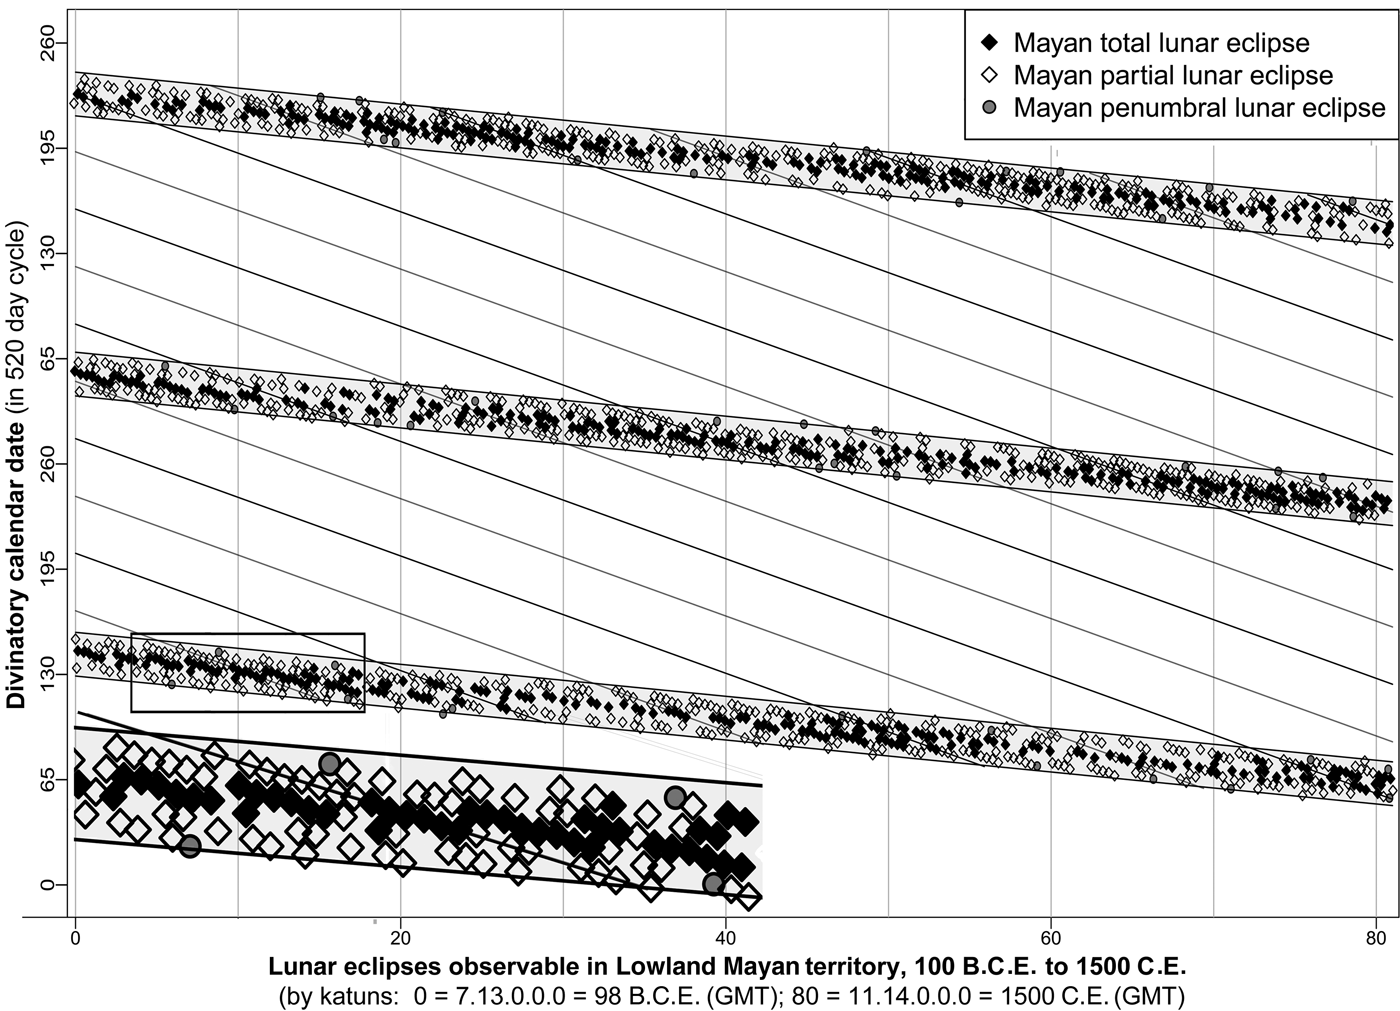
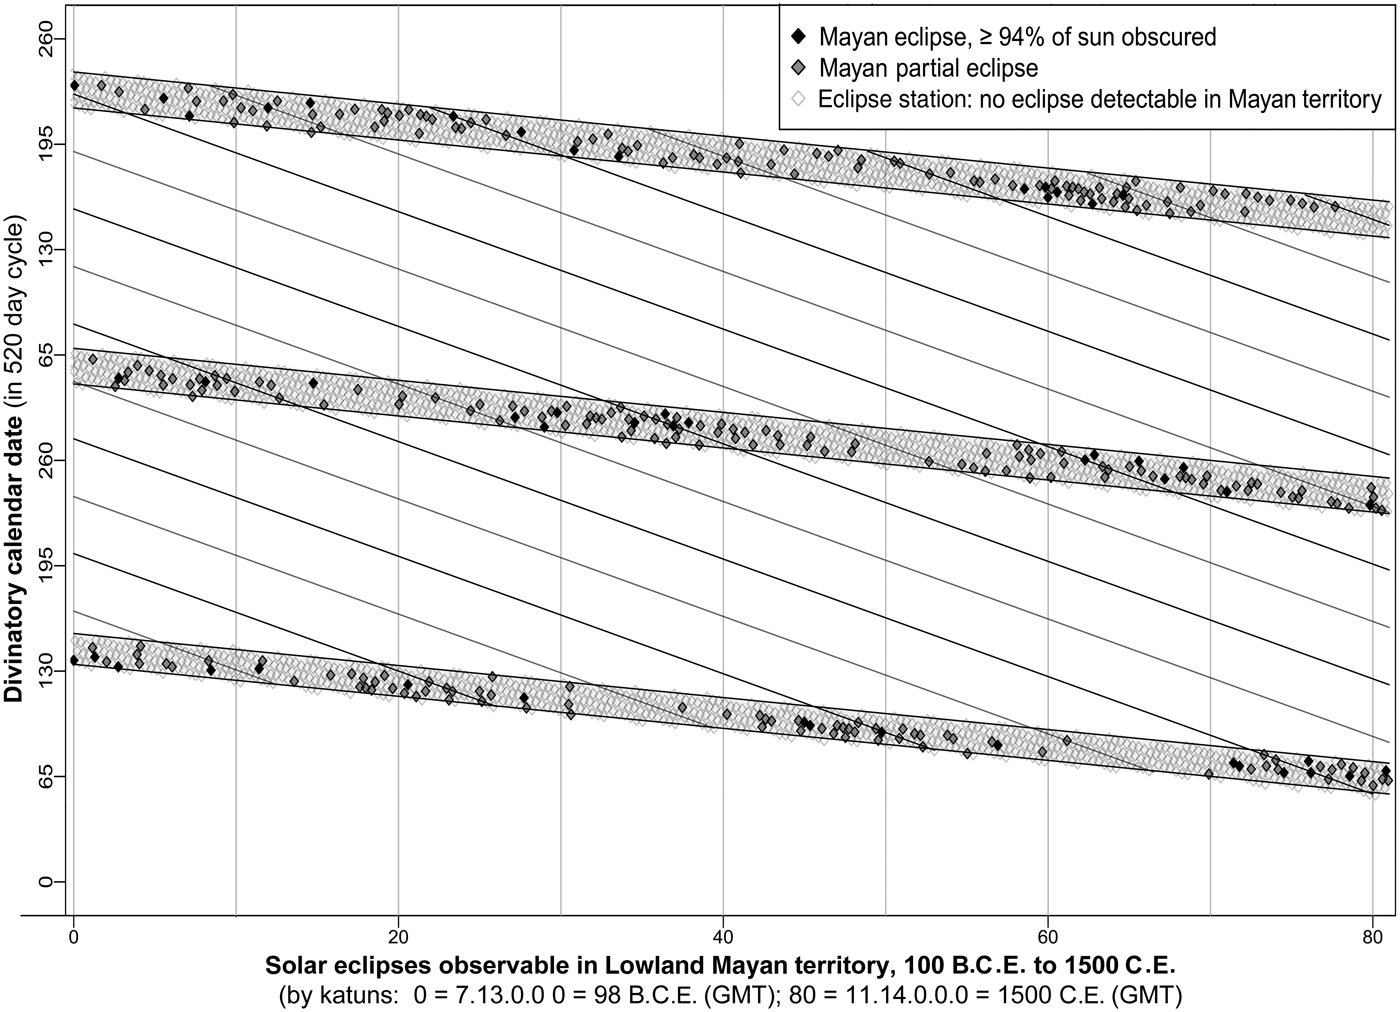
One property of the timing of eclipses in the DC is well-established and long known: eclipses are restricted to just three relatively narrow zones in this calendar (see Figures 2 and 3). This follows from Teeple's (1930:90) observation that three passes through the nodes of the eclipse cycle closely approximate two passes through the DC: 3 × 173.30906 days = (2 × 260) − 0.07282 days. Because the discrepancy is so small, the DC date of nodal passage in each of the three zones is quite stable in the short term, shifting earlier only very gradually; they recede at a rate of one day per 7,140.895 days (= 520 / 0.07282). This trend emerges clearly in the figures. The dates of nodal passage fall near the center of each eclipse zone, reflected in the figures by the concentration of total eclipses in that region. The DC dates of the eclipses, however, vary within these zones across more than 26 days (see below).
Distribution of lunar eclipses visible in Lowland Mayan country, 100 b.c.e. to 1500 c.e. Diamonds mark the date in the divinatory calendar of a lunar eclipse that occurred at the corresponding position in a katun count; the starting point is effectively arbitrary, but it is chosen so that the zero point corresponds to the date 7.13.0.0.0 in a Goodman-family correlation. Bounds mark the earliest and latest possible dates that would be projectable based on the full 1,600 years of this sample; see text for the calculation. Divinatory calendar (DC) dates are represented with fractional values, projected using a correlation constant of 584,284.25, which gives the same DC date, when rounded down, to hours between late afternoon and early morning. Data from Espenak and Meeus Reference Espenak and Meeus2006; graph by Adam Gordon.

Distribution of solar eclipses visible in Lowland Mayan country, 100 b.c.e. to 1500 c.e. Diamonds mark the date in the divinatory calendar of a solar eclipse that occurred at the corresponding position in the katun count; the starting point is effectively arbitrary, but it is chosen so that the zero point corresponds to the date 7.13.0.0.0 in a Goodman-family correlation. Lines join diamonds corresponding to dates in every sixth solar eclipse family, at intervals of 88 months or roughly 2,600 days. Bounds mark the earliest and latest possible eclipse dates that would be projectable based on the full 1,600 years of this sample, implemented by continuously reducing both limits at the calculated average rate of recession of one day per 7140.895. DC dates are represented fractionally, with the fractional part corresponding to the time of day between midnight and midnight, using a correlation constant of 584,283.75. Graph by Adam Gordon.

A far more restrictive pattern for the timing of eclipses in the DC, to within two days, is captured by their eclipse-family representation; this pattern emerges most clearly in Figure 2. The data are from a survey of all lunar eclipses from 100 b.c.e. to 1500 c.e. Each lunar eclipse family, a series of lunar eclipses occurring every 88 months for nearly two centuries, is recognizable in the figure by the linear pattern of eclipse stations that occur in visually close succession within these zones. Successive stations in a family average 1.3083 days earlier in the DC (see below), and range between zero and two nights or days earlier. In each zone, at any given time, the eclipse stations in a more recently established family have later dates than those in previously established families.
The data differ from those in my earlier (Justeson Reference Justeson, Dowd and Milbraith2015) 1,000-year survey, in which lunar eclipses were treated as visible provided they were of magnitude 0.25 or greater. This criterion was used because a colonial Zapotec document suggests that a lunar eclipse of that magnitude was either observed or anticipated (Tavárez and Justeson Reference Tavárez and Justeson2008:77). This criterion was too restrictive, however; all umbral lunar eclipses are observable, whatever their magnitude, as are even some penumbral eclipses (see Appendix).
Lunar eclipse families
A lunar eclipse family is a sequence of full moons, each separated from its predecessor by 88 months, on some of which a lunar eclipse would be visible in Mesoamerica. The inset in Figure 2 highlights a striking example of such a family. Overlapping diamonds along the regression line in the inset represent eclipses visible in Lowland Mayan territory 88 months apart. Starting with a lunar eclipse on the morning of August 27, 44 c.e. and ending with one on the morning of February 23, 137 c.e., a series of 14 lunar eclipses took place, one every 88 months without exception. This series forms only a part of its eclipse family. The first eclipse in this family visible in Lowland Mayan territory took place two stations earlier, on the morning of June 4th, 30 c.e.; at the next station, 88 months later, no eclipse was observed, though one was observable not far to the east. After the eclipse of 137 c.e., lunar eclipses were visible in this territory on six of the next 10 stations. All told, 21 lunar eclipses were observable by Lowland Mayan daykeepers among 29 stations at 88-month intervals in an eclipse family lasting 199 years, from 9 to 208 c.e.
In only three families were this many lunar eclipses visible in this territory between 100 b.c.e. and 1500 c.e., but the 100 families that began and ended during this period averaged 14.41 visible eclipses, and 30 percent had 17 or more. During this era, out of 1,481 visible eclipses that are eventually followed by another in their family, more than 66 percent (981) are followed by another at the next station in the family, exactly 88 months later, and 94 percent (1,398) are followed by another within three stations. On average, lunar eclipses within a single family and observable by Mayan daykeepers occur 1.60 stations apart.
Since successive stations in any eclipse family appear a constant 88 months apart, the DC dates in every eclipse family recede at the same average rate, 1.3083 (= 10 × 260 − 88 × 29.530587) days per station; the recession lines for each family are therefore parallel in principle. Corresponding stations in successive families – those stations with the closest DC dates – occur 405 months apart, exactly the span of one complete pass through the Dresden eclipse table; the date in the successor family shifts, on average, 0.1123 (= 46 × 260 − 405 × 29.530587) days earlier, while the preceding and following stations average more than a day later or earlier. Conversely, any two eclipses separated by 405 months are, in this sense, corresponding members of successive eclipse families.
Solar eclipse families
Within a limited geographic region, lunar eclipses are observed far more commonly than solar eclipses, so would have provided Mayan daykeepers the most evidence for the structure of eclipse families. Solar eclipse families have the same general structural properties as lunar eclipse families; see Figure 3. In Mayan territory, however, the widths of the zones of observable lunar eclipses are wider than those for solar eclipses.
Eclipse Zone Widths and Their Consequences
Empirical data on Mayan eclipse zone widths
Figures 2 and 3 illustrate that the DC dates of eclipses within a family recede at a faster rate than does the zone within which they occur; accordingly, while the three eclipse zones continue indefinitely, every eclipse family in each zone is born and dies out. Because successive stations in a family occur at fixed intervals, the life span of each family depends on the width of the zone in which it occurs.
Eclipse zone widths can be calculated as follows. The rate of recession of the nodes, and therefore of each eclipse zone as a whole, is shown above to be one day per 7,140.895 days. For each observable eclipse, to which a fractional valued DC date is assigned that is specific to the time of day of the eclipse at maximum obscuration, a corresponding DC date can be projected to any standard point in linear time, such as the arbitrary zero-point in the katun count (at 7.13.0.0.0 in a Goodman family correlation) of Figures 2 and 3. The corresponding DC at this standard point equals its distance from the standard in days divided by 7,140.985 plus the DC date of the eclipse. The difference between the minimum and maximum values projected back to the standard date in each zone yields an analytical solution for that zone’s width in days and hours across the 1,600 years of the survey.
Mesoamerican daykeepers had positive evidence for the minimum width of solar and lunar eclipse zones from the observed eclipses that were at the outer margins of those zones. Adjusting for the drift of these zones in the DC, for the 1,557 total and partial lunar eclipses that could be observed by Lowland Mayan daykeepers from 100 b.c.e. to 1500 c.e., and another 30 family-initial or family-final penumbral eclipses of umbral magnitude −0.06 or higher (see Appendix), the three zones are of comparable widths, at 25.60, 26.24, and 26.41 days. The 620 total lunar eclipses observable in this period are concentrated in the central part of each zone; the zones of total eclipses are 13.70, 12.25, and 14.68 days wide.
For the 430 solar eclipses that I judge to be observable in this era, the widths of the eclipse zones are quite a bit narrower – 18.40, 20.82, and 21.48 days. I suppose that the greater apparent variation in the widths of solar than of lunar eclipse zones is due largely to the much smaller number of solar eclipses observable locally.
Relative to the eclipse zone rather than the DC, the effect of the recession in the DC of −1.3083 days per station is partly offset by the recession of the nodes and, therefore, of the eclipse zone itself; within the zones, and relative to the nodes, the recession per station amounts to −0.9444 (=−1.3083 + [88 × 29.530587 / 7140.895]) days.
Mayan observations and conceptions about eclipse zone widths
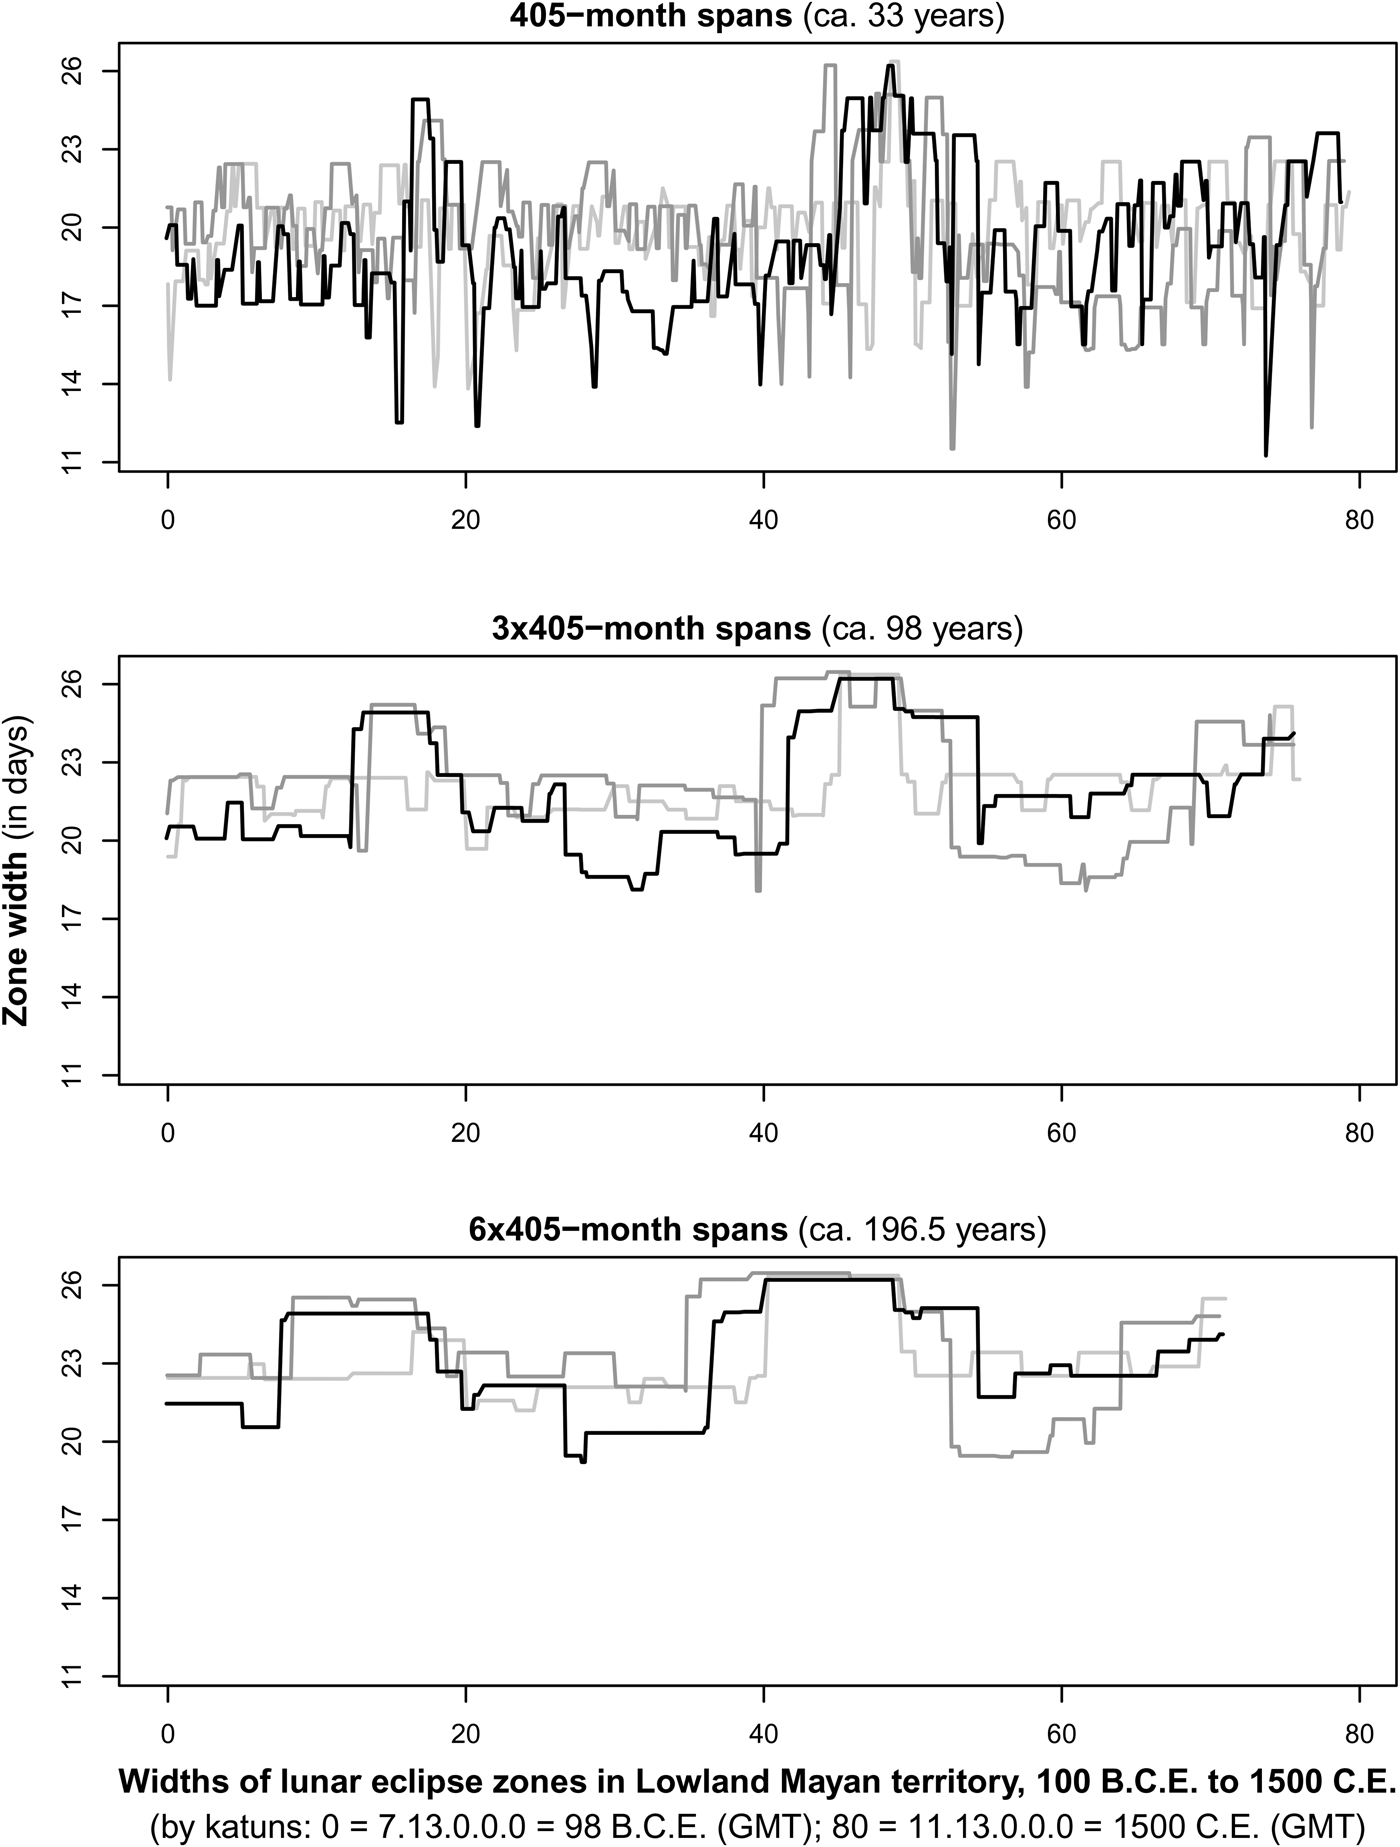
Daykeepers would have been operating with less than 1,600 years of observational data and their understandings must have evolved with observational experience. The data in Figure 4 show that not until the ninth century would they have had observational evidence that any lunar eclipse zone was as much as 26 days wide. A century of observation from about 880 to 980 c.e., however, would have shown that all three lunar eclipse zones were about 26 days wide (see Figure 4b). Even earlier, though, observations over two or three spans of 405 months – potentially just two generations of daykeepers – would have shown that each eclipse zone was sometimes the widest and sometimes the narrowest. Given this variability, the only prudent course would have been to treat all eclipse zones as having the potential width of at least the largest attested.
Estimated empirical lunar eclipse zone widths over time. Lines representing the widths for the upper zone of Figure 2 are black, for the middle zone dark grey, and for the lower zone light grey. Zone widths are registered at the starting date of observation. The width attributable observationally to each zone depends on the period of observation; for longer periods, from any starting point, the calculated width of any zone is no narrower than over a shorter period from the same starting point. Results are for a period of 405 months (the length of the Dresden eclipse table), and multiples thereof. The span of 3 × 405 months approximates that of observations by 3 generations of daykeepers from ages 20 to 50 years. The span of 6 × 405 months would reflect longer-term historical records. Data are analytic estimates using fractional arithmetic. Graphs by Adam Gordon.

Accordingly, the remainder of this section reports analytic results using an assumption of uniform zone widths. This width is determined by projecting the earliest and latest limits of each zone to the others, adjusted to era and selecting the highest of the maxima and the lowest of the minima. The eclipses that are criterial for the upper and lower limits depend on how early are the records upon which the daykeepers based their models.
For lunar eclipses, over the 1,600 years of the survey, the upper criterion is set by the magnitude −0.0444 penumbral eclipse of August 12, 873 c.e., if noticeable penumbrals were considered criterial, and otherwise by the partial eclipse of August 23, 891 c.e. The lower criterion is set by the partial eclipse of March 31, 888 c.e. Including penumbrals, the uniform zone widths are 27.19 days; including only umbral eclipses, they are 26.73 days wide.
For solar eclipses, the upper criterion is set by the partial eclipse of September 10, 1048 c.e., the lower by that of March 1, 192 c.e.; including only Classic dates, after ca. 200 c.e., the criterial eclipse for the lower bound is that of March 1, 713 c.e. The more inclusive bounds expand the hypothetical widths of solar eclipse zones to 24.31 days using actual eclipse dates, or to 24.16 days using average placements of eclipse stations; the more restrictive Classic period bounds – to me, more plausible – yield corresponding zones of 22.79 or 22.41 days.
Spans separating beginnings and ends of eclipse families
A span of 135 months is equal to 23 internodal intervals plus 0.5209 days, and ranges between 1.274 days later and 0.294 days earlier, so it always reaches an eclipse station at about the same point in the internodal cycle; it shifts the DC, on average, 173.371 days earlier. For eclipse zones of comparable widths, it therefore shifts from an eclipse station at an extreme position in its eclipse zone (beginning or ending a family) to one at or near the same extreme position of the next eclipse zone. This span therefore approximates the distance between corresponding extremes of eclipse families in different zones.
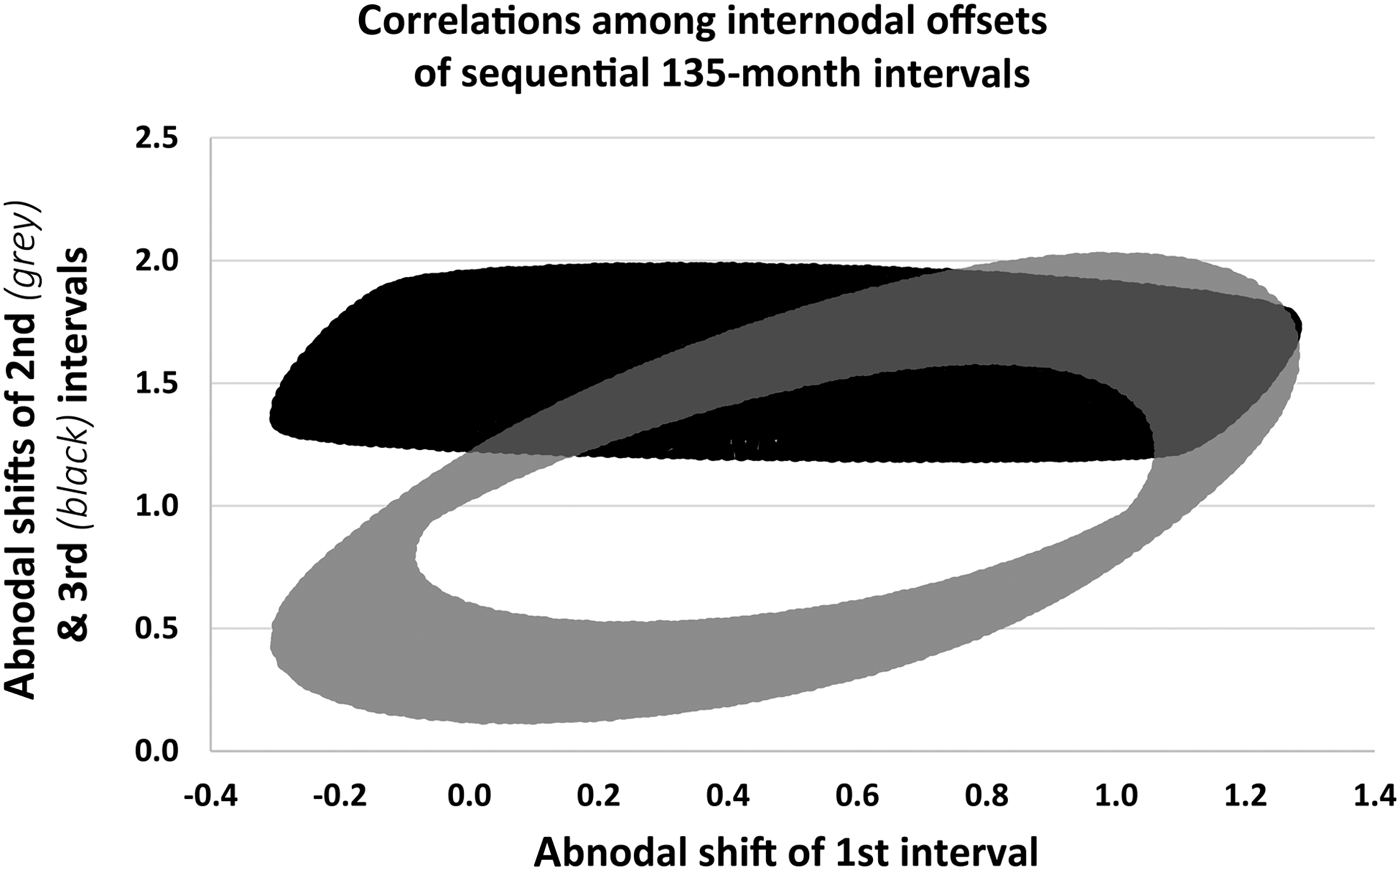
Eclipse stations decline relative to the nodes, and therefore to the analytic limits of the eclipse zones, on average by 0.9444 days per station; for average-based projections, the first and last station in a family must be within 0.9444 days of the upper (or lower) limit in the DC of that family's eclipse zone. Figure 5 graphs the actual cumulative offset relative to the nodes of one, two, and three successive 135-month intervals, based on every sequence of 135 new moons in the period of the survey. A shift of more than 0.9444 days in either direction will lie outside the projectable placement of an extreme eclipse station; on average, about half of the projections within 0.9444 days will also fall outside these limits. Estimating from this data, the overall proportion of 135-month intervals is about 43.3 percent.
Abnodal shifts after 135, 270, and 405 months. Graph by author.

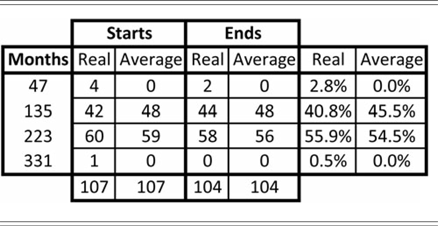
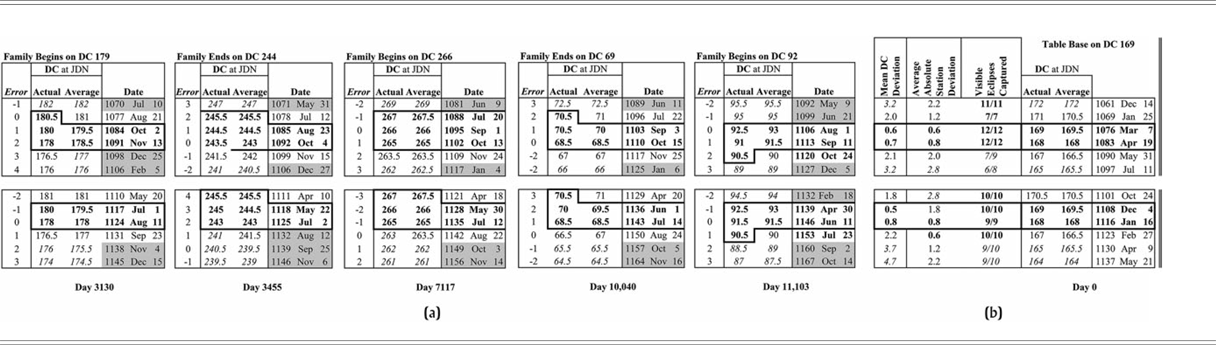
Since a 135-month interval shifts by 0.5209 days relative to the nodes, about 55 percent (= 0.5209 / 0.9444) of stations projected forward by 135 months should fall later than the eclipse zone, and the other 45 percent should reach the first station in a new family. From the last station, about 45 percent would reach the last station in another family, and 55 percent its next-to-last station. The data on the actual dates of the 104 first and the 107 last stations in each solar eclipse family from the 1,600 years of stations graphed in Figure 3 (from which daykeepers would have generalized) and from their average placements (what daykeepers would have projected) agree closely with these results (see Table 1). More broadly, 96.7 percent of actual stations and all projected initial and final stations are separated by intervals of 135 or 223 = 135 + 88 months. The variability among actual, but not projected, eclipse stations includes intervals of 47 = 135 − 88 or 331 (= 135 + [2 × 88]) months.
Intervals between successive first and successive last stations in solar eclipse families in Mayan territory between 100 b.c.e. and 1500 c.e. The “real” intervals are figured from the dates of attested eclipse stations, capturing the range of variability; “average” intervals are those that would be projected based on overall trends.

Figure 5 illustrates that an interval of 405 (= 3 × 135) months is offset by at least +1.21 days within an eclipse zone; it cannot be projected to lead from one extreme station to another, while intervals of 135 and 270 months commonly do so. The data in Figure 2 show that only once in 1,600 years do 405 (or fewer) months separate an extreme station in one family from one in the next. This takes place between March 25, 1457 c.e. and December 22, 1489 c.e., in the middle zone in Figure 2; neither eclipse was observable in Mayan territory.
Zone widths and the number of stations per family
The canonical number of stations in a family is n = 1 + zonewidth / 0.9444, rounded up; the computed range is from n to n − 1, occasionally extending to n + 1 if zonewidth / 0.9444 is only slightly less than an integer, or to n − 2 if it is only slightly more.
Empirically, with uniform zone widths, complete lunar families in the survey have up to 29 stations, solar families up to 26. Variation in the number of stations follow from the following considerations.
If the zone's width is w, and using average placements for eclipse stations, there are w / 0.9444 interstation intervals if the first or last station is right at the maximum DC date. There is one more station than the number of intervals. The fractional difference between the full zonewidth, w, and 0.9444 × (n −1), which is a fraction between zero and 0.9444, is the “play” for placing the full n stations in the zone; if the first station falls further into the zone than that fraction, there will only be n − 1 stations. If w / 0.9444 is slightly less than an integer, an earlier than average date for the first and a later than average date for the last can yield n + 1 stations; if w / 0.9444 is slightly larger than an integer, a later than average date for the first station and one earlier than average for the last can yield n − 2 stations.
Zone widths and the number of concurrent eclipse families
Given the recession rate of 1.3083 days per station, at any one point in time the average DC dates of successive eclipse families can be shown to lie 510/11 days apart, as follows. After 35 months, the DC date shifts, on average, by 1033.570556 − 4 × 260 = −6.429445 days, and the family in which this second eclipse occurs has shifted by −1.308318 × (35 / 88) = 0.520354 days; so the two regression lines lie 5.90909 = 510/11 days apart. This is the smallest shift within 88 months that falls within a month of the same date in the DC, so the two families are adjacent (and the second family in this case is the immediately preceding family). The same calculation can be applied to relate any two successive families, so this is the distance between successive regression lines. The distance between the earliest and latest of four families is therefore 178/11 days, for five families 237/11 days, and for six families 296/11 days.
The uniform width of lunar eclipse zones falls about halfway between the lower and upper limit for five families. It is narrower than required for six families by between 2.36 and 2.82 days, depending on whether penumbral eclipses are included or not, and wider than the lower limit for five families by between 3.09 and 3.55 days. Using separate empirical widths for each zone, all are at least 1.96 days wider than the minimum for five families and 3.14 days narrower than the minimum for six. Accordingly, in Mayan territory, four or five lunar eclipse families are in progress at any time. The shift from five to four families takes place after the last station in a family has occurred; the shift from four to five takes place when a new family begins. Close inspection of Figure 2 shows that five is indeed the maximum number of concurrent lunar eclipse families at any time in any zone.
Empirically, the widths of solar eclipse zones are consistent with a maximum of four eclipse families, dropping to three after a family dies out and returning to four when another is born. The narrowest zone is 0.67 days wider than the minimum for four families, and the widest is 2.15 days narrower than the lower limit for five; correspondingly, Figure 3 shows no instance of more than four families in any zone. For projected zones of equal width, Mayan models would agree with this if based on data since 200 c.e.: the zones would be 5.07 days wider than the minimum for four zones and 0.84 days narrower than the minimum for five. Using data back to 100 b.c.e., however, the zones would be 0.67 days above the minimum for five; in this case, daykeepers might have anticipated that five families could be occasionally be in place concurrently, though with no actual eclipse observations to confirm this.
Zone widths and interstation intervals
The widths of eclipse zones, and the intervals between them, determine the spacing between eclipse stations in linear time. For the empirical results reported in this paper, I calculate the effective widths of eclipse zones using the entire 1,600-year span of the data across all zones. These calculations necessarily use fractional days; daykeepers’ eclipse zones were presumably framed in terms of whole numbers of days and specific DC dates, so the results in this section are analytical approximations. The results are also reported in terms of actual eclipse dates rather than average placements; variability at the extremes makes these widths about one-sixth of a day larger than models projecting eclipse stations based on average lunations.
If an eclipse zone were as wide as one lunation, two eclipses could be seen one month apart; at these widths, six-month intereclipse intervals would alternate with one- and five-month intervals. Two eclipses are never seen one month apart from any point on earth, however, and, indeed, the zone widths in Mayan territory (Figures 2 and 3) are not this large.
For eclipse zones of 25.6 days or less, an interval of five months cannot lead from the earliest DC dates in one zone to the latest in the next, but for zones somewhat wider than this, intereclipse intervals are five, six, or 11 months long. Analytically, given the lunar eclipse zone widths attested in Mayan territory, about three to four percent of eclipse stations would be expected to follow another by five months, and about 11–12 percent at 11 months. Eclipses five months apart, however, occur furthest from the nodes and are rarely seen in the tropics. Only two (low magnitude) lunar eclipses out of 1,602 observable by Lowland Mayan daykeepers appeared at this interval: one of magnitude 0.043 on September 22, 880 c.e. followed by one of magnitude 0.005 on February 18, 881 c.e., and a detectable penumbral eclipse on October 2, 247 c.e. (umbral magnitude −0.0253) followed by a partial eclipse on February 26, 248 c.e. (magnitude 0.0684). Including penumbral eclipses of magnitudes as low as −0.075, a pair of penumbral eclipses were visible five months apart on October 24, 348 c.e. (umbral magnitude = −0.0072) and March 21, 349 c.e. (umbral magnitude = −0.0739). Daykeepers’ zone widths could have been narrower, presumably being based on far less than 1,600 years of data, but out of caution they might have operated with broader zones than their accumulated experience had documented.
Narrower than this, a five-month intereclipse interval is impossible; for zone widths between 21.9 and 25.7 days, intereclipse intervals alternate among 6, 11, and 17 months. Lunar eclipse zones are all somewhat wider than this, and solar eclipse zones fall within this range.
For uniform zone widths between 18.0 and 21.8 days, the alternations are among 6-, 17-, and 23-month groups. These widths are narrower than Mayan observational history calls for; in linear time, successive eclipse stations cannot be separated by 23 months.
Chronological relationships among stations in eclipse families
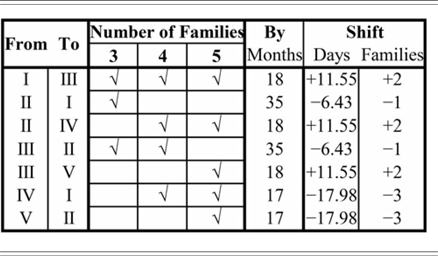
Successive eclipse stations within each zone pass among that zone's concurrent families in a strict sequence (see Table 2). Numbering current families in order from the first (I) to the last to be established, there is always a standard number of months and a standard shift depending on the number of concurrent families on the date of the station being shifted from. Solar zones typically have four concurrent families, but they drop to three after the last station in family I; lunar zones have five, but drop to four after family I disappears. Every station, except the last in family I, is necessarily followed by another in its family after 88 months.
Sequencing of intereclipse intervals within a single eclipse zone. The interval is determinable from two features: from which family the current station falls within, numbered from the earliest (I) to be established; and the number of families then in progress in its zone. In Mesoamerica, four or five lunar and three or four solar families are always in progress.
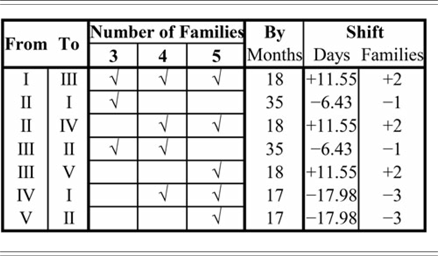
The shortest interval that can lead from one eclipse to another within an eclipse zone is 17 months. This interval shifts, on average, 17.98 days earlier relative to the nodes, which is a shift three families earlier in that zone. It can therefore only lead from family IV to I or, if lunar, from V to II. An interval of 18 months produces an average shift of 11.55 days later in its zone, shifting to a station two families later; this joins a station in family I to III, II to IV, or, if lunar, III to V. For solar eclipses, a third intereclipse interval will occur: from family III, a shift of 35 months will lead from the earliest to the third, the next earliest to the fourth.
How did daykeepers track the DC limits of eclipse zones?
For Mesoamerican daykeepers to anticipate when in the DC an eclipse might be seen, they would need to know the range of possible DC dates in each eclipse zone at any given time – in particular, how late in the DC a family could begin, and how early in the DC a family could end. Whatever their procedure for anticipating the dates of eclipses, Mesoamerican daykeepers would likely have periodically reduced, by one day, the upper and lower limits of each eclipse zone. With no direct evidence for what adjustment procedure daykeepers used, the limits of the eclipse zones used in this paper, and graphed in Figures 2 and 3, are based on the theoretical recession rate.
Data discussed elsewhere (Justeson Reference Justeson, Dowd and Milbraith2015:329–330) suggests that epi-Olmec daykeepers knew that a decrement of five days is required after two calendar rounds; since the calendar round was common to all Mesoamerican calendrical traditions, in principle this adjustment would have been available throughout Mesoamerica. Because eclipse zones recede in the DC by one day in 7140.895, I have suggested that Mayan and epi-Olmec daykeepers might have arrived empirically at one day in 7,200 (one katun) as a calendrical construct for the timing of a one-day decrement in the upper and lower bounds of the eclipse zones (Justeson Reference Justeson, Dowd and Milbraith2015:330–334). It would take over 120 katuns, nearly 2,400 years, for one day of error to accumulate. The 5,200-year cycle of the long count, or katun count, consists of 260 katuns; being structurally like the DC, but with units of katuns rather than days, an adjustment of one unit in the DC per one unit in the long count could have been appealing as a theoretical construct.
Mesoamerican Eclipse Prediction
Given the regularities in the temporal structure of eclipse families and in the temporal relationships between successive families, a simple procedure would project forward to every full/new moon on which a lunar/solar eclipse might take place in Mesoamerican territory:
Step 1: Periodically, reduce by one day the earliest and latest possible DC dates for an eclipse in each of the three eclipse zones, not necessarily at the same time in each zone nor for both limits.
Step 2: From any station within an eclipse family, whether or not an eclipse is observed on that date, project the next station of that family 88 months later, unless the resulting station would fall earlier in its zone than the minimum established in Step 1. Between 100 b.c.e. and 1500 c.e., periods of 88 months range from 2599.5299 to 2597.9208 days between new moons and from 2599.5299 to 2597.9215 days between full moons; so the projected station always falls no later in the DC than the previous station, and never more than two days earlier. This operation will project all later members of an eclipse family from any earlier member.
Step 3: From any station within one eclipse family – whether or not an eclipse is observed on that date – project a station 405 months later, into the next eclipse family, unless the resulting station would fall later in its zone than the maximum established in Step 1. Periods of 405 months range from 11,959.5361 to 11,960.2840 days between new moons and from 11,959.5361 to 11,960.2826 for full moons; so the projected station usually falls on the same day of the DC as the corresponding station from the previous family and always within one day.
Step 2 can project all but the first station or two in an eclipse family; Step 3 can project all but the last. Within this algorithm, Step 2 is crucial for locating its final station, Step 3 for its first.
From a Mesoamerican point of view, this is a “warning” procedure: it overpredicts but never underpredicts, unless a daykeeper's upper or lower limit on when an eclipse might occur in a zone were not far enough from its center. Every station projected by this procedure is the date of an eclipse somewhere on earth; every eclipse observable in Mesoamerica, lunar or solar, is projected by it.
IDENTIFYING THE SET OF “REAL” ECLIPSE STATIONS UNDERLYING THE DRESDEN ECLIPSE TABLE
Even if something like an eclipse-family representation for the timing of eclipses was unknown to Mesoamerican daykeepers, it accurately characterizes a set of chronological relationships among all eclipses they could have observed. Under the assumption that at least a subset of the stations of the Dresden eclipse table was intended to correspond to eclipse stations, these relationships can be used to determine exactly which stations could and which could not have served this purpose.
Procedure
The eclipse table lays out 69 lunar stations, here treated as potential eclipse stations, over a span of 405 months; this span approximates nine nodal passages to within 1.562 days. Broken down into six- and five-month intervals, the table's length requires nine spans of five months, which shift station placements from dates well after a node to well before one. These must be interspersed among 60 six-month spans (on average, 62/3 of them between each five-month span), each shifting eclipse stations gradually later with respect to the nodes.
As noted above, solar eclipses are not observable five months apart anywhere on earth, and just one or two low magnitude lunar eclipses separated by this interval were observable by Mayan daykeepers between 100 b.c.e. and 1500 c.e. The virtual absence of observable five-month intereclipse intervals suggests that those in the Dresden table were contrivances for a formal model, inserted between dates of anticipated eclipses more than five months apart.
This section therefore applies eclipse-family constraints to determine what sequences of eclipse stations could underlie the table in the Dresden Codex – on an assumption that daykeepers’ observations of eclipses had yielded a reliable procedure for anticipating dates on which an eclipse was possible, but without presupposing that an eclipse-family construct was known to them. The established temporal relationships among stations in eclipse families, and the range of possible intervals among eclipses in Mayan territory, turn out to be consistent with one, and only one, sequence of interstation intervals.
Eclipse-family constraints on the placement of the stations of the Dresden Codex over a single period of 405 months (about 32 years and nine months) necessarily yields stations having (among others) the following properties:
-
(1) Because solar eclipse families last up to 170 years and lunar eclipse families up to 199, while the table's span is under 33 years, most of its eclipse families will have begun with an eclipse station prior to the table's span and would end after it.
-
(2) Corresponding stations in two successive eclipse families fall exactly 405 months apart; they differ, on average, by 0.112 days in the DC, and never by more than a day. In each eclipse zone, the earliest and latest possible DC dates drift one or two days earlier after 405 months.
-
(2a) At most one family can die out in each eclipse zone during the table's 405-month span. The DC date of the last eclipse in a family is never greater than the otherwise earliest in its entire zone during a single pass through the table, since successive eclipse stations in a family always decline at least fractionally in the DC (by between 0.47 and 2.08 days). A station is detectably the last in its family when it falls more than 88 months before the end of the table.
-
(2b) Similarly, in each zone at most one eclipse family can begin during the table's span, and its DC date is always the latest in that zone. It is detectably the first member of its family when it falls more than 88 months after the base of the table.
-
(3) Any Dresden station or sequence of successive stations between the first and the last 88 months of the table that is not either preceded or followed by a continuous sequence of stations every 88 months cannot be part of an eclipse family, and, therefore, cannot be an intended eclipse station.
Applying Eclipse-Family Constraints
Given these constraints, a simple algorithm relates most stations in the eclipse table to eclipse families, based only on the principle that eclipse families consist of a sequence of eclipse stations every 88 months.
The first 15 stations of the Dresden table fall in its first 88 months, so each intended eclipse station among them must be a member of a different eclipse family. Because the table's span of 405 months equals 4 × 88 + 53 months, each of the nine stations in the first 53 months will have four following stations every 88 months if the families of which these stations are members persist throughout the span of the table. Three more stations will follow the remaining six stations in the first 88 months if the families of which they are members persist throughout.
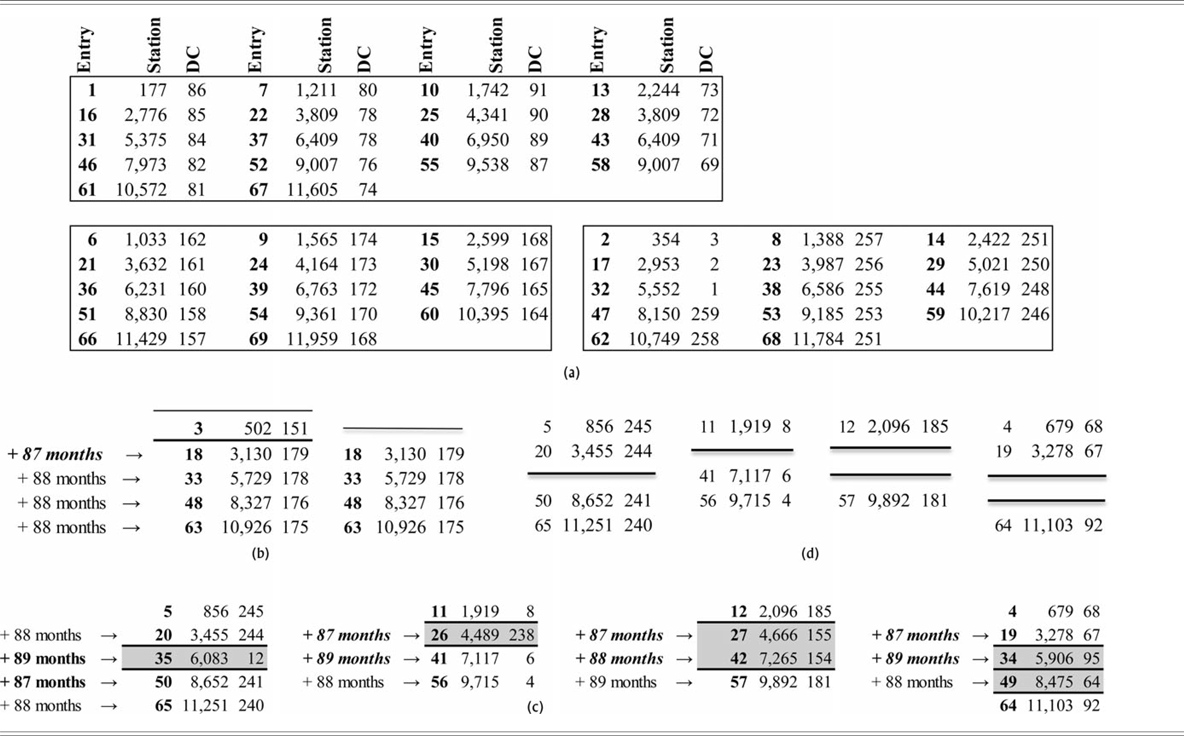
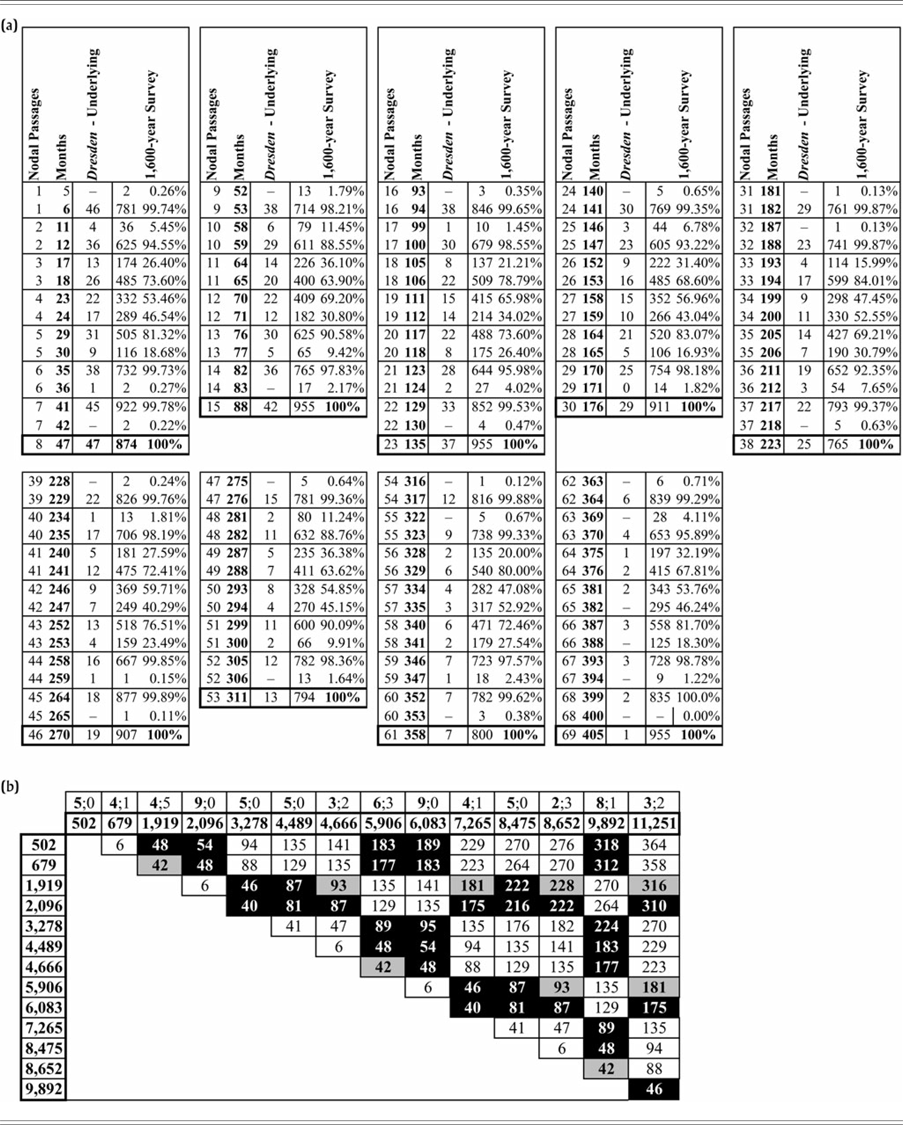
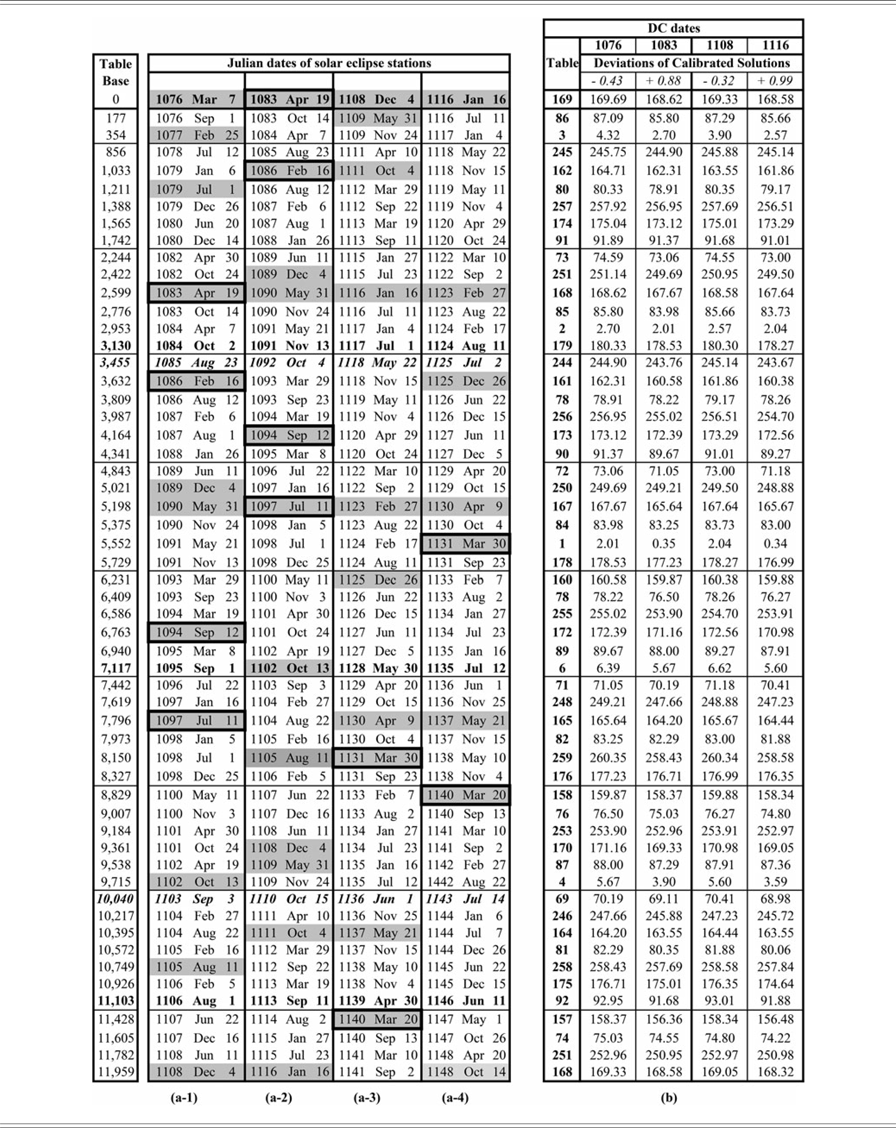
Table 3a displays 46 stations, comprising 10 eclipse families, that were current throughout the 405 months of the table: the first station in each group occurs in the first 88 months of the table; the last occurs in the last 88 months of the table; and there is a station in the group every 88 months between the first and the last. Based on these results, the three eclipse zones spanned at least DC dates 69 to 86, 157 to 174, and 246 to 3 (= 246 to 263); considerations below extend these ranges. As in nature, successive DC dates in each recognized family are non-increasing.
Identifying eclipse families in progress during the 405 lunations covered by the Dresden Codex eclipse table. Bold numerals refer to the relative positions of the recorded stations, numbered one through 69, in the Dresden eclipse table; these are followed by the distance of each station from the base date and by the divinatory calendar (DC) date of that station in the table. (a) Eclipse families in progress throughout the span of the table. (b) An eclipse family that begins during the span of the table. (c) Six stations (in grey) that cannot be members of any eclipse family. (d) Four resolvable alternative pairs of eclipse family candidates.
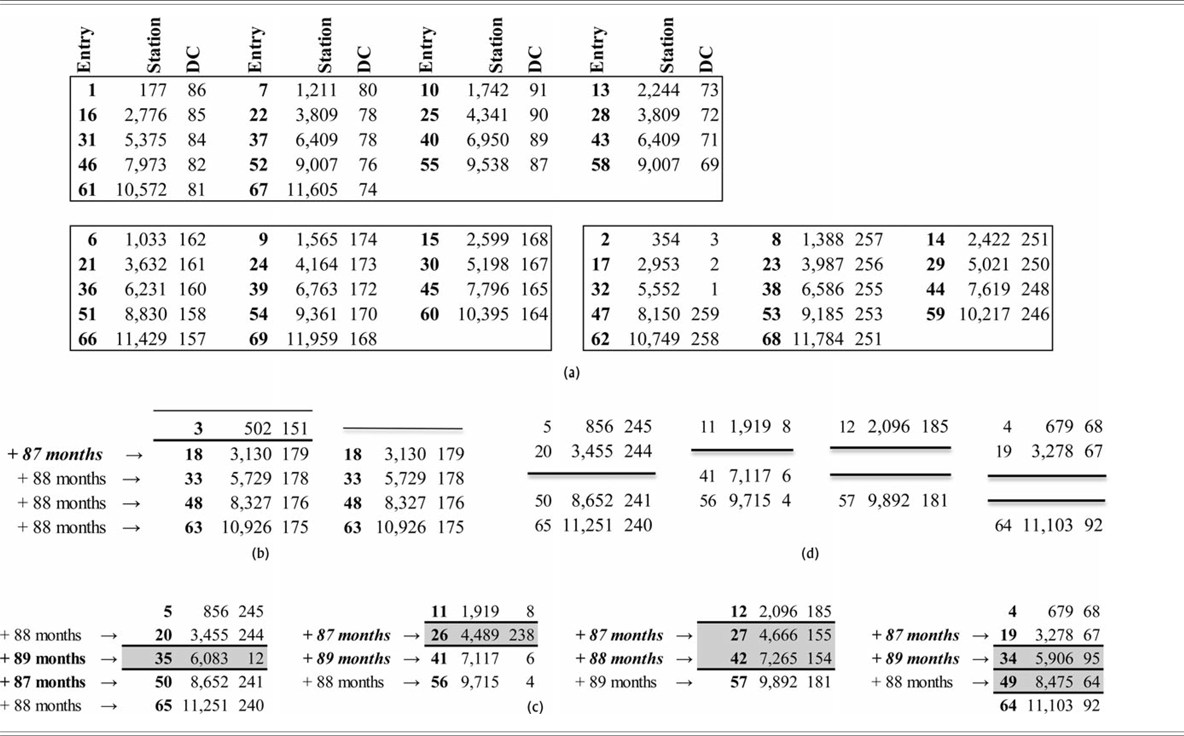
The remaining 23 stations do not have these properties, and so cannot be members of an eclipse family that is current from the first 88 months of the table through the last. Each grouping of stations in Tables 1b–1d contains one or more intervals of 87 and/or 89 months between chronologically successive statements. Not only are two such stations not successive members of the same eclipse family, but 87 and 89 months are not possible intereclipse intervals in Mayan territory (see Independent Evidence from Interstation Intervals, below); in each case, then, at least one of the two stations cannot be a member of any eclipse family at all. Identifying real eclipse families among these sets depends on further structural properties of eclipse families.
These entries can be broken into subgroups of stations whose members are separated from the preceding and following station by 88 months. An eclipse family that is in progress in the first 88 months of the table – corresponding to the first entry in each group of stations in Tables 1b and 1c – ends with the last station in such a subgroup; the DC date of this station must be as early as, or a day or two earlier in the DC than, the otherwise earliest DC date in its zone. Conversely, a family that is in progress in the last, but not the first, 88 months of the table begins with the first station in its subgroup; in this case, the DC date of the first station in this subgroup is the first in its family, and must be as late as, or a day or two later than, the otherwise latest DC date in its zone.
The first set of stations in Table 3b begins with a single station at day 502, followed after 87 months by four successive stations at 88-month intervals, starting at day 3,130 on DC date 179. The group starting at day 3,130, not being preceded by another station 88 months earlier, would have to begin a new eclipse family. It is consistent to identify this station as the first in a new family, because its DC date, 179, would be the latest date in its zone.
Furthermore, as the data in Table 3a illustrate, the DC dates in any family drop by four to six days over a 405-month period. The next eclipse station in a previous family falls 35 months later (unless that family dies out), which shifts its DC date an average of 6.43 days. As a result, in any zone during the span of the table, the earliest date in one eclipse family is within a day or two of the latest DC date in the previous family in that zone. The last station in the family that begins on day 3,130 is at day 10,926; its DC date, 175, is just one day later than the first station in its predecessor family at day 1,565 on DC date 174. Accordingly, this set of four stations is consistent with being the beginning of an eclipse family.
In contrast, the station at day 502 is at DC date 151; this would indeed be the earliest date in its family, as required of the last station in a family, but it is six days earlier in the DC than the next earliest candidate for a station in that zone – not within two days as required. The stations at days 3,130, 5,729, 8,327, and 10,926 are therefore valid as intended stations, while the station at day 502 is not.
Another property of eclipse families is that every set of sequential stations that forms only part of an eclipse family must be preceded or followed by stations every 88 months in the span of the table. Table 3c highlights in grey four individual stations and one pair of stations 88 months apart that violate this constraint: each is preceded by an interval of 87 or 89 months, and is followed by a station at the other of those intervals. The six stations involved therefore cannot correspond to eclipse stations.
Eliminating the impossible stations of Table 3c yields four pairs of station groups, each with a member in the first and last 88 months of the eclipse table, but not at every 88 months in-between (Table 3d). At most one member of each pair can be part of an eclipse family.
The data in the first row of Table 3d structurally resolve three of these cases.
(1) The stations at days 856 and 3,455, being in the first part of the table, would, if valid, end a family; consistent with this requirement, they are at DC dates 245 and 244, just earlier than DC date 246 for the station at day 10,217, which is otherwise the earliest in its zone. In contrast, the stations at days 8,652 and 11,251, falling in the last half of the table, would have to begin their family; but they are at DC dates 241 and 240, which would be the earliest, rather than the latest, DC dates in their zone. Stations 856 and 3,455 are the last members of their eclipse family, while the stations at 8,652 and 11,251 must be contrived.
(2) The stations at days 7,117 and 9,715, which, if valid, would begin their family, are at DC dates 6 and 4 (= 266 and 264); consistent with the first stations of an eclipse family, they fall just later than the otherwise latest station in their zone at day 354, DC date 3. The station at day 1,919 would have to end its family, but its DC date of 8 (= 268) would be the latest, rather than the earliest, in its family.
(3) Two stations, at days 2,096 and 9,892, are separated by 3 × 88 months, with no intervening stations at 88-month intervals; therefore, neither can be a station in an eclipse family. The station at day 2,096 precedes a gap and so would have to end its family, but it falls on DC date 8, which would be that family's latest rather than, as required, its earliest DC date; it must therefore be rejected. The station at day 9,892 would have to be the first in its family, and its DC date 181 is only two days later than the otherwise latest DC date in its zone at day 179. The 179 DC date, however, is itself associated with the beginning of an eclipse family at day 3,130, followed by stations at days 5,729, 8,327, and 10,926. Since only one eclipse family can begin in any one eclipse zone, accepting the station at day 9,892 requires rejecting the set of four stations beginning at day 3,130; and, if this is done, then the latest DC date in the eclipse zone other than 181 would be DC date 174 at day 1,565, an impossible seven days later than the nearest DC date. The station at 9,892 must therefore be contrived.
(4) The fourth and final case in Table 3d – the choice of stations at days 679 and 3,278 or the station at day 11,103 – is not resolvable by the issues discussed above. The DC dates of the first two stations are the earliest in their zone, close enough to the otherwise earliest dates in their zone to be consistent with ending their family. The DC date of the last station is the latest in its zone, close enough to the otherwise latest date in its zone to be consistent with the beginning of its family. It is resolvable by a set of basically structural issues, however.
(a) If stations are placed at days 679 and 3,278, then there is an unbroken series of thirteen stations every six months, except for one of five months between the stations at days 3,130 and 3,278. As noted above, observable solar eclipses never occur five months apart anywhere on earth, and in Mayan territory observable lunar eclipses occur five months apart only once or twice in 1,600 years; this interval is implausible in a predictive table.
(b) An interval of 47 months produces an abnodal shift of +1.465 days; its DC shift is −172.062 days, a change of +1.247 days in its position in the new zone relative to the old. This shift closely approximates the average of 1.3083 days between successive stations in a single family. At least for a table based on average behavior, 47 months should therefore reach the placement of the previous station in the new zone; only if counted from the first eclipse station in an eclipse family, having no preceding station, should it not do so. Among the 49 stations validated above that precede the last 47 months of the table, 47 are followed by another validated station 47 months later; the two exceptions are precisely the two stations in this range, at days 3,130 and 7,117, that begin a family.
The candidate station at day 11,103 is in the last 30 months of the table. Projecting backward, it should yield a station about one day later – on or near the second station – in the family it reaches. This is the case: 47 months before day 11,103 is day 9,715, the second station in the family beginning at day 7,117.
The stations at days 679 and 3,278 are not consistent with this structural pattern. A station at day 679, the next-to-last in its family, should be followed by another station 47 months later, approximately the third-to-last station in its family, around day 2,066. The table contains no such station, instead placing a contrived station on day 2,096. The station at day 3,278 is followed by a contrived station in the table after 47 months; however, it is not followed by one at 88 months and, with the station at day 679 eliminated, it is also not preceded by one at 88 months, so it cannot be a member of any eclipse family. It is a contrived station.
(c) As noted above in Spans Separating Beginnings and Ends of Eclipse Families, 135 months after the first or last station of an eclipse family in one zone, that (first or last) station of a family in another zone often occurs; when it does not, the later date always falls one or (rarely) two or three stations away from a family's extreme station. One hundred thirty-five months after the station at day 3,278 is a contrived station at day 7,265, which cannot be part of any eclipse family: it would be followed 88 months later by a station at day 9,863, offset by a month from the contrived station at day 9,892, and preceded 2 × 88 months earlier by a station around day 2,067, offset one month from the contrived station at day 2,096. Therefore, day 3,278 must itself be rejected as a contrived station.
This concludes the eclipse-family analysis of the 69 stations of the table. It identifies 55 eclipse-table stations exhibiting the characteristic temporal relations among eclipse-family stations, which fall into 14 eclipse families – most in progress throughout the 405 months of the table, some beginning or ending within it. I refer to these as the table's “underlying” stations. The other 14 recorded stations violate the properties of stations in eclipse families, and so cannot be part of a genuine sequence of eclipse stations: nowhere in the tropics could any one be the date of a visible eclipse.
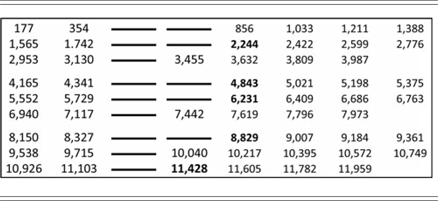
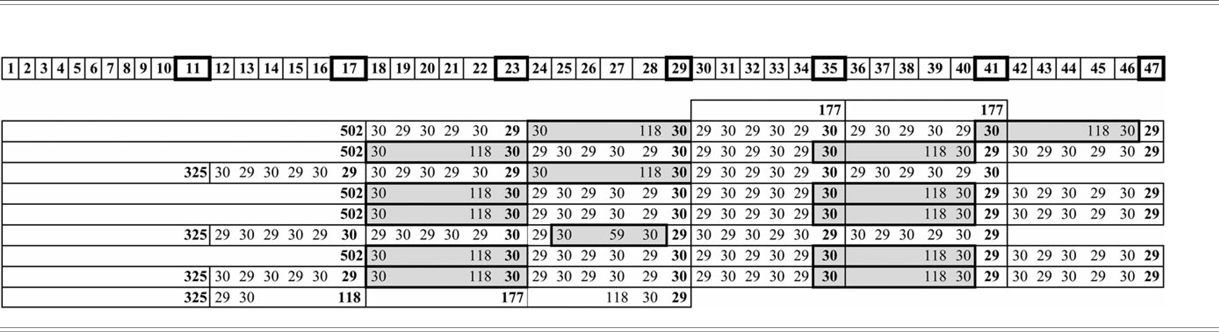
Table 4 displays the placements of the 55 underlying eclipse stations among the 69 recorded in the Dresden eclipse table. They can be seen to consist of three closely parallel thirds. The five doubled dashes in the table correspond to intervals of 17 months between stations, and the four single dashes to intervals of 11 months; the 46 stations that do not follow a dash occur six months after the preceding station.
Sequential positions of underlying stations, illustrating that underlying stations are laid out in closely equal thirds of the table. That is, breaks are at 3,987 ≈ 11,960 / 3, 7973 ≈ 11,960 x (2/3), and 11,959 days.

Independent Evidence from Interstation Intervals
The eclipse-family formalism is not simply a model for how Mesoamerican daykeepers could plausibly have anticipated eclipses; it is a representation that captures the actual temporal relationships among eclipses visible in Mesoamerica, and in the tropics generally, whether or not Mesoamericans were aware of this fact.
Saros cycles
In Table 4, when the placement of a station after a dash is bolded, that station follows the previous station after a dash by 47 months and otherwise by 41 months. The structure of these placements is familiar. Texts of similar structure, but laying out 38 stations – the 223-month saros series – are known from cuneiform sources (e.g., Aaboe et al. Reference Aaboe, Britton, Henderson, Neugebauer and Sachs1972; cf. Hunger and Pingree Reference Hunger and Pingree1999:183–212). In Table 4, starting from each station after a dash to the next such station, the intervals in terms of months are, in sequence: 47, 41, 47; 47, 41, 47, 41, 47.
This series emerges naturally because no sequence shorter than 41 months has a smaller prenodal shift (averaging −2.41 days), and none shorter than 47 has a smaller postnodal shift (averaging +1.47 days). The closest returns to the nodes, or to any particular distance from them, is achieved by a mix of about 55 percent of 47-month and 45 percent of 41-month intervals. Cuneiform eclipse tables, like the Dresden, include five-month intervals; their placements, like those of the Dresden’s underlying stations, yield sets of 41 (6 × 6 + 5) and 47 (6 × 7 + 5) months, in series of 47, 41, 47 or 47, 41, 47, 41, 47 – conforming to the actual patterning of eclipse recurrences. Including the contrived stations, the Dresden’s placement of five-month groups is unnatural, yielding month series of 59, 35, 41, 59, 35, 41, 53, 47.
Empirical intereclipse intervals of 405 months or less
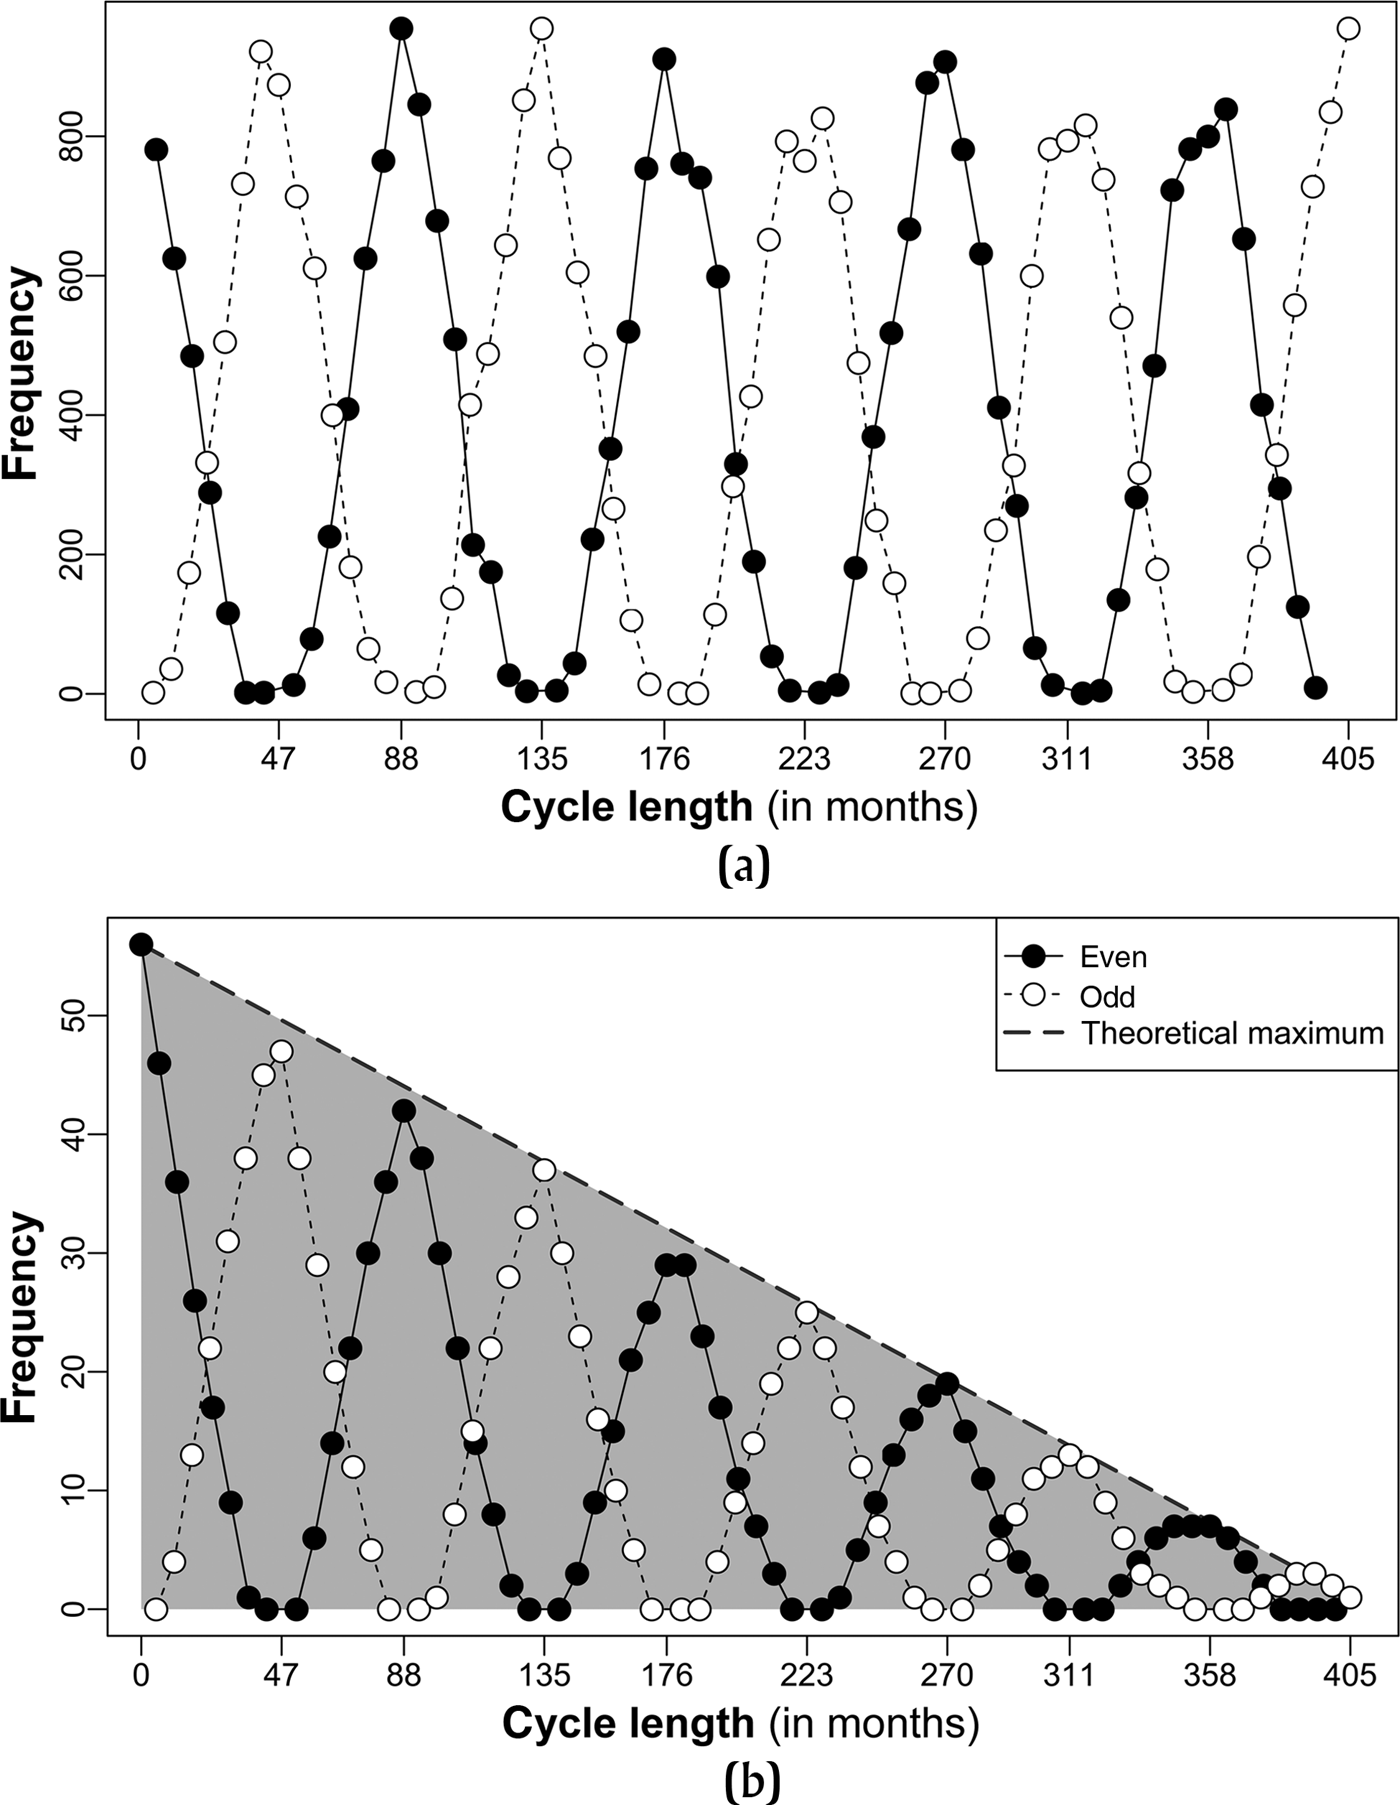
Another set of these relationships is presented in Table 5. In the 1,600-year survey of lunar eclipses visible in the Lowland Mayan area, including penumbrals of umbral magnitude −0.06 or greater, 50,424 pairs of lunar eclipses occur at intervals of 405 months or less. Each pair is separated by a number of months that closely approximates a multiple of the internodal period of about 173.31 days. In general, the smaller the shift with respect to the nodes, the greater the number of eclipses at that interval; no interval yielding an average abnodal shift of more than 27.6 days occurs over these 1,600 years as an intereclipse interval observable by Lowland Mayan daykeepers.
Frequency distributions of intereclipse intervals of 405 months or less. (a) Comparison of intereclipse intervals between lunar eclipses in the survey and underlying stations in the eclipse table. (b) Intereclipse intervals among contrived stations in the eclipse table. Darkest points and lines are for dates in the lowest eclipse zone of Figure 2, lightest for the middle zone, and medium for the upper zone. Cells with black backgrounds are interstation intervals that do not occur in the survey; those with grey backgrounds are intervals that are extremely rare. The number of each type are given in the header, bold for non-occurring and plain type for rare intervals.

Analysis of the interstation intervals in the Dresden eclipse table in the light of these results supports the distinction that emerges from the eclipse-family analysis between underlying stations, on which Mayan daykeepers might watch for and observe an eclipse, and contrived stations, on which no eclipse could be observed.
Among the 55 underlying stations recovered above, plus the table's base, there are 1,540 distinct pairs of stations. There are 105 distinct interstation intervals among them, every one attested as an intereclipse interval among visible lunar eclipses in the 1,600-year survey (Table 5a).
In contrast, among the 14 contrived stations isolated above, there are 91 distinct pairs of stations, yielding 40 distinct interstation intervals; 36 (90 percent) of these intervals are unattested among Mayan intereclipse intervals (Table 5b). Each contrived station is separated by an unattested intereclipse interval from between two and nine of the other 13 contrived stations.
The frequency distributions of interstation intervals among the 55 underlying stations and between them and the 14 contrived stations also support the distinction between precisely these two sets.
The data in Table 5a, and their frequency distributions graphed in Figure 6a, illustrate that there is generally a tradeoff between the frequency of intereclipse intervals of n versus n + 1 months when both approximate the same number of nodal passages. For example, 17 months falls 17.91 days short of three nodal passages, while 18 months falls 11.62 days after; correspondingly, there are 174 intereclipse intervals of 17 months and 485 of 18 months in the 1,600-year survey of lunar eclipses observable in Lowland Mayan territory. A qualitatively similar preference is found among underlying stations in the Dresden eclipse table (Figure 6b), with 13 17-month intervals and 26 18-month intervals.
Frequency distribution of intereclipse intervals (a) among eclipses visible in Mayan territory, and (b) among underlying stations in the Dresden eclipse table. The shrinking range of interval lengths in the eclipse table is due to its fixed length; from the mth month, there can be at most 405 − m interstation intervals. Graphs by Adam Gordon.

There is no such variation, however, for intervals of 47, 88, 135, 176, 223, 270, 311, 358, and 405 months. Each of these intervals is so close to a multiple of the internodal cycle – none deviates, on average, by as much as two days – that there is no variation in the number of months between eclipses at the corresponding numbers of nodal passages (8, 15, 23, 30, 38, 56, 53, 61 and 69; frequencies appear at the bottom of each column in Table 5a). These intervals are consistently the local maxima of the frequency distributions of intereclipse intervals in the survey (Figure 6a); they are also the local maxima among frequencies of underlying stations of the eclipse table (Figure 6b), and the frequency of each in fact falls very close to a theoretical maximum of 56 – (55/405 × m), where m is the number of months. In stark contrast, not one of these intervals occurs between any contrived and any underlying station as identified above – quite unnatural for real eclipse stations. This data separates the table's stations into exactly the two sets distinguished in the preceding section by exploiting the constraints of an eclipse-family representation.
Note that none of the underlying stations is separated from another by only five months. This feature was not a criterion for recovering the stations; it results from applying inherent structural properties of eclipse families to the Dresden data.
Times between extremes of eclipse families
As noted above, the extreme (first or last) stations in an eclipse family frequently fall 135 months before a station at the same extreme in another eclipse zone, and otherwise almost always one station later. Stations at days 3,130, 7,117, and 11,103 are shown above to be the first stations in their families; day 7,117 falls 135 months after day 3,130, and day 11,103 falls 135 months after day 7,117. The station at day 3,455 was shown to be the last station in its family; the station at day 10,040, 135 + 88 months later, is shown below (see The Eclipse Table Concerns Solar Eclipses) to be the last in its family.
How did Daykeepers Recognize Underlying Stations?
I find nothing explicit in the imagery or hieroglyphic captions of the Dresden eclipse table that consistently differentiates the underlying stations, the only straightforward guides to anticipating eclipses, from the contrived stations that fill out the table in sequential time. Without explicit verbal or visual labeling, daykeepers would have to draw on specific knowledge or training to recognize which stations corresponded to potential eclipse dates; such underspecification seems to be characteristic of calendrical tables used by Zapotec daykeepers in the late seventeenth century (Tavárez and Justeson Reference Tavárez and Justeson2008:79).
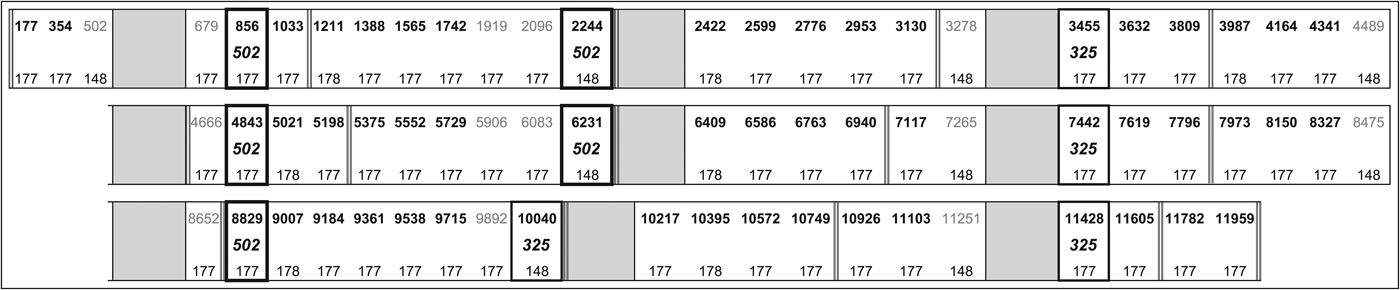
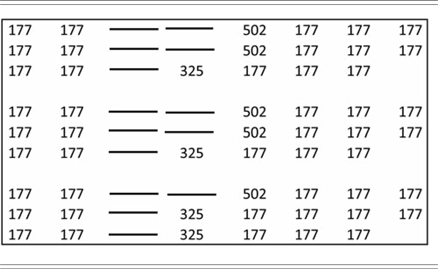
They could have done so by using a simple visual algorithm. The key lies in the contrast between unnaturally long runs of 9 or 10 stations ending with a 148-day interval before an image versus runs of six or seven such stations; at most seven can occur in sequence before a gap (see Figure 7). The contrast stands out visually because the images that follow the 148-day intervals flanking the long runs are spaced noticeably further apart than those flanking the short sequences, and more explicitly: in each of the short runs, the image is on the same page as the station that precedes it, while in each of the long runs, it is not (see Figure 1).
Schematic of Dresden underlying and contrived stations, with placements of images and page breaks. Grey rectangles mark the positions of the nine images, which follow a five-month interval. Cumulative positions in the table are given in black for underlying stations, in grey for contrived stations. Heavy boxes enclose intervals of 325 or 502 days between successive underlying stations; double bars mark the placements of page breaks.

In detail: Two sequences in the table consist of nine six-month intervals followed by a five-month interval; in both cases, the second station and the last station are underlying stations that fall 17 months after the previous underlying station. The last station appears on pp. 54a and 51b, which contain no image; the image after the five-month interval begins the next page.
The other long sequence consists of eight six-month intervals followed by a five-month interval; its second station is an underlying station 17 months after the previous underlying station, and the last station is an underlying station 11 months after the previous underlying station.
Long sequences of formal stations in the table therefore show where to place every underlying 17-month interval, and one of the 11-month intervals. The last station appears on p. 55a, which contains no image; the image after the five-month interval begins the next page. Each of the remaining five-month intervals is followed by an underlying station that falls 11 months after the previous underlying station. The image appears on the same page as the five-month interval that it follows.
A side effect of this layout is that it determines the temporal location of each five-month interval and, thereby, of every contrived station. The patterning of the timing in cumulative months of the 11- and 17-month intervals between underlying stations in terms of visually identifiable features of the eclipse table constitutes further evidence that its designers distinguished between these two categories of station.
The Eclipse Table Concerns Solar Eclipses
The properties of the underlying stations agree with a solar and not with a lunar eclipse table in two related ways: the widths of the eclipse zones and the number of concurrent families in each zone.
Widths of the zones in the eclipse table
The minimum width of the table's eclipse zones can be determined from the DC dates of the latest and earliest underlying stations in each zone. Once these are determined for each zone, the zones’ minimum widths are computed by taking account of the rate of recession of their upper and lower limits. Since the zones should be treated as uniform in width (see the discussion of Figure 4), the upper limits of two of the zones must be increased so that the upper limits of all three lie one internodal cycle apart (173.30906 days); the lower limits of two must be lowered correspondingly. The result will in general be wider than that of any one of the zones. In this case, the individual zones’ widths are 20.838, 22.513, and 23.149 days; these expand to a uniform-width minimum of 23.282 days.
The maximum uniform zone width can also be determined. One family begins in each zone – recognizably, because in each case its first station appears more than 88 months after the table's base. Dates projected one station back from each of these stations must fall outside the eclipse zone; the most restrictive of the three placements provides an upper limit on the latest DC date in each zone. The family ending on day 7,117 provides a lower limit on the earliest date in its zone, which can be applied to the other two; the result is that the eclipse zones must be less than 23.651 days wide.
Even excluding penumbral eclipses, the minimum span for lunar eclipse zones is shown above to be 26.73 days – more than three days wider than the maximum for the eclipse table. The minimum for solar eclipses is shown to be 22.41 if based on data since 200 c.e., or 24.16 if Preclassic data is included. The Preclassic figure is seemingly one half-day too wide to fit either a solar or a lunar model and, although this depends on how precisely the fractional parts of these projections should be interpreted, the Classic data is more securely relevant. Maxima cannot be computed from the survey data, but they must lie within 2 × 0.9444 days of the minimum width; even using the Preclassic estimate, this is still below the minimum for lunar eclipses.
The data leave no doubt that the Dresden table could have modeled solar but not lunar eclipses, and its zone widths of 23.466 ± 0.184 days provide us a fairly precise estimate for some Mayan daykeepers’ working model for the widths of solar eclipse zones.
Number of families in the table's zones
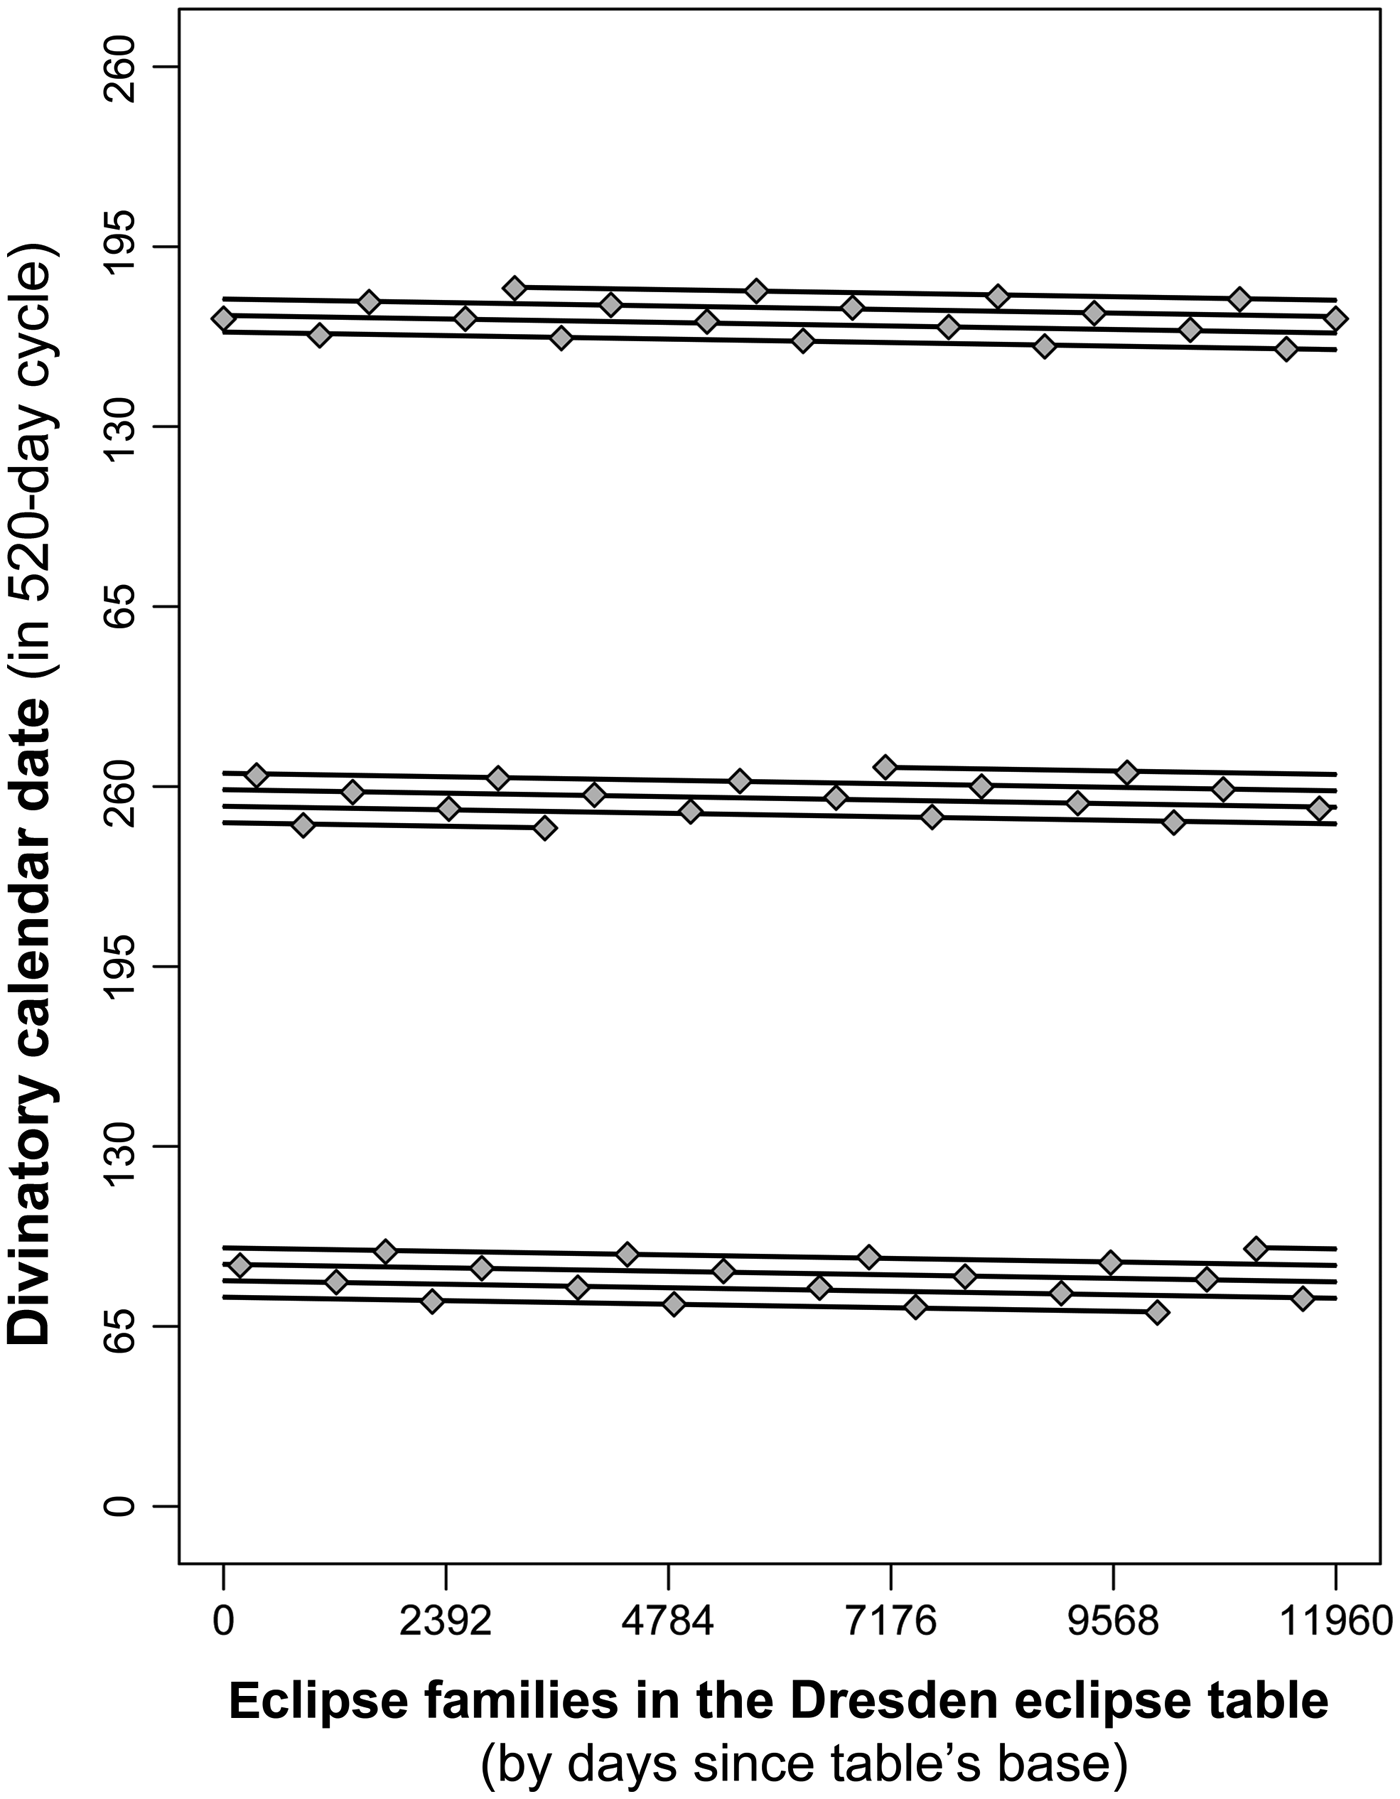
It is possible to show how many families are concurrent in each of the Dresden’s eclipse zones, and here too the data agree with solar and not with lunar eclipse occurrences (see Figure 8). In each zone, usually four families are in progress concurrently. In the figure it is clear that only three are in progress in the upper zone when the table begins; that four are in progress in the middle and lower zones at the beginning of the table; and that the middle zone drops from four to three as its earliest family dies out, and increases again to four when a new family emerges.
Eclipse families in the Dresden Codex. In each zone, the family with the lowest DC dates is the only one that can die out; it would also have been the first among them to be established. A family established during the span of the table has the latest DC dates in its zone. Graph by Adam Gordon.

The earliest family in each zone happens to have a station in the last 88 months of the table. For each of these families, it can be determined whether it continues or dies out; the results show that three or four families are always in progress in each zone throughout the table.
In the middle zone, the earliest family dies out at day 3,455. The earliest still in progress thereafter must continue beyond the bounds of the table, because two successive families in the same zone cannot die out within 405 months of one another (see Spans Separating Beginnings and Ends of Eclipse Families, above). This zone therefore begins with four families, drops to three after the station at day 3,455, and returns to four for the remainder of the table at day 7,117.
In the lowest zone, the station at day 10,040 falls within the last 88 months of the table. A station projected 88 months later would fall 0.614 days below the limit for eclipse stations in that zone, assuming average behavior, and at least 0.371 days below the limit for an observed eclipse. It is therefore the final station in its zone, which must begin with four families in progress, dropping to three at day 10,040, and returning to four at day 11,103. Furthermore, as noted above in Spans Separating Beginnings and Ends Of Eclipse Families, the ends (and beginnings) of eclipse families often occur 135 months apart (see Table 1); the interval of 135 months is almost always within one station of this interval. Figure 8 shows that one eclipse family ends at day 3,455, in the earliest family in the middle zone. An eclipse station falls 135 months later, in the earliest family of the lowest zone, at day 7,442; the station at day 10,040 falls one station later in that family, so the chance of a further station is extremely remote and daykeepers would not have expected it.
In the upper zone, the station at day 11,428 would be followed by a station 88 months later; a station projected there would appear, on average, between 0.408 and 1.188 days above the lower limit of its eclipse zone. This zone therefore begins with three families in progress, increasing to four at day 3,130, and remaining at four for the rest of the table.
Analytical results summarized in Zone Widths and Interstation Intervals, above, show that intereclipse intervals are always mostly of six months, and that intervals of 11 months are relatively common for zone widths in the range observed in Mayan territory for both lunar and solar eclipses. In contrast, intervals of 17 months, which are relatively common in the range of zone widths attested for solar eclipses in Mayan territory but rare to nonexistent for zone widths in the range of lunar eclipses, are in the majority among the nine intervals other than six months that the eclipse-family formalism recovers for the Dresden table.
Figure 8 represents all eclipse families in the Dresden eclipse table using these results.
It proves possible to calibrate the Dresden table's stations to specific solar eclipse families but to no lunar family; see Placing the Eclipse Table in Real Time, below.
Placing the Nodes in the Eclipse Table
The set of underlying eclipse stations recovered above enables us to place, approximately, where the nodes of the eclipse cycle would have fallen when the recovered sequence of underlying stations would have corresponded to viable eclipse stations on or about the DC dates recorded in the table.
Eclipse stations separated by 11- or 17-month intervals, with no intervening eclipses visible in the tropics (see Appendix), are near the greatest distances in time from the nodes because they entail large shifts, earlier with respect to the nodes, on average, by 21.78 and 17.98 days, respectively; the first station in such pairs must be several days postnodal. In the underlying table, between these longer intervals there are six or (once) seven stations at intervals of six months; these produce regular shifts averaging 3.78 days later with respect to the nodes, the entire sequence accumulating shifts, on average, of 23.25 or (once) 27.12 days. The only way the underlying stations can model real eclipse sequences is, as in nature, for the postnodal extremes at the ends of the six-month intervals to approximate the prenodal extremes after the 11- and 17-month intervals.
Therefore, if the base of the table, 177 days before the first station, is n days from a node, the value of n should be close to one that minimizes the average deviations of the underlying stations from nodal positions projected forward from that n. The minimum for the 55 stations recovered here is achieved by placing the node 0.1136 days before the base, with a sample deviation of 6.823 days and a 95 percent confidence interval of ±1.845 days. Because the stations of the eclipse table are recorded in terms of days, the finest resolution on the placement of the nodes is to within one day. The estimate above would therefore place the base of the table on day 169 (13 Muluc), one day after a node, and the node itself on day 168 (12 Lamat), the formal base of the table.
This placement of the nodes, or one very close to it, is inescapable when the table is treated as a real-time representation of a specific series of eclipses or of eclipse-possible stations. It is for this reason that Teeple (Reference Teeple1930:90) and Lounsbury (Reference Lounsbury1978:794–795) concluded that the table's base (real or computed) was very near a node: this follows from treating the table as a set of eclipse-possible dates. Bricker and Bricker (Reference Bricker and Bricker2011:269–270) incorrectly state that Lounsbury's (Reference Lounsbury1978) placement of the table's base very near a node was simply an assumption. In fact, it was not an assumption but, rather, his conclusion based on the data tabulated in that study for the distribution of the dates and their pattern of deviation under a different assumption: that the series of dates in the table represented a sequence of eclipse-possible dates over a single 405-month interval.
More specific evidence concerning the placement of the nodes comes from the shift between postnodal and prenodal stations. Placing a node at x days after the table's base, using whole number DC dates, the postnodal positions before a 17-month gap range from (x + 7) to (x + 10) days, and before an 11-month gap from (x + 10) to (x + 11) days. The 17-month gaps take place because a station six months later would be postnodal by too many days for an eclipse to occur; the DC dates that would have been reached in these cases range from (x + 11) to (x + 14) days. The largest deviation from a node at viable stations (x + 11) can be no greater than the smallest for an excluded interval (also x + 11); in days, the node would have to fall exactly at day x = 0.
The discussion in How Did Daykeepers Recognize Underlying Stations? shows that the placements of the five-month intervals and the pictures that immediately follow them precisely signal which of the table's stations are underlying and which contrived. The placement of the nodes makes it possible to address previous accounts of these placements in terms of the timing of solar versus lunar eclipses.
The five-month intervals, always of 148 days, shift 25.31 days earlier relative to the nodes. Meinshausen (Reference Meinshausen1913) suggested that the placements of the images and the associated 148-day intervals mark periods when both a lunar and a solar eclipse might both be visible – dates when the node fell about midway between new and full moon. Given the placement of the nodes required by an eclipse-station interpretation, Lounsbury (Reference Lounsbury1978:797) noted that “to the extent that the pictures are consistently placed in relation to the ideal structure of such a table, as several of them are, they mark places where a partial eclipse of the sun might occur either on the indicated date or on a date one month later, or on both dates (somewhere on earth), with optimum conditions for a total eclipse of the moon at opposition time halfway between them.” Makemson (Reference Makemson1943:192) arrived at a similar conclusion based on the moon-phase tables in Schramm (Reference Schram1908).
Identifying the relationship of the table’s stations to nodes makes it possible to be more specific about these issues, if the images are taken as corresponding lunar eclipses at the full moon half a month after the calendrical station they follow.
Whenever a full moon is within about two days of a node, a total lunar eclipse will take place; full moons between about two and eight days from a node will also be eclipsed, either totally or partially. Six of the five-month intervals reach contrived stations; in all six cases, the full moon following each such station is between three days prenodal and one day postnodal. All or most would be occasions of total lunar eclipses; these cases are consistent with a treatment of the images following the 148-day intervals as relating in some way to a total lunar eclipse. The other three five-month intervals reach an underlying station that follows a contrived station. Two of them, at days 2,244 and 6,231, follow two successive contrived stations, and they fall 6 and 7 days postnodal; it is possible but unlikely for them to be occasions for total lunar eclipses, but they would be occasions of at least partial eclipses. The third is three days post-nodal, likely corresponding to a total eclipse.
A CALCULATING RATIO OF 502 DAYS TO 17 MONTHS
Further independent evidence that all and only the 55 underlying stations identified above were treated by the table's creators as eclipse-possible dates comes from recognizing that the specific days assigned to each station are based on a consistent equating of 17 months with 502 days. This equivalence yields completely consistent results when it is extended to project new moons among underlying stations; inconsistencies arise when computing from or into intervals including contrived stations.
Mayan Models for Lunar Month Intervals
Month lengths
Specialists on the Classic Mayan lunar calendar, as reflected in the “Lunar Series,” entertain a variety of models for the structure of that system. Two broad issues are the lengths of lunar months, and how individual lunar months are grouped into larger sets according to their lengths.
There is effectively universal agreement about the range of lengths of lunar months, for good reasons. One is empirical: in the Lunar Series, the lengths of months are specified in “Glyph A,” always as either 29 or 30 days long. Another is conceptual. Measured between successive new moons and successive full moons, during the 1,600 years of the eclipse survey a lunar month varies from a minimum of 29.268 to a maximum of 29.835 days (computed using 19,790 successive new and 19,790 full moon dates and times from Walker [Reference Walker1997]); calendrically, then, only lengths of 29 and 30 days relate straightforwardly to reality.
For the pattern of occurrence of 29- and 30-day months in sequence, relating empirical data to detailed models hinges on unverifiable assumptions about a range of issues. All models in the recent literature, however, operate on an assumption that Mayan daykeepers modeled every 29-day lunar month as being both preceded and followed by a 30-day lunar month, while a 30-day lunar month must sometimes occur right after another 30-day month. Models vary on how this was implemented.
The average length of a lunation during this period is 29.530587 days; its average length measured century-by-century varies by less than 0.0005 days from this overall average. Linear regression on dates of new moons in this era yields an estimate of 29.530586 days. On average, 53.63 percent of lunar months are longer than 29.5 days; 46.37 percent are shorter. Because a span of 29 days deviates by more than half a day from the longer-term mean, a formal system of month-length alternations can minimize the cumulative deviation from long-term averages, keeping it consistently within one half-day, only if every 29-day period is preceded and followed by a 30-day period. In contrast, to approximate real new and full moon dates, some 30-day periods must be followed by another 30-day period. I believe both features are common to all current models for Classic Mayan lunar calendars; they are used below to construct a fuller set of lunar stations among the underlying eclipse stations of the Dresden eclipse table and to evaluate particular models.
The following subsections show that the interstation intervals recorded in the Dresden Codex reflect a model and not observation.
Lengths of six- and five-month intervals
Observationally, intervals of six months, averaging 177.183 days, are approximately uniformly distributed between 176.047 and 178.360 days between 100 b.c.e. and 1500 c.e.: 19.6 percent are closer to 176 days than to later days, 43.2 percent are between 176.5 and 177.5 days, and 37.2 percent are closer to 178 than to 177 days. The 60 intervals of six months in the Dresden table, however, are all 177 or (seven occurrences) 178 days long. They appear to follow a strategy of alternating between the two lengths closest to the average. In fact, among the underlying stations, the average length of the 46 intervals of six months is 1777/46 ≈ 177.15 days, approximating the long-term average; in the usual case that the table's length would be 11,960 rather than 11,959 days long, this would be 177 8/46 ≈ 177.17 days. The preserved portions of the Xultun model for 27 six-month groups are also consistent with a system in which all six-month groups are of 177 or 178 days exclusively, and they are so interpreted by Bricker et al. (Reference Bricker, Aveni and Bricker2014).
During the same 1,600-year period, intervals of five months average 147.653 days and range from 146.598 to 148.772 days. Under Lounsbury's (Reference Lounsbury1978:791–793) definitive resolution of internal discrepancies within the table, all nine recorded intervals of five months were intended to be 148 days long. Given the close agreement of the mix of 177- and 178-day intervals with long-term averages, about four of the nine instances of five-month intervals might be expected to show up as 147 days long. This possibility is realized for other (non-eclipse) lunar stations in the reconstruction below (cf. Satterthwaite Reference Satterthwaite1948:61).
Lengths of 135-month intervals
Another line of evidence that the specific dates of the table's eclipse stations are based on a formal model comes from its long-recognized breakdown into comparable 135-month thirds. Each third consists of three groups of stations, with the nth group in each third being structurally parallel. The parallels are rather precise because each of the eighteen underlying stations in the first third is followed 135 months later by one in the second third, and each of those stations is followed 135 months later by a station in the last third. Because the last third of the table has one more underlying station than the two previous thirds, one station in the last third is not preceded by an underlying station in the second third at this interval.
This structural pattern is not surprising, since 135-month intereclipse intervals are among the commonest observationally. These intervals vary in length, however, between 3985.814 and 3987.382 days, and close to the full range of lengths for 135-month intervals appears about every seven months during the 1,600-year survey. In contrast, 16 of the 18 stations in the second third fall 3,987 days after those in the first, and all eighteen are followed by a station in the last third 3,986 days later. The table's regularities arise because of the closely similar placements of the 178-day intervals within each of its thirds. It would be completely consistent if the first third of the table were consistent – specifically, if the 178-day interval joined the tenth and eleventh underlying stations, rather than the ninth and the tenth.
This structure would be a common, but not inherent, property of 405-month eclipse tables in Mesoamerica because it relates eclipse recurrence in the 223-month saros cycle and the 88-month eclipse-family cycle. Suppose that two eclipses, A and B, take place 223 months apart. In A's eclipse family, the next eclipse after A, if that family continues, occurs 135 months before B. Therefore, only if A is the last eclipse in its family might an eclipse not take place 135 months before B. In the Dresden table, the eclipse at day 3,455 is the last in its family; it is followed 223 months later by a station at day 10,040; and there is, indeed, no station 135 months earlier near day 6,054. Conversely, in B's family, the last eclipse before B, if there is one, occurs 135 months after A; only if B is the first eclipse in its family might an eclipse not take place 135 months after A. Two stations, at 7,117 and 11,103 days, are the first in their families, and no underlying eclipse station chances to occur one saros interval earlier; but these two stations themselves fall 135 months apart.
Evidence Against a 2392-day Computing Interval for Lunar Month Placements
Teeple (Reference Teeple1930:65–66, 86) showed, via differences in recorded lunar calendar dates among contemporary and distant past dates at Palenque, that a ratio of exactly 2,392 days to 81 months underlies long-term calculations of moon ages there. A shorter-term model for the use of this ratio has recently been established for daykeepers at Xultun (Saturno et al. Reference Saturno, Stuart, Aveni and Rossi2012; Bricker et al. Reference Bricker, Aveni and Bricker2014). This ratio is an excellent approximation, overestimating lunar month intervals by just one day in 292 years. Teeple also noted that it is identical to that of the Dresden eclipse table under an equivalence of its canonical length of 11,960 (= 5 × 2,392) days with 405 (= 5 × 81) months. Critical to the length of the Dresden table is that 11,960 (= 46 × 260) days commensurates the lunation with the DC, and this seems to be universally accepted as the rationale for this computing ratio; it presumably is why daykeepers did not use the shorter and more accurate ratio of 1,447 days to 49 months (cf. Lounsbury Reference Lounsbury1978:775; Satterthwaite Reference Satterthwaite1947:103–104), which would overestimate by one day only after 3,241 years.
Notwithstanding that this calculating ratio was in use in the Classic period and relates directly to the structure of the Dresden eclipse table, daykeepers did not apply it – or not consistently – in computing the chronological placements of that table's stations. There are intervals of 81 months between two pairs of stations in the table: one such interval is indeed 2,392 days, between the contrived stations at days 6,083 and 8,475, but the interval between the contrived stations at days 6,083 and 8,475 is 2,393 days. (It is impossible for this interval to occur between two underlying stations in the table, since eclipses are never observed 81 months apart in Mayan territory [see Table 5a]). Satterthwaite (Reference Satterthwaite1947:97–98) argued on other grounds that a 2,392-day cycle with a fixed pattern of 29- and 30-day months could not have been consistently applied across the entirety of the eclipse table.
There is further evidence against the possibility that the Dresden table relates to a model in which a 2,392-day interval was a consistent element for placing lunar stations. Calculating forward and backward from its 69 recorded lunar stations by intervals of 2,392 days and multiples thereof, it is possible to project the position of an additional 268 lunar stations – yielding positions for 337 of the 405 lunar months in the span of the table. Forty-two of these stations show discrepancies: 27 place three successive stations so that there are two successive intervals of 29 days; 10 place two stations at intervals of 58 days, which must either be broken into two successive intervals of 29 days or include one interval shorter than 29 days and one longer than 30; and five are at intervals of only 28 days. There are also inconsistencies in the placements of stations. Among recorded stations, projections yield a placement at day 2,097 instead of the recorded 2,096; for the station at day 4,489, a station is correctly projected from one station to that day but from another incorrectly to day 4,488. Extension to lunar stations between the recorded stations, from different recorded stations by different multiples of 2,392 days, yield several inconsistent placements of unrecorded lunar stations.
Evidence for a 502-Day Computing Interval for Lunar Month Placements
Projecting underlying stations from other underlying stations
When only the stations of the underlying model are addressed, several regularities in the intereclipse intervals emerge (see Table 6). In the following discussion, I refer to intervals of 11 or 17 months between successive underlying stations as “gaps,” zones longer than six months between successive eclipse stations.
Interstation intervals among underlying stations, illustrating the recurrence of 502-day intervals.

All five 17-month intervals between successive underlying stations are exactly 502 days long. All four 11-month intervals between successive underlying stations are 325 days long, and the next (6-month) interval is always 177 days long, for a total of 502 days since the last underlying station before the gap.
Accordingly, from the nine underlying stations immediately before a gap, a 502-day interval always reaches the first or second underlying station after that gap. This regularity contrasts with the common occurrence of intereclipse intervals of 501 and 503 days observationally, ranging at least from 501.213 to 502.924 days for new moons and 501.2118 to 502.9250 for full moons. The range of values is 1.7104 days. There are three arguably straightforward rounding-off strategies for assigning a specific interval length to 501, 502, or 503 days: to round down (truncate) to the highest integer no higher than the cycle length (yielding a probability that nine intervals would be assigned by chance alone to 502 days ≈ [0.9236 / 1.7104]9 = 0.0039); to round up to the lowest integer no lower than the cycle length (probability ≈ [0.7868 / 1.7104]9 = 0.0009); or to round to the nearest integer (probability ≈ [1 / 1.7104]9 = 0.0080). The improbability of each strategy points to the use of a formal model for placing these stations.
Another 26 intervals also support this equivalence. All intervals between successive underlying stations, except for those of 502 or 325 days, are six months long. These yield 26 18-month intervals in the table. If 17-month intervals were modeled by the designers of the table as consistently of 502 days, then the 18-month intervals should all be 502 + 29 = 531 days or 502 + 30 = 532 days. This is what we find in the table: 15 of the 18-month intervals are of 531 days, and the other 11 are of 532 days.
Postulating a breakdown of the 18-month intervals into a 17-month interval of 502 days followed by one month also entails treating the first 12 months as being followed by a five-month interval, whose length depends upon the length of the 12-month span. In current work, Mayan models for five-month intervals are treated as including two or three 29-day groups and three or two 30-day groups, yielding totals of 147 or 148 days. The Dresden 12-month groups should then all be 354 (= 502 −148) or 355 (= 502 − 147) days long, and so they are: 25 of them are 354 and 10 are 355 days long.
Observationally, 18-month intervals range only from 530.594 to 532.606 days; rounding to the nearest integer, on average about 24.6 out of 26 18-month groups would be 531 or 532 days long. Similarly, 12-month intervals range only from 353.960 to 354.726 days – rounding to the nearest integer, to 354 or 355 days only. It could have been these regularities, and the modeling of five-month intervals as always 147 or 148 days long, that suggested the use of a constant 502 days for 17 months.
Overall, then, for the 35 intervals of 17 or 18 months where the issue can be addressed (64 percent of the underlying stations) it is consistent to equate 17 months with 502 days. In contrast to the situation with the 2,392-day model, no incorrect or inconsistent placements of dates arise among 17- or 18-month intervals.
If daykeepers equated 17 months with 502 days to compute the placement of lunar stations from underlying stations, this can be tested, as with the 2,392-day interval, by projecting forward and backward from underlying stations, at least within the underlying zones, at multiples of 502 days. Doing so, and applying the constraint that two 29-day months cannot occur adjacent to one another, it is possible to project the positions of 169 non-eclipse lunar stations among the underlying eclipse stations that appear at six-month intervals; 165 (80 percent) can be determined among 205 such stations within the 41- and 47-month zones that are separated by the 11- and 17-month gaps. Unlike the results for the 2,392-day cycle, no contradiction emerges: in no case does it become necessary to place two 29-day months in sequence, nor do impossible intervals like 28-day months or 58-day spans result. Differences in the patterns among the different groups are due to differences in the placements of the 178-day intervals.
Table 7 shows the result of projecting from recorded underlying stations to intermediate, unrecorded stations at multiples of 502 days.
The underlying table can be represented as partly overlapping 502-day sequences. In the body of the table, bolded numbers correspond to underlying stations in the eclipse table. Greyed boxes enclose intervals in which a pair of 30-day months must be adjacent.

A consequence of a computing equivalence of 17 months with 502 days is that there can be no sequences of three successive 30-day months in the periods of six or seven successive underlying stations at six-month intervals; if there were, adjacent sequences of 14 months would consist of only six months of 30 days but eight of 29, so that two 29-month groups would have to occur in succession. Similarly, if two successive intervals of 30-days appear twice within a 17-month span, the remaining 13 stations have only five months of 30 and eight of 29 days. Lounsbury (Reference Lounsbury1978:800) shows that there had to have been these types of near-in-time recurrences of 30-day pairs or triples, on the assumption that they were computed across the entirety of the table. If we are to maintain that successive months cannot be 29 days long, that assumption must be incorrect: the computations that resulted in the recorded stations were made over shorter spans.
Note that projections were not made at multiples of 502 days. If they had been, an interval of 88 months would have been modeled consistently as 2,599 = 5 × 502 + 2 × 30 + 29 days; in fact, 88-month intervals vary almost equally between 2,599 and 2,598 days; once it is 2,600 days long.
Projecting underlying stations from contrived stations
Results of projections from contrived stations are quite different. There are five 17-month intervals between a contrived station and a later underlying station; the interval in each case is 503 days long. The contrast between the consistent lengths of forward projections from underlying versus contrived stations suggests a systematic difference in how daykeepers computed the positions of stations in these categories; the 502-day interval is the more appropriate, since 17 months average 502.02 days.
The above results do not include any projections from an underlying station into the 11- or 17-month gap between underlying stations – the spans in which the contrived stations fall. Of the fourteen contrived stations in these gaps, nine follow an underlying eclipse station (including the table's base) by 17 months, always of 502 days; the other five follow an underlying station after 18 months, always 531 (= 502 + 29) days. A hypothesis that daykeepers made 502-day projections from intermediate underlying stations into the zone of contrived stations, however, leads to contradictions. If this were so, projections backward from recorded contrived stations – including from the seven that do not follow a recorded underlying station by 17 months – should reach lunar stations that fall between successive underlying stations. A backward projection from the contrived station at day 6,083, however, results in a station at day 5,581 (= 6,083 − 502), a month after the underlying station at day 5,552, which would, in turn, follow a station projected to day 5,523, 502 days after the underlying station at day 5,021; this yields two pairs of successive 29-day intervals. This hypothesis also produces two successive 30-day months immediately afterward, and another such pair within the preceding four months; but two pairs of 30-day months cannot appear within a single 17-month period among underlying stations unless successive 29-day months are allowed.
Therefore, while a 502-day computing interval seems to have been part of the procedure for setting the exact dates of underlying lunar stations, including lunar stations intermediate between eclipse stations, it could not have been used consistently to project intermediate contrived lunar stations. Such projections are more numerous yet completely consistent, however, within the spans of underlying stations at six-month intervals. This reinforces the view that contrived stations were not a focus of daykeepers’ attention in designing the eclipse table. It suggests more generally that daykeepers were not projecting at longer time intervals than the spans of the successive underlying stations. The 502-day interval was used for short-term projections from the first station in one series to the first in the next, after an 11- or 17-month gap – that is, within each saros component of 47 or 41 months, spans whose alternation tracks the position of the nodes (or any position within the eclipse zone). This accounts for the fact that the 2,392-day (81-month) interval produces inconsistencies: it exceeds the maximal span of 47 months within which daykeepers seemed to have calculated the placement of their eclipse stations.
PLACING THE ECLIPSE TABLE IN REAL TIME
This section shows that the table's structure and dates correspond to one of four historical series of solar eclipse stations.
Procedure
The key constraints for fitting the table to real eclipse sequences come from its five eclipse families that are identified above as beginning or ending while a single pass through the table is in progress – four of them identified in Table 3, and another in The Number of Families in the Table's Zones. The constraints are:

Evaluating the fit of real eclipse families to the tabular constraints depends upon a correlation between the DC of the eclipse table and real time.
Assuming no significant resetting of the calendar, multiple independent colonial sources allow us to place the correlation between Lowland Mayan DCs and the European calendar to within ±1 day (Kelley Reference Kelley1976:30–32); it is therefore possible to constrain the possible placement of the eclipse table in real time. Note that this is a separate issue from the still-debated correlation of the long count with European time; the solutions to be determined here do not depend on the choice of long count correlation.
The time of day on which the DC date changes could be a potential source of uncertainty for relating table dates to real-time eclipse dates; for example, an afternoon solar eclipse that follows a morning solar eclipse by 2,599 days in the European calendar would follow by 2,600 days in Mayan chronology if the DC date changed at noon, as the colonial Zapotec calendar did (Córdova Reference de Córdova1578:212).
If the table is basically predictive, as its conformity to a 502-day computing model suggests, the appropriate dates for calibration of at least the later stations are expected rather than observed dates and times of eclipses. For individual eclipses, the departures of actual dates for individual eclipses can be high enough that a station observation will not always agree with expectation to within one day. The standard deviations of intereclipse intervals within the zones in which daykeepers projected stations, between six and 47 months, are as high as 0.62 days. The overall differences between the two assessments are minor and do not affect the viability of any candidate series.
I place the first and last stations of each empirical family according to calculations using fractional arithmetic and statistical analysis of 1,600 years of data, including my estimate of a regression of DC dates in eclipse zones of one day in the per 7,140.895 days; Mayan models are unknown but certainly different.
To adjust for these sources of error I use central values for the DC correlation. In terms of the Goodman family, this corresponds roughly to a constant of 584,284. The effect of sensitivity to different correlations can be addressed by analyzing differences between individual and average departures.
Mathews’ (Reference Mathews, Houston, Mazariegos and Stuart2001) evidence that the DC date did not change during daylight is widely accepted, and I am not aware of evidence for a change of DC between sunrise and sunset among Lowland Mayans. I implement this constraint by the expedient of using a DC correlation constant that is an integer + 0.75 days; this makes the integer part of computed DC dates constant between successive midnights, with the fractional part corresponding to the time of day in the Yucatan peninsula to the nearest hour.
Together, this procedure justifies up to 1.25 days of difference between the table's values and empirical eclipse data. For comparing DC dates calculated from Julian day numbers, truncation of the fractional part gives by design the desired result for daytime values. For nighttime dates this depends on the time of day that the DC date changed. In keeping with the logic of this procedure, in Table 8a integer values are assigned when fractional values lie within 0.25 days of an integer + 0.5, and a value halfway between the two nearest integer values otherwise. For example, DC 178.20 becomes DC 177.5; DC 178.60 becomes DC 178; and DC 178.83 becomes DC 178.5. An entry of 178.5 can be treated as consistent with either 178 or 179; for inclusiveness, then, entries within 1.5 days of the eclipse table's DC date are treated as consistent.
Candidates for real-time calibration of the Dresden eclipse table, across five criterial stations. Four real-time calibrations of the table fall within 1.5 days of actual and average DC dates across all five criterial stations; these are all and only the sets with a mean DC deviation under one day. Every one of these four (and half of the others) capture every visible solar eclipse in their span; for three, the average absolute deviation from an extreme position in its family is less than one station.

The DC date of each station is given in terms of both its actual day and time, and what is expected based on regression over the survey. I consider expected dates to better approximate daykeepers’ models. The differences, however, happen to have no consequence. In only four of the 60 comparisons in Table 8a is an actual eclipse date within 1.5 days of a criterial DC while its projected date is two or more days discrepant; in the series of five criterial stations in which each occurs, the actual and projected dates are both more than 1.5 days discrepant in three or four other criterial stations, eliminating each such series as a candidate.
To accommodate the fullest range of alternatives to match the Dresden constraints, I use empirical uniform zone widths including data from before 200 c.e., for which the minimum zone widths are 0.6 days broader than the maximum that the Dresden table calls for.
Calibration as a Solar Eclipse Table
The applicability of these criteria depends on my assessments of the DC maxima and minima being approximately correct. These limits correlate closely with zone widths; because the zone widths recovered for the Dresden table agree very closely with the empirical results for solar eclipses, the Mayan placement within the slightly broader empirical zones should be among the solutions reached here. But the analytic results are fractional-arithmetic approximations to an unknown Mayan system; in identifying candidates, I begin inclusively rather than restrictively.
For the first of the five criterial stations, for a family beginning at day 3,130 of the Dresden table on DC 179, those families were identified whose projected first station falls within four days of that date. The allowed discrepancy corresponds to families beginning up to three stations earlier or later than the criterion, assuring that no plausible candidate family could be missed. Three families meet this criterion.
From each of the three extreme stations so identified, the DC date and place in the family of each of the four remaining criterial eclipse stations of Table 8 was calculated. For each family, the data for each criterion for six successive stations is registered; six stations span a range of 6.54 days in the DC, within which a viable band of two to three days can be located. For the earliest of the three initial candidate families, not one of these six sets of stations falls within a 2.5-day range for all criterial dates, so it is eliminated. Two families yield viable calibrations.
Four real-time placements of the stations of the eclipse table are consistent both with the constraints specified above and with the set of underlying stations recovered in this study; two begin at successive stations in one eclipse family, and two at successive stations in that family's successor. All are for solar eclipses. The attempt to calibrate the table to any series of lunar eclipses proved fruitless; in fact it is impossible in principle, since the eclipse zones in the table are too narrow (see The Eclipse Table Concerns Solar Eclipses, above).
Table 8a lists those solar stations from the 1,600-year survey that are candidates for matching the five criterial eclipse stations – those that fell at or near the first or last station of an eclipse family, at or near its DC date in the Dresden eclipse table, separated by the same number of months as the corresponding stations in the table. For comparison, it also includes earlier and later stations in the same two families, some or all of whose DC dates fall outside the ±1.5-day limit for deviation from the table's recorded DC date. For each criterion, stations with bolded dates DC and Julian dates fall within the ±1.5-day limits; those with greyed dates depart by more than 2.5 days.
For every candidate series, Table 8b summarizes the data across all five criterial stations, giving the means of the deviations of the projected DC dates for all criteria, and of the absolute difference of the five stations from the analytical first or last station of the empirical eclipse families. I reject as a candidate any series with more than 2.5 days discrepancy on any criterion. Four series survive as viable candidates; Table 9 lays out the correspondence of the stations of the Dresden eclipse table with the dates of solar eclipses for all four 405-month candidate series.
Real-time layouts of the Dresden eclipse table; stations separated by 11 or 17 months are separated visually by a horizontal line. (a) The dates for each station of the Julian dates under each of the four candidate placements of the table are given in Greenwich Mean Time. Dates of eclipses judged observable in Mayan territory are highlighted in grey; total and annular eclipses are enclosed in boxes. (b) DC dates of the table are compared with estimated DCs by subtracting 58,4283.75 from the Julian Day Number of the eclipse at the sun's maximum obscuration; for each placement, the average deviation across all stations is registered in italics.

Each of the four series has two important properties that support its viability. Each agrees within 1.5 days on every criterion in Table 8, and no other candidate series does so. Additionally, in the span of each solution, including the base, between nine and 12 solar eclipses were visible in all or a substantial part of the Yucatan peninsula. In the four viable series, each occurs at an underlying station of the Dresden table; among the eight other calibrations in Table 8, half do not capture one or two observable eclipses. In these respects, each solution is consistent with the set of underlying stations of the eclipse table.
The DC base dates of all four solutions are also within 1.5 days of the table's base, and each turns out to be the occasion of a solar eclipse observable in Mayan territory. These base dates span just 40 years: 7 March 1076 c.e. (10.12.9.10.8 in a Goodman correlation); 19 April 1083 c.e. (10.12.16.14.8); 4 December 1108 c.e. (10.14.2.14.8); and 16 January 1116 c.e. (10.14.10.0.8).
On most criteria these four candidates are all viable, but the 1108 base seems the least likely among them. For each criterial station in the calibration, Table 8a records the number of stations by which it departs from the first or last station in a historical eclipse family as represented in Figure 3. Discrepancies by one station are expected, because the 1.3-day average distance between successive stations in the DC is within the ± 1.5-day limit on DC agreement. A difference of up to two stations seems feasible, given that I cannot reliably model how daykeepers’ implemented a 1-day change in the limits of eclipse zones. Under the 1108 base, however, the station calibrated to the end of a family at day 3,455 is three stations away from the last station, as depicted in Figure 3; I find no straightforward justification for accepting a difference of three stations from expectation. The average of the absolute differences in station placement for this base at 1.8 stations is more than double that of the other three candidate series and approximates or exceeds that of six of the eight unacceptable calibrations in Table 8b.
Makemson (Reference Makemson1943:193–201) previously suggested 10.12.16.14.8 (1083 c.e.) as the likely historical base for the eclipse table, partly for reasons not clearly relevant; for different reasons, Lounsbury (Reference Lounsbury1978:801–802) proposed it as one of two plausible candidates (the other, at 10.11.3.10.8, on July 21, 1050 c.e., does not satisfy the calibration constraints). Further evidence for the 10.12.16.14.8 placement, following up on Lounsbury's conceptual framework for the suggestion, is provided below (see Constructing the Preface). The 10.14.10.0.8 (1116 c.e.) base was used by Teeple (Reference Teeple1930:90) for illustrative purposes, as the date of an eclipse visible in Mayan territory that closely approximated his estimate for the position of the base within a day of a node under a Goodman family correlation; he concluded more generally (Teeple Reference Teeple1930:98) that the historical base likely fell between 10.12.0.0.0 and 10.17.0.0.0 – evidently, within 21/2 katuns of his illustrative base and about 21/2 days of its position relative to the nodes.
Circumstantial evidence supports an assignment of the eclipse table to the mid-eleventh century or later. Before 1048 c.e., the last prior evidence for the upper limit of the eclipse zones was set by the solar eclipse of July 27, 567 c.e. Data from 200 c.e. onward would have provided evidence for uniform zone widths of 21.300 days; from 100 b.c.e., for widths of 22.816 days. But the widths of the zones in the Dresden eclipse table are between 23.282 and 23.651 days. Not until the observation of a solar eclipse on September 10, 1048 c.e. was there evidence for the 24-day eclipse zones of the Dresden table; at that time, the upper limit of the eclipse zone increased (in fractional terms) by between 1.28 and 1.49 days. The solar eclipse of October 13, 1102 c.e. fell a triple saros later, a station in the eclipse table if the base was in 1076 or 1083 c.e., and the occasion for another solar eclipse that would have been observed by Lowland Mayan daykeepers, confirming this upper limit.
This evidence is merely suggestive; out of caution daykeepers could have projected into wider zones than those for which they had direct evidence.
It is unlikely that the table was intended to apply to more than one of these candidates. This can be demonstrated by considering the four intervals that separate pairs of candidate bases.
405 months: In principle, the closest agreement in the DC between stations in two successive families is expected at an interval of 405 months, and that is the case here: each of the two later bases falls 405 months after one of the two earlier bases. Empirically, however, the first station in any family was not followed 405 months later by the first station in another family until 1498 c.e.–instead, by 405 months plus one, two or (rarely) three multiples of 88 months later (see Spans Separating Beginnings and Ends of Eclipse Families, above).
405 − 88 months: An interval 88 months shorter than 405 months never separates the beginnings or ends of two families.
88 months: Every station in a table starting with the 1076 base is in the same family as, but 88 months earlier than, in a table with the 1083 base, and similarly for the 1108 and 1116 bases. In particular, with two such bases the beginnings and ends of eclipse families assigned in one table would disagree in real time with their assignments in the other. For any family, then, at most one candidate base can be viable.
405 months + 88 months: Under models based on average behavior, over this interval of 493 months the eclipse zone drifts earlier in the DC than does the station's date by 0.6178 days. For bases at this interval to be viable, the zone limit must occur at least 0.6178 days later in the DC than the final station, but less than 1.3083 days later, for the earlier station to be the first in its family. In the table, two other new families start 135 and 270 months later; after 270 months, at the tabular date 11,103, the zone limit will have drifted 1.6838 days earlier with respect to the station in the DC, beyond the 1.3083-day limit; a station at this date would not fall within the eclipse zone. Since the placement of the table's stations seems to be based largely on calculation rather than observation, I conclude that only one of the four candidates can have been intended.
Imaginably, however, if the table was largely retrospective rather than predictive, it could have been intended to apply to both the 1076 and 1116 bases. Empirically, 38 out of 105 sequences of three successive first stations and 38 out of 103 of three successive last stations include two groups of 135 and one of 223 months, yielding intervals of 405 + 88 months between successive extremes in the same zone. Given the variability in the lengths of the constituent intervals, about 24 percent of sequences of new moons at intervals of 493 months and then 135 and 270 months later can be calibrated so that each of the three stations is the first in a family.
Special Properties of the Historical Eclipse Series
Three salient properties turn out to distinguish these four 405-month intervals.
Frequency of eclipses in linear time
The number of solar eclipses observable in Mayan territory in a 405-month interval, starting with a visible solar eclipse, averages 7.761 with a sample deviation of 1.781 over 325 such intervals (all that begin with a solar eclipse in the 1,600-year sample that I have judged to be visible and that fall at least 405 months before December 31, 1500 c.e.). The maximum is 12 solar eclipses. This maximum is attained four times in Mayan solar eclipse history: when the span starts at either the 1076 or the 1083 candidate base, or at either of the two solar eclipses that fall between them (on February 25, 1077 c.e. and July 1, 1079 c.e.). Discrepancies in the second half of the table have a wider range, perhaps minor support for one of these two candidates as the historical base of the table. The other two properties support both families equally.
Projecting Lunar from Solar Stations
Even though solar eclipse zones are narrower than lunar zones, almost every lunar eclipse visible in Mayan territory could have been anticipated by projections from solar eclipse stations (also, of course, from models for lunar eclipse families). The smallest interval between a solar and lunar eclipse that averages within a day or so of the same DC date is a span of exactly thirteen 360-day years (= 9 × 520-day cycles), since 13 × 360 days averages 158 months + 14.167 days. The range is just over one day: solar to lunar intervals vary from 4,680.0271 to 4,681.0924 days, lunar to solar from 4,680.0257 to 4,681.0931. As a result, solar and lunar eclipses are frequently separated by (4,680 =) 9 × 520 days, or a day or night later; projecting forward or backward from a set of solar eclipse stations by 13 × 360 days should also capture most visible lunar eclipses in the 405-month span reached by that projection at about the same DC date. More than 98 percent of the 1,557 observable lunar eclipses in the survey could be projected at this interval from both an earlier and a later solar eclipse station; only two (a penumbral eclipse on November 13, 1361 c.e. and a partial eclipse on September 24, 1466 c.e.) are not projectable from either one.
A span of 13 years is recorded in the closing passage of the Dresden eclipse table on page 58b; Bricker and Bricker (Reference Bricker and Bricker2011: 318; cf. Martin Reference Martin1993:88) interpret it as linking actual solar and lunar eclipses (the passage in the Dresden is opaque to me). This intereclipse interval may be implicit in the epi-Olmec text on La Mojarra Stela 1 (Kaufman and Justeson Reference Kaufman and Justeson2001:35).
Density of eclipses by family
The two successive eclipse families that begin the viable placements of the base have the densest concentration of eclipses in the surveyed 1,600 years of pre-Columbian Mayan eclipse history. This is reflected in several ways.
Within the earlier family, solar eclipses were visible in much of the Yucatan peninsula on seven out of 10 successive stations; three other families in Mayan solar eclipse history may have included seven observable solar eclipses – although three of them I rate as perhaps “noticeable” – but they are less concentrated, spread among 16 to 18 rather than only 10 stations; and no other family has more than six observable solar eclipses. Eclipses were observable on four successive stations in this family, something that occurred only three times in 1,600 years among 278 solar eclipse “sequences” – these sequences averaging 1.187 eclipses, with 242 consisting of a single eclipse.
Only in the second candidate family, which is the immediate successor of the first, were so many solar eclipses observable over so few stations. In it, 11 of 15 successive stations were occasions for eclipses visible in Mayan territory, the most for any family in the survey. This set of stations includes a sequence of five eclipses observable across five successive stations, from December 4, 1108 c.e. to May 21, 1137 c.e. – the longest uninterrupted sequence in the survey.
Successive solar eclipses
Each of the four candidate bases was the occasion of a solar eclipse visible in Mayan territory; each base was followed by both a second and a third visible eclipse at the next two stations in its family (so the 1083 and 1116 bases were each preceded by a visible eclipse at the preceding station). For each candidate series, at least four of its base family's five stations in the course of the table were occasions of partial, annular, or total eclipses observable in the Yucatan peninsula – all five for the 1108 base.
At no other time in the survey were so many eclipses observed among five successive stations in any eclipse family. In the 1,176 years preceding the first candidate base, only five times were partial and/or annular/total solar eclipses observable on three successive stations, and only seven other times on two sequential stations. The last time three such eclipses were seen on successive stations came with the total solar eclipse of August 26, 797 c.e., about 300 years before; the last time for two, with the partial eclipse of June 18, 931 c.e., about 150 years earlier.
Triple saros
It seems likely that two successive families having such unusually rich profiles would have spurred investigation by Mayan daykeepers. When these successive families are compared, a striking result emerges: six of the seven solar eclipses visible in the first family were replicated in the next, always three stations later in the second family. This consistent interval of 405 + 3 × 88 months raises another plausible Mesoamerican construct: a (triple saros) cycle of 669 months. This period, known elsewhere as an exeligmos, is more readily discoverable than the saros, especially for solar eclipses; the timing of the eclipse shifts about eight hours in the saros, but after the triple saros the times of day of the eclipse and the longitudes of its path are closely similar (Espenak and Meeus Reference Espenak and Meeus2006:37–38). In my empirical assignments of first and last stations in each solar eclipse family, six of 104 first and nine of 107 last stations occur 669 months apart, always when three successive extreme stations fall 223 months apart.
To my knowledge, this very natural period has not been previously recognized in studies of indigenous Mesoamerican astronomy, but it is a direct consequence of the near-equivalence of two DC cycles with three internodal cycles. The saros commensurates 38 internodal cycles with 223 months, with an average deviation of about 0.42 days. Because a triple internodal cycle is a near multiple of the DC, a triple saros is as well 669 months = (38 × 520) − 4.038 days = 114 internodal cycles − 1.271 days. In fact, 62 percent (= 58 / 89) of total and annular eclipses visible in Mayan territory, and that are 669 months after the beginning or before the end of the survey, are followed or preceded after exactly 669 months by what I have classified as an observable solar eclipse. If randomly distributed, about 23 percent would be expected (mean = 20.69, SD = ± 3.985). This cycle may have been the most reliable guide to the observability of solar eclipses available to Mesoamerican daykeepers. Furthermore, projections in the DC at this interval are more reliable than that of any shorter intereclipse cycle, with an average shift in time of day under 55 minutes and a standard deviation under two hours; this intereclipse interval reliably produces a shift of four days in the DC.
Observation versus Projection of the Eclipse Table's Stations
The high frequency of solar eclipses in both linear time and in the base families, and the visibility of solar eclipses on at least the first two stations of the table, are circumstances so rare that they suggest the table was constructed after the cycle to which it refers was underway. These properties have different consequences.
The high frequency of visible eclipses in the base families would become known only well into the table's span. If relevant, this would entail that the table was devised as a record of a fairly complete 405-month sequence – and if so, presumably that for 1076 or 1083, which have more visible eclipses than the 1108 or 1116 sequences both overall and from earlier within them. But circumstantial evidence from the pattern of deviation of the table's dates from actual eclipse dates suggest, instead, that the table was anchored in observation of solar eclipses at immediately successive stations in a family and was filled out thereafter by calculation. At least for the 1076 and 1083 bases, this would also yield an unusual concentration of visible eclipses in linear time, with each having four visible solar eclipses in the first 88 months; just one or two would occur on average.
Using average lunations, deviations from the placement of the stations in each calibrated solution are identical, ranging from −0.89 to + 0.86 days. Using actual eclipse dates, each of the four placements has more extreme deviations, and a uniformly larger range of deviation – with maxima of the deviation in either direction of 2.02, 1.12, 1.64, and 1.32 days for the 1076, 1083, 1108, and 1116 bases, respectively, and overall ranges of deviation from 2.10 to 3.01 days. This suggests that the table's stations were mostly projected to something like average placements, and are not records of observed eclipse stations.
These results are affected by the discrepancy between the model correlation and the true but unproven correlation between the DC and the computed eclipse dates. This can be controlled for by subtracting the average deviation across all 56 stations (including the base) from the individual deviations for each placement.
In all four viable placements of the table, both the base and the next two stations in the base's family were occasions of solar eclipses observable in Yucatan. For the 1083 base, the average discrepancy across all stations is −0.39 days; the adjusted discrepancy at the base, the occasion of an annular solar eclipse visible in Yucatan, is only +0.01 days, and the adjusted discrepancy at day 2,599, the second station in this family, is +0.06 days. In contrast, by the next station, at day 5,198, the discrepancy is −0.97 days, approximating the full range of variability in the remainder of the table (between +1.10 and −1.11 days, adjusted). The results for the 1116 base are similar, since the 1083 and 1116 bases are separated by 405 months. The adjusted discrepancy at this base is +0.08 days, +0.13 days at day 2,599, but −0.83 days at day 5,198. Since nothing in the process of calibrating the tables would promote such results, I interpret them as evidence that the table was constructed after the eclipses at the base and at the next station in its family were observed – solar eclipses at two successive stations having been a rarity – and that the remainder of the table was constructed according to a daykeeper's model.
For the other candidate bases and their stations at day 2,599, the discrepancies are less striking, but still moderate: for the 1076 base, they are −0.23 and −0.30 days, and for the 1108 base −0.47 and −0.22. For day 1,033 under the 1076 base, however, the discrepancy is +1.78 days, the most extreme departure for any station of any calibrated solution; if the table through day 2,599 was based in part on observation, so extreme a departure makes that base improbable. For the other three bases, discrepancies through day 2,599 are all within one day.
Calendar Correlation
Including the base dates, each real-time placement of the Dresden eclipse table provides 56 expected DC placements of underlying eclipse stations, with averages accurate to within roughly one day. While the precise DC dates of eclipse stations in the table were clearly fixed by computation and not observation, the cumulative distribution of the deviations is almost linear in each case; the deviations can be treated as uniformly distributed random effects. The later set of 56 DC dates are earlier, on average, by 1.312 days compared to the later set for the first family and by 1.300 days for the second. This accords with expectation: a set of corresponding lunar station dates shifts earlier after 88 months, on average, by 2,600 − (88 × 29.530587) = 1.3083 days in the DC.
In each family, the earlier of the two candidate sets for real-time placements of eclipse stations are closely similar, and the later sets are closely similar. The earlier sets have average deviations −0.922 days and −0.927 days; these deviations are minimized by Goodman-family constants of 584,284.67 and 584,284.55. The later sets have deviations of + 0.381 and + 0.499 days, minimized by constants 584,283.37 and 584,283.25. Being averages themselves, these results are not seriously affected by using average projected dates rather than the more variable actual eclipse dates; the differences are always under 0.14 days. Given the uncertainty over how daykeepers’ procedures were implemented, it seems unsafe to use these differences to support a particular correlation or a particular placement of the table.
DID MESOAMERICAN DAYKEEPERS USE AN ECLIPSE-FAMILY MODEL?
This study has presented direct evidence that creators of the Dresden Codex eclipse table had an understanding of the timing of eclipses that conforms to an eclipse family model: the distinction between 55 underlying stations on which an eclipse might be observed and 14 contrived stations on which they would not be observed is verified by several facts.
First, the format of the table makes it possible to identify just which stations were underlying and which were contrived.
Second, every station that eclipse-family constraints yield as an underlying station, including the base, is separated from each of the other 55 stations by an intereclipse interval attested in Lowland Mayan territory between 100 b.c.e. and 1500 c.e.; in contrast, every contrived station is separated from multiple contrived stations – on average, from over five of the 14 – by non-occurring intereclipse intervals.
Third, the specific placements of the 55 underlying stations are consistent with computations equating 17 months with a constant 502 days, while 17-month projections from contrived into following underlying stations are uniformly of 503 days.
Fourth, the underlying stations conform to a saros structure, consisting of 41- and 47-month groups in 223-month sets, each set in the sequence 47, 41, 47, 41, 47 of a standard saros series. When underlying and contrived stations are not distinguished, the runs divide at five-month intervals into nine groups, with three at the perplexing lengths of 53 or 59 months and two at 35 months.
Finally, in each candidate, every underlying station on which no eclipse was observable locally is the date of a solar eclipse observable somewhere on earth; in contrast, between one and four of the 14 contrived stations (not registered in Table 9) correspond to no eclipse anywhere on earth.
Inasmuch as eclipse families represent the actual observable stations of solar and lunar eclipses, the data presented here shows only that Mayan daykeepers operated with some model, consistent with an eclipse family representation, that accurately distinguishes new moons on which a solar eclipse might occur at Mesoamerican latitudes from those that do not. A priori, however, it is at the very least plausible that their model was anchored in the DC, since it is the common framework for all astronomical tables known from pre-Columbian Mesoamerica; and it must have been especially striking for daykeepers, and an eclipse-family construct should have been suggested by the fact, that it was commonplace for mini-families of lunar eclipses to be visible every 88 months for long periods. A Zapotec daykeeper's annotations in a DC manual from the 1690s strongly suggests that the basic 88-month unit of the eclipse family construct was indeed known, and guarded as secret knowledge (Justeson Reference Justeson, Dowd and Milbraith2015:311–312; Justeson and Tavárez Reference Justeson, Tavárez, Ruggles and Urton2007:50, Tavárez and Justeson Reference Tavárez and Justeson2008:77–79).
At the end of the seventeenth century, each Zapotec daykeeper still kept and used a manual laying out the 260 days of the DC in sequence, including a great deal of auxiliary information – names of subdivisions of that calendar, layouts of the names of years, and varied kinds of divinatory characteristics of the days. Several days are labeled as the feast of a saint in the Catholic liturgical calendar; except for Christmas, these are covert references to dates of important community events or that are significant in indigenous calendars or thinking. In the northern Zapotec region, the Inquisition confiscated these manuals in connection with communal confessions of idolatry in 1704–1705. Specific dates in these manuals, when they can be determined, are almost all confined to the years 1691 through 1694. In Calendar 63, the DC date 6 Water is ascribed to the feast of San Gregorio (Taumaturgo), on November 29, 1686 c.e. This was the date of a magnitude 0.5126 lunar eclipse visible in Zapotec country. Its Gregorian date is outside the range otherwise attested for this document and for most documents in the corpus. Another lunar eclipse of magnitude 0.2444, however, took place on January 11, 1694 c.e., 88 months after the one marked in the calendar. Tavárez determined that the annotation was written in another hand than that in which the calendar was composed. This suggests that Colonial northern Zapotec daykeepers took special note of pairs of eclipses that were successive members of eclipse families, occurring at intervals of roughly 2,600 days. The only other eclipse record I have recognized in these calendars has a parallel significance. It is an explicit reference to the occurrence of a lunar eclipse 516 or 517 days after a prior solar eclipse – the shortest interval separating a lunar and solar eclipse at about the same DC date (Justeson and Tavárez Reference Justeson, Tavárez, Ruggles and Urton2007:42–46, Tavárez and Justeson Reference Tavárez and Justeson2008:70–75).
CONSTRUCTING THE PREFACE (DRESDEN 51a–52a)
As stated at the outset of this paper, there are two general approaches to the analysis of the body of the Dresden eclipse table. One is in terms of eclipse stations – dates on which eclipses might be seen. This I judge to have been the approach taken by most scholars since Willson (Reference Willson1924) recognized its eclipse association, and it was the basis for Teeple's (Reference Teeple1930) groundbreaking work on the timing of eclipses. The other approach is in terms of eclipse seasons or spans, of about one lunation, during which eclipses, both solar and lunar, might be seen.
Because the eclipse-family representation concerns the dates of potential eclipse stations, applying it depends on an assumption that the calendrical stations in the eclipse table are intended as dates on which eclipses might be seen. If it is assumed, instead, that the table's stations concern eclipse seasons rather than eclipse stations, it seems necessary but quite implausible to dismiss as coincidental the detailed set of agreements of its application with empirical results on patterns of eclipse occurrence in Mayan territory, and the several previously unidentified structural features of the table that its application reveals. Yet, the mere recording of a formal base of the table at 9.16.4.10.8 12 Lamat, with none from three centuries later, is treated by some as a prima facie case that this long count specifies the historical era to which the lunar stations in the following pages pertain. This section shows that there is a straightforward account for the use of 9.16.4.10.8 as the formal base of the table in terms of the results reported in this study; its essential features were pointed out decades ago by Lounsbury (Reference Lounsbury1976, Reference Lounsbury1978:804–808).
Formal Anchors of the Eclipse Table
The formal base is just one of three long count dates, at 15-day intervals, that appear together in the preface of the eclipse table: the black date 9.16.4.10.8 12 Lamat and the red 9.16.4.11.3 1 Ak'b'al are intertwined, and the black 9.16.4.[11].18 3 Etz'nab’ is adjacent. Makemson (Reference Makemson1943:187–188) interpreted these dates straightforwardly, in the context of an eclipse table, as representing an eclipse season of two potential lunar eclipse dates with a potential solar eclipse date between them, or two solar stations surrounding a lunar one (cf. Lounsbury Reference Lounsbury1978:800–801). She concluded that a node must fall on, or very near, the middle date, 9.16.4.11.3, not on 9.16.4.10.8, and that the table proper, with its base at 12 Lamat, therefore pertained to an era in which the node fell about 15 days earlier, which she estimated as about six calendar rounds later.
Incidentally, Bricker and Bricker (Reference Bricker and Bricker2011:254, note 1) mistakenly state that Makemson set the base of the table at 10.12.0.16.8. This was Makemson's ballpark estimate of when the nodes fall around the right date, using Teeple's estimate of a 5.2-day shift in two calendar rounds. Her candidate placements were 9.16.4.10.8, 10.9.10.6.8, 10.12.16.14.8, 10.15.3.4.8, 10.19.9.12.8, and 11.2.16.2.8; her actual placement was at 10.12.16.14.8, based on criteria that are not clearly relevant, relating to Venus conjunctions and the placements of images (and therefore of 148-day intervals).
This is not the only possible interpretation of this sequence; Bricker and Bricker (Reference Bricker and Bricker1983:2, Reference Bricker and Bricker2011:254) cite the same data, also in terms of eclipse seasons, but interpret them as concurrent contemporary base dates for the table. But whether or not Makemson's interpretation is correct, the possibility that this formal base of the table was not intended to be interpreted as near a node is a straightforward possibility; the circumstantial evidence of a long count date whose DC date is within a day of the DC base of the table proper is no more definitive than the contrary circumstantial evidence for it being 15 days prenodal.
Historical Anchors of Astronomical Tables in the Dresden Codex
There is a clear, established, and well-known precedent in another astronomical table for a formal base that is not the intended historical base from which the stations of the table are computed. Its properties are pertinent to understanding the relation of the historical base of the eclipse table to its formal base.
The six pages immediately preceding the eclipse table are occupied by a Venus table, whose historical base is universally understood to be at roughly the heliacal rise of Venus: its intended placement is taken by most specialists to be on or within a few days of heliacal rise, and by Bricker and Bricker (Reference Bricker, Bricker, Ruggles and Urton2007) to be near but no later than heliacal rise.
The formal base of the Venus table, recorded in its preface, is 9.9.9.16.0 1 Ahau 18 Kankin; it is reached by an interval of 9.9.16.0.0 (= 1,366,560 days) from the instance of the date 1 Ahau 18 Kankin that is nearest the base of the long count at 13.0.0.0.0. The body of the Venus table progresses through four regularly spaced stations in every canonical Venus cycle of 584 days; it would pass through 65 such cycles in a full run of the table. The synodic cycle of Venus, however, averages only 583.92166 days (Gingerich Reference Gingerich, Stahlman and Gingerich1963:xv); over time, the canonical cycles shift later with respect to heliacal rise, by an average of 5.09 days in 65 cycles. A line in the table's preface provides corrective intervals (“adjustment numbers”) – multiples of 260 days that differ from a multiple of 584 days by a small multiple of four days:
 $$\eqalign{ 9.11.7.0 &= 265 \times 260\;{\rm days} = 118 \times 584 - 12\;{\rm days} \cr &= 118\;{\rm Venus\;cycles} - 2.76\;{\rm days } \cr 4.12.8.0 &= 128 \times 260\;{\rm days} = 57 \times 584 - 8\;{\rm days} \cr &= 57\;{\rm Venus\;cycles} - 3.53\;{\rm days}}$$
Their function was to locate new, successive bases on another date 1 Ahau, back toward but somewhat before its intended relationship to heliacal rise.
These corrective intervals are preceded in the same line by a structurally similar interval:
 $$\eqalign{ 1.5.14.4.0 &= 712 \times 260\;{\rm days} = 317 \times 584 - 8\;{\rm days} \cr &= 317\;{\rm Venus\;cycles} + 16.38\;{\rm days}}$$
Its function must be completely different because, rather than correcting for an accumulating discrepancy in the relation of heliacal rise to the table's stations, it would add substantially to that discrepancy. In fact, it does not apply to the dates in the table proper but to the formal base of the preface. When added to that base, 9.9.9.16.0 1 Ahau 18 Kankin, it reaches another base on 10.15.4.2.0 1 Ahau 18 Uo; and this calendar round date is recorded next to that of the formal base 1 Ahau 18 Kankin at the bottom left of the preface. The lateward shift of 16.83 days within the Venus cycle moves from the formal base on 18 Kankin to one that is within a day or so of heliacal rise under a Goodman-family correlation (Lounsbury Reference Lounsbury and Aveni1992:190–191). The corrective intervals in the preface, potentially combined with multiples of the table's length and applied in sequences that are debated, lead to new Venus bases in appropriate proximity to heliacal rise. The smaller interval, 4.12.8.0, reaches from the 1 Ahau 18 Uo base to what I take to be a current base of the table at 10.19.16.10.0 1 Ahau 3 Xul, whose calendar round position is recorded in the Venus table proper; the larger interval, 9.11.7.0, would lead from the 18 Uo base to the next unrecorded base on 11.4.15.9.0 1 Ahau 18 Pax. (I take the 1 Ahau 13 Mac base recorded in the table proper to correspond to a base at 11.0.3.1.0, four Venus synodic cycles later than the 3 Xul base. These bases would produce approximately contemporaneous models for the Venus cycle, which would more reliably bracket the planet's actual behavior: the 3 Xul base entails a shift earlier in the synodic cycle of Venus, on average, by 3.53 days, the 13 Mac base later, on average, by 0.78 days [Justeson Reference Justeson2009]).
The key point for present purposes is that, in the Venus table, the shift of 16.83 days in the Venus cycle between the formal base at 9.9.9.16.0 and the 1 Ahau 8 Uo base clearly marks the formal base as one that was not the intended historical base of the table proper. This interpretation is required for anyone who accepts a Goodman-family correlation.
How, then, do the formal and historical bases of the Venus table relate?
The interval between the primordial base near 4 Ahau 8 Cumku to the formal base in the historical era was contrived to have special numerological properties. It is a multiple of the 260-day cycle, the norm for the Dresden’s very long time intervals that reach the historic era (Satterthwaite's [Reference Satterthwaite1964] “companion numbers,” Thompson's [Reference Thompson1972] “long reckonings”). Although the year of 365 (= 5 × 73) days is a cycle that might be expected to be of general interest, this is the only table in the Dresden with a companion number that is a multiple of 73 days; the obvious reason is that 8 × 73 equals the 584-day length of a canonical Venus cycle, and 8 is also a factor of 712 × 260. Overall, this companion number equals 23×32×37,960 days; 37,960 days is the canonical length of one pass through the Venus table, and is the smallest number commensurating the 260-day DC with the 584-day canonical Venus cycle. The multiplier consists only of small prime factors two and three. It is also the only companion number in the Dresden that is divisible by 360; while this might have been intended to capture the commensuration of the Venus cycle with intervals between lunar and solar eclipses, it could easily be due to chance. Most companion numbers are divisible by 260 = 13 × 20; these are divisible by 360 if by 18 × 260. Among the twelve companion numbers divisible by 260, there is a 1 – (1 −1/18)12 = 49.6 percent chance of at least one being divisible by 360.
Because the key cycle is divisible by both 73 and 260, it is also divisible by 365; for this reason, the formal base date is given as a calendar round date – that is, the date is specified in both the DC and in the 365-day year, while in the Mars and eclipse tables it is given in the DC only.
Lounsbury (Reference Lounsbury1976, Reference Lounsbury1978:802–808) discusses this interval among a set of 16 companion numbers in the Dresden Codex, showing that almost all are multiples of calendrical intervals and otherwise only of relatively small prime factors. He shows that the prime factors of the long count dates linked by these intervals typically (13 of 16 cases) have larger non-calendrical prime factors than the intervals – usually much larger; this is as expected by chance for numbers of their general size. He concludes that the companion numbers with these properties were “contrived” – designed to have topically relevant factors.
In the Dresden’s Venus, Mars, and eclipse tables, the date that is counted from is fixed: the formal base of the table in the DC or calendar round date in the historical era is reached by the contrived interval from the instance of that DC or calendar round date that is closest to 13.0.0.0.0 4 Ahau 8 Cumku, the base of the long count.
Because the primordial base near the long count base is fixed, and the interval is contrived to be a multiple of factors relevant to the content of the table in which they occur – in the Venus table, by the 260-day DC cycle and the 584-day Venus cycle – the formal date that they reach in historical time is whatever date happens to be reached by the contrived interval. The first historical base is calculated from the formal base, and later historical bases in turn were calculated from that first historical base.
The point of this discussion is that, in the Dresden Codex, an astronomical table may include in its preface a formal base, earlier than the intended historical base of the table proper – in particular, when the formal base is reached from the table's primordial base at the same date in the DC near the beginning of the long count by multiples of calendrical and topically relevant astronomical intervals. The formal base of the Dresden table is amenable to such an interpretation.
How do the Formal and Historical Bases of the Eclipse Table Relate?
The preface of the eclipse table, like that of the Venus table, begins with the 4 Ahau 8 Cumku (13.0.0.0.0) base of the long count – the only eclipse table date recorded in the calendar round, all others being expressed in the DC alone. This date is immediately followed by the notation “8 days”; added to the long count base, this reaches the date 13.0.0.0.8 12 Lamat 16 Cumku, recorded as 12 Lamat. The formal base of the eclipse table is universally understood to be the day 12 Lamat that fell on 9.16.4.10.8 in the long count; 13.0.0.0.8 is the primordial base of the table, being instance of 12 Lamat closest to 13.0.0.0.0. The interval between the primordial base and the formal base date at 9.16.4.10.8 is 1,412,840 days, equal to 11 × 13 × 19 × 520 days, where 520 days is a canonical base for eclipse recurrence in the DC.
Among 12 Lamat dates at multiples of 520 days from 13.0.0.0.8, and falling between about 8.14.0.0.0 and the latest of my candidate historical bases at 10.14.10.0.8, 88.8 percent of them have a multiplier whose prime factor is higher than 19. The interval 9.16.4.10.0 from the 12 Lamat closest to the long count base to the formal base of the eclipse table is therefore plausibly a contrived interval; its highest factor is in the range that Lounsbury found to typify very large contrived intervals, and he identified it as such (Lounsbury Reference Lounsbury1976:223). But other multiples of 520 have smaller highest prime factors – of 3, 5, 7, 11, 13, or 17; why would this one be chosen to relate the eclipse table to primordial time?
This study has shown that only four historical dates are consistent with the set of 55 stations in the table proper that are unambiguously identifiable as underlying stations of the Dresden table under an eclipse-station interpretation. Two of these historical placements – at 10.12.16.14.8 and 10.14.10.0.8 – bear an eclipse-relevant relationship to the formal base: they fall respectively 10 × 11,960 and 11 × 11,960 days after it. Neither the formal base nor either historical candidate, however, is separated from the primordial base by a multiple of 11,960 days. The formal base seems designed to relate to a primordial base, using a quintessential example of a contrived interval, and to a historical base by another such interval. Understanding this relationship depends on the intended historical base of the table.
Historical base at 10.12.16.14.8
If a formal base were contrived to be at a multiple of 11,960 days before a historical base at 10.12.16.14.8, the recorded formal base at 9.16.4.10.8 turns out to be the closest candidate, in time, for a formal base reachable by an interval with so small a prime factorization. The highest prime factors for intervals reaching dates at multiples one through nine of 520 days before 10.12.16.14.8 are, in order, 43, 967, 1439, 571, 59, 53, 199, 307, and 137.
All “historical” long count dates in the Dresden Codex – those that are not near or before the long count base – have a baktun coefficient of eight or higher. In this era, 30 long count dates besides the formal base appear at a multiple of 11,960 days before a historical base at 10.12.16.14.8. Three of them have properties like those of the formal base at 9.16.4.10.8, with the highest prime of the multiplier of 520 days being 19 or less. They are:
 $$\eqalign{ &13.0.0.0.8 + 2^{3} \times 3 \times 5 \times 19 \times 520 \cr & \quad = 8.4.13.6.8 12\;{\rm Lamat} + 29 \times 11,960 = 10.12.16.14.8; \cr &13.0.0.0.8 + 2^{5} \times 7 \times 11 \times 520 \cr & \quad = 8.17.19.2.8 12\;{\rm Lamat} + 21 \times 11,960 = 10.12.16.14.8; \cr &13.0.0.0.8 + 3 \times 5^{3} \times 7 \times 520 \cr & \quad = 9.9.11.12.8 12\;{\rm Lamat} + 14 \times 11,960 = 10.12.16.14.8; \cr &{\rm and}\;13.0.0.0.8 + 11 \times 13 \times 19 \times 520 \cr & \quad = 9.16.4.10.8 12\;{\rm Lamat} + 10 \times 11,960 = 10.12.16.14.8.}$$
Why would 9.16.4.10.8 be chosen from among these candidates? A reasonable possibility is that it was simply the nearest candidate, perhaps the first that the daykeepers encountered. The makers of the document did incorporate dates near the earliest of these candidates in this and other tables, however. Lounsbury (Reference Lounsbury1976:212) provided evidence that “the companion numbers in the Dresden Codex have arithmetic properties that betray, at least in some instances, their motivation and function,” specifically that the factors of the chosen contrived intervals relate to the goals of the contrivance. For example, as noted above, the factor 73 appears only in the Venus table, and the canonical length of the Venus cycle is 8 × 73 = 584 days.
In the eclipse table, the relevant issue is the anticipation of possible eclipses. The interval of 11,960 (= 23 × 520 ≈ 405 × 29.53059) days was meaningful as a commensuration between the eclipse cycle and the DC, and as the canonical length of the table itself. If the eclipse-family formalism was also a feature of Mayan eclipse prediction, the canonical span of 2600 (= 5 × 520) days between stations in families could also be relevant; multiples of 5 × 11,960 days might be the favored intervals to relate the historical base to a formal one. The interval 9.16.4.10.0 from the primordial base has the smallest prime factorization of any station at a multiple of 5 × 11,960 days before the historical base; the sequence of highest prime factors from the historical base backward are 59, 19, 1301, 829, 593, and 61. Lounsbury's proposed historical base for the table fits the empirical constraints on its placement, and is also the only solution incorporating the factors of the both the 88- and 405-month commensurations with the DC.
This rationale for the historical base was effectively presented decades ago by Lounsbury. Its elaboration here is most important in that it suggests, strongly in my view, that the historical base of the Dresden eclipse table was at 10.12.16.14.8; that is the only date at a multiple of 11,960 days after the formal base under a Goodman-family correlation that adequately fits the DC dates of the beginnings and ends of eclipse families in the Dresden table. Figure 9 lays out the Espenak-Meeus maps for every underlying station in the eclipse table figured from this base date.
Eclipse maps for the stations of the Dresden eclipse table, starting from a base at April 19, 1083 c.e. (from Espenak & Meeus Reference Espenak and Meeus2009: A367–A370). The twelve solar eclipses visible in Mayan country during this span are enclosed within a heavy outline. Each column displays successive eclipse stations within the same eclipse family, 88 months apart; when an eclipse family appears or dies out during the span of the table, this is indicated by one or more empty zones above or below the stations of the family. Each row displays successive eclipses in linear time, the last station in each row preceding the first in the next. In each row, in the left half a single empty box between maps corresponds to an 11-month interval between stations; two empty boxes corresponds to a 17-month interval. On the right, the heavy vertical bar marks an interval of 11 months when between successive maps, and of 17 between an empty box and a map.

In Special Properties of the Historical Eclipse Series, it was found that the eclipse station on this date is in one of two successive eclipse families with the highest concentrations of observable solar eclipses on record for the Mayan area. On this date (April 19, 1083 c.e.) an annular solar eclipse passed across the Yucatan peninsula (Figure 10) with 87.34 to 87.59 percent of the sun's disk obscured in the zone of annularity, and low in the sky, between 30.4° and 24.7° above the horizon. Only 3.3 percent (81) of the 2,403 stations in solar eclipse families in the 1,600-year survey were this obscured in Lowland Mayan territory, about one every 50 years. Further, another solar eclipse was observable on the next station in the same family, another rarity in Mayan eclipse history, not seen for more than a century before this event; I suggest above that these factors led to the anchoring of the table at this particular date. These two eclipse dates have the two smallest average deviations across the 56 stations (including the base) of the entire table, while the next stations depart by nearly a full day, and I suggest that the rest of the table was designed after a predictive model based on daykeepers' knowledge of the current eclipse families and their histories.
The annular solar eclipse of April 19, 1083 c.e. The grey areas are the zone of annularity, in which the moon's disk lies entirely within the sun's. This eclipse was clearly visible throughout the Mayan lowlands; obscuration in this zone of annularity was between 87.3–88.6 percent at altitudes between 25° and 32°, and 76–87 percent in the rest of the Yucatan peninsula at altitudes between 24° and 30°. Figure by author.

Historical base at 10.14.10.0.8
A formal base at 9.16.4.10.8 would again be the multiple of 520 days from the primordial base nearest to this historical base candidate that has so small a prime factorization, except for this candidate base itself. The interval between the primordial base and 10.14.10.0.8 is 2 × 33 × 5 × 11 × 520. Only 4.8 percent of multiples of 520 have multipliers with so small a highest prime factor, so this date would seem at least as attractive 9.16.4.10.8 for a formal base. The rationale provided for a formal base distinct from a historical base at 10.12.16.14.8 therefore does not apply here, and I have recognized no other rationale for this distinction using a 10.14.10.0.8 base.
Given the evidence for the eclipse-station interpretation that has emerged from this study, the only straightforward interpretation for now is that the historical base of the table was in fact at 10.12.16.14.8.
Recycling and the Primordial Base: Speculation
The eclipse table could not be simply recycled after 405 months with its current stations unchanged: that the beginnings and ends of eclipse families recur at varying small multiples of 88 months more than 405 months requires adjustments in the placements of the corresponding underlying stations. Determining the placement of upcoming eclipse stations would require a reliable model, such as an eclipse family representation.
Furthermore, a new base placed 405 months after the old would shift, on average, 1.56 days later with respect to the nodes. It seems unlikely to be an accident that, in terms of the DC, the base of the eclipse table seems to fall exactly at a node (see Placing the Nodes In the Eclipse Table). One generally applicable approach would be to set the new base 47 months before the end of the table, on the station at day 10,572. With the table's base near a node, this will always be an underlying station in the table; the new base would be in a different eclipse zone with an average abnodal shift of just +0.097 days.
The proximity of the existing eclipse table's primordial base to the base of the long count at 13.0.0.0.0 suggests another approach. Daykeepers could have adjusted for the abnodal shift after 405 months, and accurately project average lunar stations forward, by projecting a new base from the table's final station a 669-month triple saros later. This projection corrects for the abnodal shift over 405 months, reducing it from 1.56 to 0.29 days. It also places DC dates very precisely, shifting, on average, by −4.038 days in the DC and with a standard deviation of only 0.081 days; this is easily the smallest variability for any intereclipse interval of this size or smaller that is close to a whole number of days.
The effect of applying this adjustment would be to place a new historical base at or near a node on 10.17.4.16.4 8 Kan 2 Yaxkin; the primordial base of this table would be 13.0.0.0.4 8 Kan 12 Cumku. A second adjustment, from the last station of this table, would set another historical base at or near a node on the year ending 11.1.13.0.0 4 Ahau 3 Zec; it would have the quintessential primordial base, at 13.0.0.0.0 4 Ahau 8 Cumku. The designers of Dresden eclipse table may have been laying the groundwork for such a table.
EPILOGUE: THE REBIRTH OF ECLIPSE FAMILIES
As noted above, an eclipse family is born at a fixed time, almost always shortly after another family dies out, and dies out about two centuries later or less. Although Mayan daykeepers may never have had the opportunity to witness it, they are also reborn.
Eclipse stations in the family recede with respect to the nodes by 0.9444 days per station; eclipse families die out when these stations lie too far from a node. Projecting forward or backward from an eclipse table station by 173.30906 / 0.9444 = 183.51 stations, however, the date that we reach would be at the same point relative to the node. Projections must be whole numbers of stations; and after 183 (1,302 years) or 184 stations (1,309 years), the DC date shifts by 280 days; later if backward in time, earlier if forward.
The Dresden eclipse table performs perfectly when projected backward by 184 stations from an April 1083 base, or by 183 from a March 1076 base, to a base on March 3, 227 b.c.e. – around 7.6.8.10.8 5 Lamat or 7.6.8.10.9 6 Muluc in a Goodman-family correlation. Every underlying station in the table corresponds to a solar eclipse station, almost always to a total, hybrid, or annular eclipse. In contrast, four contrived stations do not correspond to a solar eclipse station; of the 10 that do, every one is polar, and four are members of polar duos.
RESUMEN
Este artículo explica y aplica un modelo nuevo para identificar las fechas de eclipses mesoamericanos tanto solares como lunares, denominado “familias de eclipses.” En tiempo linear, una familia de eclipses consiste en una secuencia de fechas con posibles eclipses, separados una de otra por 88 lunaciones; y en terminos de tiempo cíclico, hay una docena (aproximadamente) de ciclos, los cuales se sobreponen parcialmente en tiempo linear.
Esta representación no sólo es un modelo que los astrónomos-adivinadores mesoamericanos pueden haber utilizado para predecir las fechas de futuros eclipses, pero también señala las verdaderas relaciones temporales entre eclipses visibles en Mesoamérica – conocidos o no entre los Mesoamericanos – y a lo mejor en todo el trópico. El artículo explica las propiedades de esta representación temporal de los eclipses lunares y solares, y son expuestos tanto en términos generales así como en su aplicación a los eclipses visibles en el territorio de las Tierras Bajas Mayas del Clásico, entre 100 a.n.e. y 1500 n.e. Cada familia de eclipses consiste en una secuencia de estaciones en la cuales un eclipse puede ser visible (aunque no necesariamente) en Mesoamérica; una estación ocurre cada 88 lunas nuevas o lunas llenas en un período de 170 a 200 años, limitado a una de las tres zonas estrechas en el calendario adivinatorio.
Varias interrelaciones entre fechas de eclipses son unas de las consecuencias lógicas de esta representación: intervalos entre estaciones sucesivas en familias concurrentes dentro de una sola zona, y estaciones sucesivas en zonas distintas; entre familias sucesivas dentro de una sola zona; entre la primera estación de una familia y la primera de otra familia, en la misma o otra zona; y entre la última estación de una familia y otra.
Se analizaron las 69 estaciones lunares en la tabla de eclipses del Códice de Dresde aplicando las relaciones temporales que están implícitas en las estructuras de familias de eclipses. Esta aplicación depende de la hipótesis – una de las dos alternativas reconecidas durante el siglo pasado – que las estaciones de la tabla, o algunas de ellas, fueron ideadas como fechas en las que un eclipse lunar o solar podría ser visto en el territorio maya. No es posible que todas las 69 estaciones fueran concebidas de esta manera; aplicando el formalismo de familias de eclipses, se identificaron precisamente cuales (55) estaciones de la tabla son consistentes y cuáles no (14) desde un principio, tomando en cuenta las restricciones sobre las ocurrencias de eclipses en el territorio Maya en cualquier período de 405 meses.
Los resultados de esta aplicación del concepto de familias de eclipses muestran que la tabla podría haber sido empleada por astrónomos-adivinadores enterados para predecir con certeza todos los eclipses solares así como casi todos los eclipses lunares. Las fechas del calendario adivinatorio en las cuales familias de eclipses específicas comenzaron o terminaron concuerdan con cuatro posibles colocaciones históricas para la tabla, cuyo rango temporal se ubicaría entre 1076 y 1116 n.e. Probablemente, la tabla fue diseñada para comenzar en abril de 1083 n.e. (10.12.16.14.8 en una correlación con la familia Goodman). Esta base podría haber sido seleccionada debido a una observación maya de dos o tres eclipses solares en estaciones consecutivas en esta familia durante este período; en vez de eso, o además de eso, pudo haberse formado debido a una lógica adivinatoria por su relación especial a la base de la cuenta larga.
ACKNOWLEDGMENTS
I thank Anne Dowd for inviting me to participate in the Fryxell symposium in honor of Anthony Aveni – and for keeping my feet to the fire to complete this work, though quite late, for this tribute to Aveni's contributions to the understanding of Mesoamerican astronomy in cultural terms. Aveni and Ignacio Cases Martín provided important guidance concerning factors influencing the visibility of eclipses, and Aveni provided detailed suggestions on an earlier draft that have significantly improved the exposition. Special thanks are due to Cases; it was our 2013 discussions of the eclipse-family model at Albany that led me to apply it to the analysis of the Dresden eclipse table. Grudging thanks are due to an anonymous reviewer with an axe to grind. The paper is now forthcoming rather than succinct about the properties, relevance, and consequences of the eclipse-family model to an extent that it is hopefully now impossible to overlook the framework of constraints that yields the results reported here; in the process, important properties of both the table and of eclipse families were also worked out. Heartfelt thanks to Adam Gordon for producing most of the graphs for this paper. Thanks are due most of all to Fred Espenak and Jean Meeus, whose extraordinary canons of solar and lunar eclipses provide such rich information on the features of solar and lunar eclipses worldwide to inform individual studies such as this.
More generally, I want to record my appreciation for the insights and rigor of two of the giants of our field who are no longer with us, close friends and colleagues of both Aveni and myself. Most evident and thoroughgoing in the work reported here is the influence of Floyd Lounsbury, a brilliant and meticulous thinker, and one of the kindest and most helpful scholars I have had the good fortune to know; in many respects this work parallels and builds on his. The other is Harvey Bricker, who passed away as this work was being completed. Harvey combined good humor, intellectual independence, an insistence on analytical clarity, and an appreciation for well-intentioned criticism – which we both had occasion to provide one another. Our lives are emptier without him, and our work more difficult and less satisfying.
APPENDIX: ECLIPSE VISIBILITY
The width of lunar eclipse zones depends on the magnitude of eclipses treated as observable. In my previous work (Justeson Reference Justeson, Dowd and Milbraith2015) on the recurrence of lunar eclipses in the DC, it was important to avoid overestimating the extent of that recurrence. I therefore excluded penumbral lunar eclipses from the analysis, following Meeus (Reference Meeus1991:353) in treating them as unobservable, as well as partial eclipses of lower magnitude. For the current study, I avoid underestimating the visibility of eclipses to avoid eliminating patterns of eclipse recurrence that might characterize the Dresden eclipse table. An important result that hinges on an overly inclusive set of eclipse candidates is that, in Lowland Mayan territory, two solar eclipses can never be seen five months apart, and only once were two umbral lunar eclipses seen five months apart during the 1,600 years of the survey on which this research is based.
Some penumbral lunar eclipses are observable. I was first made aware of this by Ignacio Cases (personal communication 2014), who had himself observed penumbral stages of lunar eclipses. Partial lunar eclipses of any magnitude are always observable if one is looking for them (Espenak and Meeus Reference Espenak and Meeus2009:13).
Penumbral lunar eclipses are not obviously the same phenomenon as umbral eclipses, since the brightly lit surface of the full moon has “only a subtle gradient across its disk … [which] only becomes readily apparent” at an umbral magnitude of about −0.05 or greater (Espenak and Meeus Reference Espenak and Meeus2009:13). As a radically different experience observationally, it is not obvious whether daykeepers would have attended to penumbral eclipses as the same phenomenon as an umbral eclipse. Every observable penumbral eclipse falls into the same eclipse family as a set of umbral eclipses, however; using eclipse zone widths based on umbral eclipses, the earliest and latest stations in a family are often penumbral. Including observable penumbral eclipses among those of interest to daykeepers, and using magnitude −0.06 or greater as a criterion for their observablity, only 37 penumbral eclipses are added to the 1,600-year survey. Among these 37, only one penumbral eclipse observable by daykeepers would fall outside an umbral eclipse zone; the width of that zone would increase from 25.57 to 26.74 days. Broadening the observability criterion to magnitude −0.075, seven more visible eclipses would be added to the survey; one, of magnitude −0.074, would widen its zone from 26.46 to 27.41 days. Whatever limiting umbral magnitude is used, penumbral eclipses are restricted to the earliest and latest DC dates in each eclipse zone.
When roughly 94 percent or more of the sun's disk is covered, the sky darkens and the air cools noticeably; such an eclipse would be noticed even when it is not being looked for. I therefore treat all solar eclipses with 94 percent or higher obscuration in Greater Lowland Mayan territory as having been observed by Maya daykeepers. Assessing the visibility of all other solar eclipses is inherently conjectural, because we cannot know what properties of solar eclipses would lead Mesoamerican daykeepers to detect them.
According to Bradley Schaefer (personal communication, 1995), a specialist in the observability of astronomical phenomena, a solar eclipse can be observed if the sun is close to the horizon when only 25–50 percent of its disk is covered. A case in point is the solar eclipse of May 2, 143 c.e. (Julian), which is referred to in the text of the La Mojarra stela. In the northern epi-Olmec region, where the monument was erected, this eclipse began variously between 6:22 and 6:23 am, at altitudes ranging from 5.8° to 6.1°; the solar disk was obscured a maximum of 54.9 to 56.4 percent, at 7:20 am when the sun was 18.9° to 19.2° above the horizon; and the eclipse ended at altitudes between 33.9° and 34.6° at 8:24 am.
Even for other solar eclipses, however, if daykeepers anticipated the possibility of an eclipse on that date, they could have checked for its occurrence by such methods as watching for a “pinhole-camera” projection of an eclipse through the leaves of shade trees, which can project thousands of images of the eclipsing sun on the ground. For an eclipse with less than 94 percent obscuration in Greater Lowland Mayan territory, then, whether it was observed by Mayan daykeepers is guesswork. For this study, I use the following heuristic. (1) Eclipses with less than 25 percent of the sun's disk obscured throughout this territory are treated as not having been observed there. (2) For eclipses whose maximum obscuration in some part of this territory fell between 25 and 94 percent, I compute an index of obscuration that is a function of the sun's altitude, from Schaefer's minimum of 25 percent at the horizon (0°) to 94 percent at 90°; I use a linear function because anything more sophisticated would suggest false precision. If the sun's obscuration is greater than the computed index (arbitrarily, at least one percent greater), the eclipse is categorized as an observed partial eclipse; otherwise, the eclipse is categorized as having been noticeable (observed by special means) when the sun's obscuration was at least 50 percent somewhere in Greater Lowland Mayan territory, and as not observed if obscuration was less than 50 percent throughout that territory.
Geographically, I treat the Lowland Mayan zone as generally embracing the areas of Yucatecan, Ch'olan, and Tzeltalan speech in the era of Spanish contact, primarily lowland areas of the Yucatan peninsula and the Tzeltalan portions of the Chiapas highlands. After 900 c.e., it excludes the southern Peten; only from 400 to 900 c.e. does it extend into highland regions of southern Guatemala and northern Honduras dominated by speakers of Lowland Mayan languages.