





1. Introduction
Cylinder-like structures in tandem arrangement are frequently adopted in engineering applications, such as offshore platforms, marine risers and tubes in heat exchangers. While the flow around two tandem cylinders in steady oncoming flow has been extensively studied (Zdravkovich Reference Zdravkovich1977; Sumner Reference Sumner2010), the influence of an adjacent free surface on this flow remains relatively unexplored, despite its relevance in ocean engineering. Typical examples include submerged floating tunnels and ocean energy converters. The aim of the present investigation is to characterize the wake dynamics of two tandem cylinders submerged at various depths beneath a free surface. This configuration may induce new wake patterns and corresponding distortions of the free surface (Sheridan, Lin & Rockwell Reference Sheridan, Lin and Rockwell1997).
There exists a large number of experimental and numerical investigations on the flow around two tandem cylinders without the presence of the free surface, ranging from the laminar flow regime of low Reynolds numbers (Carmo & Meneghini Reference Carmo and Meneghini2006; Zhao & Cheng Reference Zhao and Cheng2014), to the turbulent flow regime including both subcritical and supercritical Reynolds numbers (Okajima Reference Okajima1979; Xu et al. Reference Xu, Yu, Wang and Zhou2018; Hu, Zhang & You Reference Hu, Zhang and You2019; Ma et al. Reference Ma, Xu, Zhai and Ai2019). Comprehensive reviews regarding the flow around two circular cylinders in tandem have been provided by Zdravkovich (Reference Zdravkovich1977), Sumner (Reference Sumner2010) and Zhou & Alam (Reference Zhou and Alam2016).
A considerable amount of effort has been made to categorize the flow interference regimes. According to the Reynolds number and the separation distance between the cylinders, Igarashi (Reference Igarashi1981, Reference Igarashi1984) subdivided the flow around two circular cylinders in tandem into eight flow patterns, which were subsequently grouped into three basic types by Zdravkovich (Reference Zdravkovich1987), Xu & Zhou (Reference Xu and Zhou2004) and Sumner (Reference Sumner2010), namely: (i) the extended-body regime at small spacing ratios, where the two cylinders are sufficiently close to behave as a single blunt body; (ii) the reattachment regime at intermediate spacing ratios, where the separated shear layers from the upstream cylinder reattach onto the downstream cylinder in either an alternate or continuous manner, and eddies may form and shed in the gap region between the two cylinders; and (iii) the co-shedding regime at large spacing ratios, where the upstream cylinder is well separating from the downstream cylinder to allow the Kármán vortex shedding to occur from both cylinders.
A wide variety of flow phenomena can be observed in the reattachment regime due to the gap flow dynamics and the behaviours of the shear layers separating from the upstream cylinder, ranging from alternate reattachment to quasi-steady and intermittent reattachment, depending on the spacing ratio between the cylinders. The alternate reattachment behaviour has been detected extensively in experimental and numerical studies (Ljungkrona & Sundén Reference Ljungkrona and Sundén1993; Alam et al. Reference Alam, Moriya, Takai and Sakamoto2003; Kitagawa & Ohta Reference Kitagawa and Ohta2008). When the shear layers from the upstream cylinder reattach continuously on the downstream cylinder, the quasi-steady reattachment occurs (Igarashi Reference Igarashi1981; Zdravkovich Reference Zdravkovich1987). Lin, Yang & Rockwell (Reference Lin, Yang and Rockwell2002) reported that the instantaneous structure of the recirculation zones within the gap could exhibit both symmetrical and asymmetrical patterns through qualitative flow visualization employing a technique of high-image-density particle image velocimetry. Zhou & Yiu (Reference Zhou and Yiu2006) identified two distinctly different flow structures in the reattachment regime, depending on the location where the shear layers from the upstream cylinder reattached on the downstream cylinder. Vortex pairing in the gap shear layers of tandem cylinders was reported for the first time by Aasland et al. (Reference Aasland, Pettersen, Andersson and Jiang2022). Bi-stable flow was identified by Igarashi (Reference Igarashi1981) near the critical spacing, with the flow switching intermittently between the reattachment and co-shedding regimes, which was confirmed by Xu & Zhou (Reference Xu and Zhou2004) through the measurements of Strouhal number and observed by Carmo, Meneghini & Sherwin (Reference Carmo, Meneghini and Sherwin2010a) and Gopalan & Jaiman (Reference Gopalan and Jaiman2015) in numerical simulations. However, the determination of the critical spacing ratio at which the switchover from shear layer reattachment to Kármán vortex shedding from the upstream cylinder occurs remains somewhat elusive, varying from 3.0 to 5.0 (Okajima Reference Okajima1979; Igarashi Reference Igarashi1981; Xu & Zhou Reference Xu and Zhou2004; Alam Reference Alam2014; Yang & Stremler Reference Yang and Stremler2019), due to the strong Reynolds-number sensitivity of the flow behaviours, involving shear layer separation and reattachment, vortex impingement, pairing (Aasland et al. Reference Aasland, Pettersen, Andersson and Jiang2022), synchronization (Sumner, Price & Paidoussis Reference Sumner, Price and Paidoussis2000; Hu & Zhou Reference Hu and Zhou2008) and amalgamation (Meneghini et al. Reference Meneghini, Saltara, Siqueira and Ferrari2001) and boundary layer buffeting (Lin et al. Reference Lin, Yang and Rockwell2002) and transition (Aasland et al. Reference Aasland, Pettersen, Andersson and Jiang2022). Free-stream turbulence intensity also has an influence on the critical spacing ratio, as experimentally investigated by Ljungkrona, Norberg & Sundén (Reference Ljungkrona, Norberg and Sundén1991) and Zhang & Melbourne (Reference Zhang and Melbourne1992). Papaioannou et al. (Reference Papaioannou, Yue, Triantafyllou and Karniadakis2006) associated this dependence with the formation length and base pressure suction variations of a single cylinder by considering the effects of three-dimensionality (Tong, Cheng & Zhao Reference Tong, Cheng and Zhao2015), which was confirmed by Wang, Alam & Zhou (Reference Wang, Alam and Zhou2018) with a systematic experimental study.
On the other hand, alterations in the flow pattern are reflected in the mean and root-mean-square (r.m.s.) pressure distributions on the cylinder surfaces, drag and lift forces and the Strouhal number (Ljungkrona & Sundén Reference Ljungkrona and Sundén1993). Low fluctuating pressure on the two cylinders can be observed for the overshoot flow in the extended-body regime since the two cylinders are enclosed by the shear layers from upstream cylinder and the wake has the longest recirculation region (Zhou et al. Reference Zhou, Alam, Cao, Liao and Li2019). Arie et al. (Reference Arie, Kiya, Moriya and Mori1983) reported that the r.m.s. pressure and forces were much higher for the downstream cylinder than for the upstream cylinder for spacing ratios up to 7, and the r.m.s. lift force for the downstream cylinder was highly dependent on the spacing ratio while the r.m.s. drag for both cylinders was only weakly dependent on spacing, which was confirmed by Alam et al. (Reference Alam, Moriya, Takai and Sakamoto2003). In the alternate reattachment flow regime, the alternate impingement of the shear layers on the downstream cylinder excited a superharmonic frequency of twice the Strouhal frequency in the power spectrum of the fluctuating pressure (Alam et al. Reference Alam, Moriya, Takai and Sakamoto2003), furthermore, bi-stable flow was associated with the simultaneous occurrence of two distinct Strouhal numbers as observed by Xu & Zhou (Reference Xu and Zhou2004). The drag coefficient jumps discontinuously from negative to positive at the critical spacing where the flow jumps from the reattachment regime to the co-shedding regime, which has also been termed drag inversion separation (Carmo, Meneghini & Sherwin Reference Carmo, Meneghini and Sherwin2010b). Alam & Zhou (Reference Alam and Zhou2007) and Alam (Reference Alam2016) associated the phase lag between vortex shedding from two tandem cylinders with forces on the cylinders, and derived an empirical formulation of the phase lag, which was modified at supercritical Reynolds number by Hu et al. (Reference Hu, Zhang and You2019).
Most of the previous experimental and numerical studies on the flow around two circular cylinders in tandem have been limited to a single fluid medium, while the problem becomes more challenging when the bluff bodies are placed near a free surface, which is very common in ocean engineering. Flow past a single circular cylinder near a free surface has been systematically investigated (Sheridan et al. Reference Sheridan, Lin and Rockwell1997; Reichl, Hourigan & Thompson Reference Reichl, Hourigan and Thompson2005; Zhao et al. Reference Zhao, Wang, Zhu, Ping, Bao, Zhou, Cao and Cui2021, Reference Zhao, Wang, Zhu, Cao, Bao, Zhou and Han2022), while the flow around two circular cylinders in tandem near a free surface is poorly understood. Tuck & Scullen (Reference Tuck and Scullen1998) suggested that there were special depths of submergence such that each cylinder was separately free of horizontal force, and the parameter range for this phenomenon was explored both by linear theory and nonlinear computations. Ong et al. (Reference Ong, Kamath, Bihs and Afzal2017) performed two-dimensional numerical simulations to investigate the effect of the space ratio on the vertical hydrodynamic forces and the free-surface distortions for free-surface waves past two semi-submerged horizontal circular cylinders in tandem. They concluded that the two-dimensional numerical model is suitable for predicting the hydrodynamic quantities and the corresponding free-surface elevations. Subburaj & Vengadesan (Reference Subburaj and Vengadesan2019) examined the flow characteristics and mean forces with the variation of the Froude number, the spacing ratio and the submergence depth for the flow past two tandem circular cylinders near a free surface at a Reynolds number of  $180$ using two-dimensional numerical simulations. Their findings revealed that cylinder-to-cylinder proximity along with an increased Froude number suppresses the instabilities in the flow. However, the limited parameter space prevents them from drawing generalized conclusions about the flow behaviour influenced by the free surface. Yetik & Mahir (Reference Yetik and Mahir2020) found that variations in Reynolds number significantly impact the hydrodynamic coefficients of two square cylinders in tandem near the free surface. This finding underscores the importance of the Reynolds number as a critical parameter in the flow dynamics of two circular cylinders in tandem near the free surface.
In the case of the flow around two cylinders in tandem near a free surface, the mechanisms of the interference between the hydrodynamic forces, the flow structures and the free-surface distortions are particularly challenging. In light of the earlier works, this study systematically investigates the free-surface effect on the wake dynamics and hydrodynamics for the flow past two circular cylinders in a tandem arrangement beneath a free surface. The characteristics of the free-surface distortions and their correlation with vortex shedding have been fully explored for the first time. At a Reynolds number of 180, simulations are performed for Froude numbers of 0.20, 0.40, 0.60 and 0.80. The gap ratios of  $h/D = 0.20$, 0.40, 0.60, 0.80, 1.00, 1.20, 1.40, 1.60, 1.80 and
 $2.00$ are examined, where
 $h$ is the distance between the top of the cylinder and the position of the undisturbed free surface and
 $D$ is the diameter of the cylinder. The spacing ratio
 $L/D$, with
 $L$ the centre-to-centre distance between the two tandem cylinders, varies from
 $1.50$ to
 $4.00$ with an interval of
 $0.50$.
The layout of this paper is organized as follows. Section 2 presents a brief description of the governing equations, numerical method and numerical set-up. The free-surface effects on the instantaneous and mean flow fields are discussed in §§ 3.1 and 3.2, respectively. In § 3.3, the influence of the free surface on the pressure distributions and the hydrodynamic forces on the cylinders is presented. The free-surface deformations are discussed in § 3.4. Finally, the main finding are summarized in § 4.
2. Numerical method and validation
2.1. Governing equations
The flow considered consists of two incompressible, isothermal immiscible Newtonian fluids with constant densities and dynamic viscosities, with the gas phase located at the top of the fluid phase. Both phases are governed by the continuity and incompressible Navier–Stokes equations
 $$\begin{gather} \boldsymbol{\nabla} \boldsymbol{\cdot} \boldsymbol{U} = 0, \end{gather}$$
 $$\begin{gather}\frac{\partial (\rho \boldsymbol{U})}{\partial t} + \boldsymbol{\nabla} \boldsymbol{\cdot} (\rho \boldsymbol{U} \boldsymbol{U}) ={-} \boldsymbol{\nabla} {p}_{rgh} + \mu \nabla^2 \boldsymbol{U} + \rho \boldsymbol{g}, \end{gather}$$
where  $\boldsymbol {U}$ is the velocity vector,
 $U_\infty$ is the free-stream velocity,
 $t$ is the time,
 $p_{rgh}$ is the pressure minus the hydrostatic contribution,
 $\rho$ is the density of the fluid,
 $\mu$ is the dynamic viscosity of the fluid and
 $\boldsymbol {g}$ is the gravitational acceleration (
 $-9.81$ in the
 $y$ direction). The surface tension force is not included in the equations, since the surface tension is negligible for the flow conditions under investigation (Li et al. Reference Li, Liu, Wan and Hu2021; Chen, Zhao & Wan Reference Chen, Zhao and Wan2022). Note that the Reynolds number (
 $Re =\rho D U_\infty / \mu$) and the Froude number (
 $Fr =U_\infty / \sqrt {gD}$) are defined with the fluid properties of the liquid phase.
In the present study,  $U_\infty$ varies based on the specific value of the Froude number, while
 $\mu$ is adjusted accordingly to maintain a constant Reynolds number. The relative properties of the water and air phases in reality are reproduced in the present study, where the density ratio between the liquid and gas is
 $830$, and the dynamic viscosity ratio is
 $55$.
The two-phase flow problem is tackled by the volume-of-fluid (VOF) method proposed by Hirt & Nichols (Reference Hirt and Nichols1981). The volume fraction function,  $\alpha$, within a computational cell is introduced to quantify the free-surface motion on a fixed grid system. The volume fraction function defines the fraction of the volume occupied by the gas phase (
 $\alpha =0$) and the fluid phase (
 $\alpha =1$), and an
 $\alpha$ value of
 $0.5$ corresponds to the interface between the two phases. The fluid density and dynamic viscosity in cells of the interface are defined as a weighted average between two phases
 $$\begin{gather} \rho=\alpha \rho_w+(1-\alpha)\rho_a, \end{gather}$$
 $$\begin{gather}\mu=\alpha \mu_w+(1-\alpha)\mu_a, \end{gather}$$
where subscripts  $w$ and
 $a$ denote water and air, respectively. The field of
 $\alpha$ is determined by solving a conservative advection equation
 \begin{equation} \frac{\partial \alpha}{\partial t} + \boldsymbol{\nabla} \boldsymbol{\cdot} ( \boldsymbol{U} \alpha ) + \boldsymbol{\nabla} \boldsymbol{\cdot} [ \boldsymbol{U}_c \alpha(1-\alpha) ]=0, \end{equation}
where  $\boldsymbol {U}_c$ is an artificial interface-compression velocity in the normal direction of the interface (Weller Reference Weller2008; Higuera et al. Reference Higuera, Liu, Lin, Wong and Kao2018). A non-uniform density approach proposed by Fan & Anglart (Reference Fan and Anglart2020) is adopted to mitigate the effect of the spurious velocities and over-production of turbulent viscosity at the interface arising from the large density gradient between the phases.
2.2. Numerical method
The solver interFoam implemented in the open-source software OpenFOAM-v2206 (www.openfoam.com) was used to carry out the three-dimensional (3-D) simulations. Specifically, the finite volume method (FVM) and the PISO (pressure implicit with splitting of operators) algorithm (Issa Reference Issa1986) are employed to solve the equations. The VOF method is used to capture the gas–fluid interface. The convection term and the diffusion term are discretized using central differencing of second-order accuracy. The vanLeer interpolation scheme is used for the volume fraction function. The time derivative term is discretized using the second-order backward scheme while a 50 % to 50 % blended scheme consisting of the second-order Crank–Nicolson scheme and a first-order Euler implicit scheme is employed for the temporal term of the volume fraction function.
2.3. Boundary conditions
The hexahedral computational domain shown in figure 1(a) is adopted for the present FVM simulations. The inlet boundary is located at  $25D$ in front of the upstream cylinder and the outlet boundary is
 $40D$ away from the downstream cylinder. The bottom boundary is positioned
 $20D$ below the centreline of the cylinders and the top boundary is set at
 $15D$ above the initial free surface. The spanwise length of the domain is
 $8D$. The non-dimensional gap ratio (
 $G$) and spacing ratio (
 $S$) are defined as
 $$\begin{gather} G = \frac{h}{D}, \end{gather}$$
 $$\begin{gather}S = \frac{L}{D}, \end{gather}$$
where  $h$ is the distance from the free surface to the upper edge of the circular cylinder,
 $L$ is the separation distance between the centres of the two cylinders and
 $D$ is the cylinder diameter (for tandem cylinders of equal diameter).
(a) Schematic model of computational domain. (b) The zoomed in grid around the cylinders at  $G=0.60$ and
 $S=2.00$. The red line indicates the position of the initial free surface.

A uniform velocity  $U_\infty$ is specified at the inlet boundary of the liquid phase. The boundary condition for the outlet provides a phase fraction condition based on the local flow conditions by adjusting the velocity of the given phase to balance the mass flow rate. A fixed total pressure condition is specified at the top boundary. The bottom boundary is treated as a free-slip wall to simulate deep water conditions. No-slip boundary conditions are imposed on the surfaces of both the upstream and downstream cylinders. The periodicity of the flow in the spanwise direction of the cylinder is presumed.
2.4. Mesh and time step dependence study
The dependences of the numerical results on the computational mesh and the time step are investigated for the case at  $(Re, Fr, S, G)=(180, 0.60, 2.00, 0.60)$. In this particular scenario, the cylinders are positioned close to the free surface, making the mesh resolution in the vicinity of the gas–fluid interface a critical factor that may affect the results. A zoomed in view of the reference mesh near the cylinders is presented in figure 1(b). The sizes of the cells in the
 $x$- and
 $y$-directions near the cylinders and in the near wake region (
 $5D$ behind the downstream cylinder) are kept as consistent as possible to maintain high mesh orthogonality. The grid near the free surface (
 $0.3D$ above and below the still water level) remains uniform in the
 $y$-direction to enhance the accuracy of wave capture. The mesh topology is exactly the same across all cases. The mesh in the
 $x$–
 $y$ plane is then extruded uniformly along the spanwise direction to create a 3-D mesh. For the reference mesh, the cell size in the spanwise direction (
 $\Delta z$) is
 $0.1D$, with a spanwise domain length of
 $8D$. In comparison, the mesh refined in the
 $z$-direction has a spanwise cell size of
 $0.05D$, while the extended mesh features a spanwise domain length of
 $12D$. The spanwise domain length is specified to be an integer multiple of
 $4D$, which closely approximates the most unstable spanwise wavelength for a mode A structure (Barkley & Henderson Reference Barkley and Henderson1996; Williamson Reference Williamson1996; Carmo et al. Reference Carmo, Meneghini and Sherwin2010b). Furthermore, 3-D simulations were performed using a mesh refined in the
 $x$–
 $y$ plane, where the number of cells in both directions was doubled compared with the reference 3-D mesh. Additionally, the time step is adjustable during runtime based on the criterion of keeping the Courant–Friedrichs–Lewy (CFL) number below the maximum allowable threshold. For the reference case, the CFL number is set to 0.4, but it is reduced to 0.2 to assess time step convergence.
Simulations of six variations to the reference case (case 1) have been conducted to evaluate the influence of mesh resolution and time step on hydrodynamic force coefficients. The drag coefficient ( $C_{D}$) and lift coefficient (
 $C_{L}$) are defined by
 $$\begin{gather} C_{D}=\frac{F_{D}}{0.5\rho U_{\infty}^{2}DL_z}, \end{gather}$$
 $$\begin{gather}C_{L}=\frac{F_{L}}{0.5\rho U_{\infty}^{2}DL_z}, \end{gather}$$
where  $F_{D}$ is the total drag force acting on the cylinder, and
 $F_{L}$ is the lift force that has excluded the hydrostatic force. The r.m.s. drag and lift coefficients are defined as
 $$\begin{gather} C_{D}^{\prime}=\sqrt{\frac{1}{N}\sum_{i=1}^{N}(C_{D,i}-\bar{C}_{D})^{2}}, \end{gather}$$
 $$\begin{gather}C_{L}^{\prime}=\sqrt{\frac{1}{N}\sum_{i=1}^{N}(C_{L,i}-\bar{C}_{L})^{2}}, \end{gather}$$
where  $N$ represents the length of the time samples for
 $C_{D}$ and
 $C_{L}$, while
 $\bar {C}_{D}$ and
 $\bar {C}_{L}$ denote the time-averaged drag and lift force coefficients, respectively. In most of the simulations of this study, an initial run of
 $200D/U_\infty$ is performed to eliminate the effects of initial transients. Afterward, flow statistics are collected over an additional
 $200$ flow-over times past the cylinder.
The simulation results are listed in table 1. The relative errors enclosed in the brackets are determined with reference to the results from case 1. The value of  $C_{L}^{\prime }$ on the upstream cylinder in case 2 shows the largest discrepancy, at
 $1.56\,\%$. Apart from this, the relative errors for the four quantities across all cases remain well within
 $1.5\,\%$, indicating that further refinement of the mesh resolution and time step from the reference case has a negligible effect on the results. Based on these observations, the mesh sizes and time step settings in the reference case (case 1) are considered to be adequate for the purpose of this study.
Summary of the mesh and time step dependence test.

2.5. Model validation
To the best of the authors’ knowledge, no data have been reported for two tandem cylinders beneath a free surface at a similar Reynolds number. The numerical model is validated by comparing the present results with the published data (Papaioannou et al. Reference Papaioannou, Yue, Triantafyllou and Karniadakis2006) for flow around two tandem cylinders without the free surface at two Reynolds numbers of  $Re=160$ and
 $Re=200$. In this validation study, the tandem cylinders are placed
 $5D$ beneath the free surface to minimize the free-surface effects.
A comparison of results at  $Re=160$, shown in figure 2, demonstrates that the variations in drag coefficients at different spacing ratios are in good agreement with corresponding results reported in the literature. Notably, the ‘drag inversion’ phenomenon (Carmo et al. Reference Carmo, Meneghini and Sherwin2010b), characterized by an abrupt change in mean drag coefficients, is accurately reproduced. In addition, figure 3 shows the 3-D flow structures of the two tandem cylinders at
 $(Fr, G, L)=(0.2, 5.0, 4.0)$, represented by isosurfaces of
 $QD^2/U_{\infty }^2=1$ coloured by normalized streamwise vorticity
 $\omega _{x}D/U_{\infty }$. The blue transparent surface in the figure represents the instantaneous free surface. The 3-D wake pattern is characterized by a pure mode A structure with spanwise-periodic wavy deformation. Two deformation cycles can be identified in the spanwise direction, resulting in a spanwise wavelength of approximately
 $4D$, which is close to the observation of Carmo et al. (Reference Carmo, Meneghini and Sherwin2010b).
Comparison of the mean drag coefficients on the upstream cylinder (a) and downstream cylinder (b).

Instantaneous flow structures at  $(Fr, G, L)=(0.2, 5.0, 4.0)$, represented by isosurfaces of
 $QD^2/U_{\infty }^2=1$ coloured by normalized streamwise vorticity
 $\omega _{x}D/U_{\infty }$.

Table 2 provides a quantitative comparison of the mean drag coefficient and vortex shedding frequency at  $Re=200$, showing a close match between our results and those from Papaioannou et al. (Reference Papaioannou, Yue, Triantafyllou and Karniadakis2006).
Comparison of  $\bar {C}_{D}$ and
 $St$ with data of Papaioannou et al. (Reference Papaioannou, Yue, Triantafyllou and Karniadakis2006) at
 $Re=200$.

In both cases, the present results show excellent agreement with the published data, which provides confidence in the ability of the present numerical model to accurately capture the dynamics of flow past two circular cylinders in tandem near a free surface.
3. Results and discussion
3.1. Free-surface effects on the instantaneous wake flow regime
3.1.1. Classification of the flow fields
First, the effect of the free surface on the wake flow regime is investigated. Various types of wake interference for two tandem circular cylinders in steady flow have been identified by analysing the overshooting, reattachment and rolling-up behaviours of the shear layers separating from the upstream cylinder (Igarashi Reference Igarashi1981; Zdravkovich Reference Zdravkovich1987; Zhou & Yiu Reference Zhou and Yiu2006). However, with the presence of gravity and a deformable free surface, the wake dynamics can be more intricate (González-Gutierrez, Gimenez & Ferrer Reference González-Gutierrez, Gimenez and Ferrer2019), and is sensitive to both the geometric configuration and the Froude number. Furthermore, the present study is aimed to reveal the underlying physics responsible for the flow influenced by free-surface effects. Therefore, a supplementary classification approach, based on the behaviours of the shear layer originating from the free surface, is employed. The contours of normalized vorticity  $\omega _{z}D/U_{\infty }$ in the mid-section of the cylinders are shown in figure 4 at
 $Fr=0.2$ and figure 5 at
 $Fr=0.8$, representing low and high Froude numbers, respectively. These cases are selected to illustrate the free-surface effects on the instantaneous flow fields especially at small gap ratios. Through careful observation and classification of the wake flow fields of all cases in the parameter space, eight distinct wake patterns have been identified, as sketched in figure 6, which can be categorized into two basic types: those characterized by the presence of the free-surface shear layer and those without it. The former type is denoted by a prefix ‘F’ to emphasize this distinction. The characteristics of those flow patterns are summarized as follows.
Instantaneous normalized vorticity  $(\omega _{z}D/U_{\infty })$ contours in the mid-section of the cylinders, illustrating the different flow regimes observed in the flow around two circular cylinders in tandem near a free surface at
 $Fr=0.2$. The green lines indicate the gas–fluid interfaces.

Instantaneous normalized vorticity  $(\omega _{z}D/U_{\infty })$ contours in the mid-section of the cylinders, illustrating the different flow regimes observed in the flow around two circular cylinders in tandem near a free surface at
 $Fr=0.8$.

Flow patterns identified in this study for two tandem circular cylinders near a free surface: (a) TW-O; (b) SW-SR; (c) SW-AR; (d) CW-S; (e) F-TW-O; ( f) F-SW-SR; (g) F-SW-AR; (h) F-CW-S. The blue arrows indicate the jet-like flow.

Pattern TW-O: trailing wake with the shear layer overshooting the downstream cylinder, as sketched in figure 6(a). At extremely small gap ratios ( $G=0.2$) and low Froude numbers (
 $Fr \leqslant 0.4$), the lower shear layer separating from the upstream cylinder overshoots the downstream cylinder, while the upper shear layer reattaches onto the downstream cylinder due to the confinement imposed by the presence of the free surface, as shown in figure 4(a,d,g). The stretched lower shear layer resembles a long tail trailing behind the upstream cylinder, hence the name ‘trailing wake’. The primary instabilities of the two shear layers separating from the upstream cylinder are inhibited, possibly due to their significant distance in the cross-flow direction. The presence of the downstream cylinder interrupts the communication between the upper and lower shear layers, effectively stabilizing the wake of the upstream cylinder. Zhao et al. (Reference Zhao, Wang, Zhu, Cao, Bao, Zhou and Han2022) made similar observations in the flow around a single circular cylinder near a free surface at small gap ratios.
Pattern SW-SR: single vortex shedding wake behind the downstream cylinder with steady reattachment of shear layers in the gap region, as sketched in figure 6(b). As the submergence depth increases, the free-surface confinement effect on the upper shear layers weakens. This allows for the vortex shedding to gradually resume, and a single Kármán vortex street can be observed in the wake of the downstream cylinder. The pattern SW-SR actually corresponds to the ‘extended-body’ regime in the classification by Zdravkovich (Reference Zdravkovich1987) and Sumner (Reference Sumner2010). The shear layers separating from the upstream cylinder may continuously reattach onto the downstream cylinder and quasi-stationary vortices are formed in the gap between the cylinders, as shown in figure 4(c).
Pattern SW-AR: single vortex shedding wake behind the downstream cylinder with alternating reattachment of shear layers in the gap region, as sketched in figure 6(c). As the separation distance between the cylinders increases, the shear layers separating from the upstream cylinder may flap up and down, alternately reattaching onto the downstream cylinder, corresponding to the Zdravkovich (Reference Zdravkovich1987) ‘alternate reattachment’ regime. This flow pattern principally involves the reattachment of the shear layers from the upstream cylinder, along with the formation and shedding of eddies in the gap region between the two cylinders, as exemplified in figure 4(b,e,f).
Pattern CW-S: co-shedding wake with vortex shedding in the gap region, as sketched in figure 6(d). At large gap ratios and spacing ratios, a distinct vortex street forms behind each of the two cylinders in this ‘co-shedding’ flow regime (Zhou & Yiu Reference Zhou and Yiu2006). The downstream cylinder is now located outside the vortex formation region of the upstream cylinder and is subjected to the periodic impingement of shed vortices from the upstream cylinder, as illustrated in figure 4(h,i).
Pattern F-TW-O: similar to pattern TW-O, but with a jet-like flow forming in the gap between the tandem cylinders, as sketched in figure 6(e). In this flow pattern, a distinct shear layer separating from the free surface and two shear layers separating from the upstream cylinder can be identified, as shown in figure 5(a,f,k,l). At small gap ratios, the presence of the free-surface shear layer is attributed to the formation of a jet-like flow penetrating through the gap between the cylinders. The occurrence of the jet-like flow has also been observed in the flow around a single circular cylinder near a free surface both in experimental and numerical studies (Sheridan et al. Reference Sheridan, Lin and Rockwell1997; Reichl et al. Reference Reichl, Hourigan and Thompson2005; Zhao et al. Reference Zhao, Wang, Zhu, Ping, Bao, Zhou, Cao and Cui2021).
Pattern F-SW-SR: similar to pattern SW-SR, but with the addition of a free-surface shear layer, as sketched in figure 6( f). In this flow pattern, the reattached shear layer in the gap deflects downward slightly due to the push of the accelerating flow between the free surface and the upstream cylinder, as shown in figure 5(b–d,g–i). The reattachment of the upper shear layer onto the front surface of the downstream cylinder has also been observed by Sumner et al. (Reference Sumner, Price and Paidoussis2000) in the flow around two staggered circular cylinders at very small pitch ratios and small angles of incidence (the shear layer reattachment flow pattern denoted therein as ‘SLR’). The deviation angles of the stagnation point of the upstream cylinder of pattern F-SW-SR exactly fall within the incidence angle range for the flow pattern ‘SLR’ as it turns out in the pressure measurement (see figure 17 in § 3.3.1). The lower shear layer is significantly stretched, deflecting downward and overshooting the downstream cylinder without reattaching to its surface. Large-scale quasi-stationary vortices (Igarashi Reference Igarashi1981), enclosed by the reattached shear layer on the upper side and the free shear layer on the lower side, occupy the gap between the cylinders, effectively blocking the flow through the gap. Under the right conditions, the oblique jet-like flow impinges onto downstream cylinder, as depicted in figure 5(g). After the impingement, the jet-like flow splits into two curved wall jets along the convex surface of the downstream cylinder in both clockwise and anticlockwise directions. The split wall jets are attached to the cylinder wall due to the Coand $\check{\rm a}$ effect (Wille & Fernholz Reference Wille and Fernholz1965). The shear layer separating from the upper surface of the upstream cylinder is compressed by the jet-like flow and captured in the gap between the cylinders. On the other hand, the shear layer separating from the lower side of the upstream cylinder is pushed away without any reattachment to the downstream cylinder. The conclusion regarding the impingement of the jet-like flow is further supported by the visualization of the mean streamlines in figure 13 (see § 3.2.1).
Pattern F-SW-AR: similar to pattern SW-AR, but with the addition of a shear layer separating from the free surface, as sketched in figure 6(g). Examples of flow visualizations for this flow pattern are shown in figure 5(e,j).
Pattern F-CW-S: similar to pattern CW-R, but with the addition of free-surface shear layers, as sketched in figure 6(h). At relatively large gap ratios, the free-surface shear layer may not significantly alter the wake, as shown in figure 5(o). However, at relatively small gap ratios, the near wake of the upstream cylinder deflects downward due to the push of a jet-like flow, allowing the spatial development of shear layers to be no longer constrained by the downstream cylinder. The resulted co-shedding from the two tandem cylinders is similar to that observed in the flow around two staggered cylinders. Examples of this flow pattern are shown in figure 5(m,n). This unique flow pattern will be discussed in detail in the next section. As the gap ratio further increases, the wake transitions from staggered to parallel co-shedding, as shown in figure 5(o).
It should be noted that the absence of the free-surface shear layer in a flow pattern does not imply that the flow is unaffected by the presence of the free surface. Even in the absence of the free-surface shear layer, the flow patterns can still exhibit differences compared with those in a single-phase flow unless the cylinders are sufficiently submerged, as shown in figure 4. In the flow past an isolated cylinder near a free surface, more types of flow patterns have been identified at higher Froude numbers by Bouscasse et al. (Reference Bouscasse, Colagrossi, Marrone and Souto-Iglesias2017) due to violent free-surface distortions.
3.1.2. Staggered flow pattern in two tandem cylinders
With the presence of the free surface, the flow passage above the cylinders is restricted and the oncoming flow is prone to slightly deflect to the bottom side of the upstream cylinder where there is no restriction. Due to the deflection of the oncoming flow, the two tandem cylinders are equivalently exposed to the free stream at small angles of incidence. Therefore, the flow around two tandem circular cylinders of equal diameter may exhibit flow patterns similar to the flow around two staggered circular cylinders due to the effects of the free surface. At small gap ratios, as shown in figure 5(b), the flow fields may show some similarity to the ‘SLR’ flow pattern at very small pitch ratios (Sumner et al. Reference Sumner, Price and Paidoussis2000). At intermediate gap ratios, as shown in figure 5(m,n), the flow field resembles the vortex pairing and enveloping (‘VPE’) flow pattern (Sumner et al. Reference Sumner, Price and Paidoussis2000) and ‘mode S-II’ (Hu & Zhou Reference Hu and Zhou2008; Tong et al. Reference Tong, Cheng and Zhao2015) for two staggered circular cylinders at intermediate incidence angle. To highlight this finding, we present instantaneous flow fields of the case at  $(Fr, G, S)=(0.6, 0.6, 3.0)$ at six time instants during a vortex shedding period in figure 7. The specific time instants are labelled with letters (a–f) and marked with red points on the lift force coefficient curve of the upstream cylinder in the bottom inset of figure 7. A movie showing the temporal development of the wake is available as supplementary movie 1 at https://doi.org/10.1017/jfm.2024.1066. The fluid dynamics and key physics of the flow around the two cylinders can be summarized as follows.
Vorticity contours with streamlines in the mid-section of the cylinders at  $(Fr, G, S)=(0.6, 0.6, 3.0)$. The time instants (a–f) are indicated by the red points in the inset of the time history of the lift force coefficient (
 $C_L$) of the upstream cylinder at the bottom of the figure. The internal captions identify the major vorticity behaviours discussed in the text. Contours vary from blue to red in the range
 $-3 \leqslant \omega _{z}D/U_{\infty } \leqslant 3$. The dashed lines represent negative vorticity. The green lines indicate the gas–fluid interfaces.

In (a) a hydraulic jump can be observed in the overtopping region of the upstream cylinder. The flow in this region is accelerated as the flow passage narrows due to the presence of the free surface. The accelerated flow forms a jet-like flow, penetrating into the gap region between the cylinders. As will be demonstrated subsequently, the formation of the jet-like flow triggers a sequence of intricate vortex interactions that dominate the wake evolution. The jet-like flow obliquely dives into the gap region along the curved free surface. The deflection of the jet-like flow leaves a slow recirculating region between the jet and the free surface, which leads to the onset of a shear layer of positive vorticity from the free surface. The shear layers separating from the upstream cylinder are pushed away from the free surface and deflect downward by an angle of more than  $20$ degrees. The deflected shear layers, previously constrained by the blockage of the downstream cylinder, now have sufficient space to roll up and shed vortices. Meanwhile, an incipient negative vortex begins to develop in the shear layer separating from the upper side of the downstream cylinder.
In (b), with the rolling up process of the shear layer separating from the top side of the upstream cylinder, the jet-like flow approaches closer to the downstream cylinder. As a result, the slow recirculating zone between the jet and the free surface becomes larger, facilitating the continuous development of the positive shear layer from the free surface. The shed vortex with positive vorticity from the bottom side of the upstream cylinder now impinges onto and sweeps over the downstream cylinder. Obviously, the upstream cylinder undergoes an inclined vortex shedding process in the gap between the cylinders. Meanwhile, an incipient negative vortex has formed in the shear layer on the top side of the downstream cylinder. On the other hand, the bottom side of the downstream cylinder lies in the path of the vortex street generated by the upstream cylinder and the shear layer separating from that side is weak.
In (c), as the vortex with negative vorticity is shed from the upper side of the upstream cylinder, the jet-like flow progressively impinges onto the downstream cylinder. The vorticity fed to the positive shear layer separating from the free surface is cut off and that provokes the shedding of a vortex in front of the downstream cylinder.
In (d), the vortex with negative vorticity in the gap between the cylinders catches up the positive vortex below the downstream cylinder after impingement. A relatively small vortex shed from the lower side of the downstream cylinder is trapped between the shed vortices from the upstream cylinder, progressively merging with the large-scale positive vortex. The vortex shedding from the free-surface shear layer is pushed by the jet-like flow and is entrained, passing through the gap between the downstream cylinder and the free surface.
In (e), below the downstream cylinder, the merged positive vortex now pairs with the negative one, translating further downstream along with the free stream. The free-surface vortex decays rapidly when interacting with the shear layer from the upper side of the downstream cylinder. The vorticity of the shear layer separating from the upper side of the downstream cylinder grows stronger as the oncoming flow passage opens again.
In ( f), the image at this instant is essentially similar to figure 7(a), corresponding to the start of the next cycle of wake evolution depicted in figure 7.
It is clear from the cycle of the wake evolution in figure 7 that three vortex shedding processes are present in this flow pattern. The upstream cylinder generates an angled vortex sheet, sweeping over the lower side of the downstream cylinder. This vortex shedding process is highly regular and easily distinguishable in the wake, with alternative vortex shedding from the top and bottom sides of the upstream cylinder. In term of the downstream cylinder, the shear layer separating from the top side experiences a relatively regular roll-up and shedding procedure, while the vortex shedding from the bottom side is rather weak and highly dependent on the local flow, as it lies in the path of the vortex street generated by the upstream cylinder. The presence of the upstream vortex street can disrupt the shedding process and result in a less organized pattern of vortex shedding from the bottom side of the downstream cylinder. Furthermore, the third vortex shedding process is associated with the shear layer separating from the free surface. The free-surface distortion and wave breaking can introduce a substantial quantity of positive vorticity to the vicinity of the free surface. The formation of the jet-like flow above the upstream cylinder facilitates the entry of this surface vorticity into the bulk flow. The dynamic motion of the jet-like flow allows the surface vorticity to be entrained and transported into the gap between the downstream cylinder and the free surface, leading to the shedding process of the shear layer separating from the free surface. In addition, it is the formation of the jet-like flow that alters the incidence angle of the oncoming flow, leading to staggered flow patterns for two tandem cylinders.
3.1.3. Three-dimensional wake
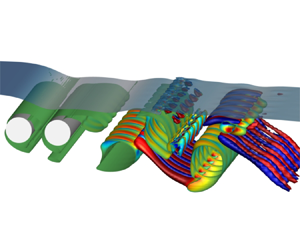
The 3-D wake structures of the cylinders under the free-surface effects are further investigated by showing the isosurfaces of the  $Q$-criterion, which represents the second invariant of the velocity gradient tensor. Figure 8 shows the isosurfaces of
 $QD^2/U_{\infty }^2=0.1$ under the influence of spacing distance between the two tandem cylinders at
 $(Fr, G)=(0.8, 0.6)$. The blue transparent surface in the figure represents the instantaneous free surface. The 3-D wake pattern at
 $S=1.5$ is characterized by a pure mode B structure with
 $6$ streamwise vortex pairs (figure 8a), resulting in a spanwise wavelength of approximately
 $1.3D$, which is slightly larger than the typical mode B wavelength (around
 $1D$) for a single circular cylinder (Barkley & Henderson Reference Barkley and Henderson1996; Williamson Reference Williamson1996). According to Williamson (Reference Williamson1996) and Barkley & Henderson (Reference Barkley and Henderson1996), the Reynolds-number range for the transition to mode B instability in a single circular cylinder is
 $230$ to
 $260$, which is significantly higher than
 $Re=180$ in the present study. The early onset of mode B instability may be attributed to the fact that the flow pattern falls within the ‘extended-body’ regime (F-SW-SR pattern in the present study), where the extended characteristic scale of the structure effectively raises the Reynolds number beyond
 $180$. An arrangement of vortex structures with the same periodicity is also observed in the free-surface shear layer. As seen in figure 8(b–e), when
 $S>1.5$, the spanwise vorticity in the wake is dominated by the primary vortices with spanwise-periodic deformation at various wavelengths. These 3-D flow structures strongly resemble mode A for a single circular cylinder, although the spanwise wavelengths can be different from the typical value of
 $4D$ obtained from linear stability analysis by Barkley & Henderson (Reference Barkley and Henderson1996). For example, the spanwise wavelength is approximately
 $4D$ at
 $S=2.0$ and
 $2.5$,
 $1.6D$ at
 $S=3.0$ and
 $2.7D$ at
 $S=3.5$. In addition, the spanwise periodicity is less regular, which may be attributed to the influence of the free surface.
Instantaneous flow structures of the tandem cylinders at different spacing ratios with  $(Fr, G)=(0.8, 0.6)$, represented by isosurfaces of
 $QD^2/U_{\infty }^2=0.1$ coloured by normalized streamwise vorticity
 $\omega _{x}D/U_{\infty }$. Panels show (a)
 $S=1.5$; (b)
 $S=2.0$; (c)
 $S=2.5$; (d)
 $S=3.0$; (e)
 $S=3.5$.

Figure 9 shows the isosurfaces of  $QD^2/U_{\infty }^2=0.1$ under the influence of submergence depths at
 $(Fr, L)=(0.8, 4.0)$. At shallow submergence depths, a jet-like flow forms in the gap region between the two cylinders, with the shear layer separating from the free surface dominating the wake, as shown in figure 9(a,b). Hairpin vortex structures are formed in the free-surface shear layer, characterized by an array of large-scale streamwise vortices. Similar hairpin vortex structures, although on a smaller scale, are also identified at much higher Reynolds numbers (see Appendix A). As shown in figure 9(c,d), at intermediate submergence depths, large-scale spanwise vortex structures shedding from the free-surface shear layer can be observed. These free-surface vortices subsequently break down into streamwise structures in the overtopping region of the downstream cylinder. The primary vortex cores exhibit wavy deformation with spanwise wavelengths similar to those of the free-surface vortex structures. When deeply submerged, the wavy deformation of the primary vortex cores disappears, and the flow becomes two-dimensional, as shown in figure 9(e,f).
Instantaneous flow structures of the tandem cylinders at different gap ratios with  $(Fr, S)=(0.8, 4.0)$, represented by isosurfaces of
 $QD^2/U_{\infty }^2=0.1$ coloured by
 $\omega _{x}D/U_{\infty }$. Panels show (a)
 $G=0.2$; (b)
 $G=0.4$; (c)
 $G=0.6$; (d)
 $G=0.8$; (e)
 $G=1.2$; ( f)
 $G=2.0$.

Figure 10 shows the isosurfaces of  $QD^2/U_{\infty }^2=0.1$ under the influence of different Froude numbers at
 $(G, L)=(0.6, 4.0)$. The 3-D wake patterns at
 $Fr=0.2$ and
 $0.4$ are mode A with spanwise wavelengths of approximately
 $4D$, as shown in figure 10(a,b). However, as the Froude number increases to
 $0.6$ and
 $0.8$, a large quantity of irregular vortex structures appear near the free surface, leading to more pronounced spanwise inhomogeneities in the wake of the cylinders. This indicates that the three-dimensionality of the flow around two tandem cylinders near a free surface becomes more pronounced with increasing Froude number.
Instantaneous flow structures of the tandem cylinders at different Froude numbers with  $(G, S)=(0.6, 4.0)$, represented by isosurfaces of
 $QD^2/U_{\infty }^2=0.1$ coloured by
 $\omega _{x}D/U_{\infty }$. Panels show (a)
 $Fr=0.2$; (b)
 $Fr=0.4$; (c)
 $Fr=0.6$; (d)
 $Fr=0.8$.

3.1.4. Summarized dependence of flow patterns on  $G$ and $S$


The dependence of flow patterns on spacing ratio and gap ratio is summarized in figure 11. This map may contribute to the prediction of the flow structure in the wake of two tandem circular cylinders near a free surface. At different Froude numbers, the distribution of wake patterns varies on the  $G$–
 $S$ plane, as shown by the lines in figure 12.
Dependence of flow patterns on  $G$ and
 $S$ in the wake of two tandem circular cylinders. To differentiate the flow patterns, the following symbols have been used:
 $\star$, TW-O;
 $\diamond$, SW-SR;
 $\circ$, SW-AR;
 $\triangle$, CW-S;
 $\triangledown$, F-TW-O;
 $\triangleleft$, F-SW-SR;
 $\square$, F-SW-AR;
 $\triangleright$, F-CW-S. Four flow patterns at the four Froude numbers are plotted at each coordinate grid point, with the light green symbol representing
 $Fr=0.2$, the light red symbol representing
 $Fr=0.4$, the black symbol representing
 $Fr=0.6$ and the light blue symbol representing
 $Fr=0.8$. Boundaries between various flow behaviours at
 $Fr=0.6$ are superimposed for reference. The internal captions of different colours correspond to the boundaries of the same colour.

Variation of the flow pattern distribution as a function of the Froude number on the  $G$–
 $S$ plane. (a) The influence of the free-surface shear layer, the dashed lines indicate the upper limit where the free-surface shear layer is present in the wake, the dash-dotted lines of the same colour denote the region where a jet-like flow forms. (b) Boundaries of the reattachment regime and the co-shedding regime.

On the one hand, as shown in figure 12(a), the horizontal borders indicate the varying degrees of influence of the free surface on the wake flow patterns, with a predominant dependence on the  $y$-direction variable
 $G$. As discussed previously, a shear layer separating from the free surface is introduced into the wake due to the distortion of the free surface and the blocking effect of the cylinders at small and intermediate gap ratios. It is clear that higher Froude numbers can extend the effect of the free surface to deeper submergence depths, as indicated by the dashed lines in figure 12(a). At the minimum Froude number (
 $Fr=0.2$) considered in this study, no free-surface shear layer forms. However, the free-surface shear layer occurs at
 $G \leqslant 0.8$ at
 $Fr=0.4$, extending significantly to
 $G \leqslant 1.6$ at
 $Fr=0.8$. It can be seen that it is easier for the free-surface shear layer to form large spacing ratios. In particular, the free-surface shear layer occurs only when
 $S \geqslant 3.00$ at
 $Fr=0.4$, as depicted by the region enclosed by the red dashed lines figure 12(a). The strength and the dynamic behaviours of the free-surface shear layer play a decisive role in the flow state in the gap between the two tandem cylinders. As can be observed in figure 5, the formation of the jet-like flow in the gap between the cylinder is consistently accompanied by a strong free-surface shear layer. The jet-like flow typically forms at high Froude numbers (
 $Fr \geqslant 0.6$), with higher
 $Fr$ corresponding to a higher upper limit of
 $G$, as indicated by the dash-dotted lines denoting the ‘jet-like flow’ border in figure 12(a). The jet-like flow exhibits two forms: one penetrates the gap region between the two cylinders, and the other impinges on the downstream cylinder, as indicated by the blue arrows in figures 6(e) and 6( f), respectively. Regarding the penetrating jet-like flow, the roll-up of the shear layers separating from the upstream cylinder is often interrupted, resulting in the cessation of the regular vortex shedding process, as shown in figure 5( f,k). On the other hand, the impinging jet-like flow pushes downward the shear layer separating from the upper side of the upstream cylinder, causing it to reattach on the front surface of the downstream cylinder, as shown in figure 5(b,g). The angles of the impingement of the jet-like flow varies with
 $Fr$, which will be discussed later in § 3.3.1. At large gap ratios, the formation of the shear layer separating from the free surface is no longer observed, which means that the influence of the free surface on the flow pattern is significantly diminished.
On the other hand, the vertical borders illustrate different behaviours of shear layers separating from the upstream cylinder, with a higher dependence on the variable  $S$ in the
 $x$ direction, as shown in figure 12(b). It can be observed that the critical spacing ratios at which the reattachment regime transitions to the co-shedding regime are different at varying submergence depths and Froude numbers. At a low Froude number of
 $Fr=0.2$, the critical gap ratio remains at
 $3.25$ when the cylinders are located close to the free surface (
 $G \leqslant 0.6$), but decreases to
 $3.00$ when
 $G \geqslant 0.8$. A similar trend is observed for
 $Fr=0.4$, except that the critical spacing ratio increases to
 $3.25$ when
 $G \geqslant 1.6$. As the Froude number increases to
 $0.6$, the critical spacing ratio reaches a significant low value of
 $2.75$ at
 $G=0.6$, and then remains at
 $3.25$ over a large range of gap ratios (
 $0.8 \leqslant G \leqslant 1.8$). The advance of the critical spacing ratio is attributed to the formation of an inclined jet-like flow in the gap between the cylinders, which suppresses vortex shedding from the upstream cylinder. However, this advance does not occur for
 $Fr=0.8$, since the greater deflection angle of the jet-like flow at higher Froude numbers allows the formation of staggered vortex shedding, as discussed previously in § 3.1.2. At
 $Fr=0.8$, a slightly larger critical spacing ratio of
 $3.5$ is observed at intermediate submergence depths (
 $1.0 \leqslant G \leqslant 1.2$). The critical spacing ratio recovers to
 $3.5$ as the cylinders are deeply submerged (
 $G \geqslant 2.0$). In general, the critical spacing ratio tends to be larger at higher Froude numbers, although the jet-like flow with small deflection angle formed at shallow submergence depths may cause the critical value to advance.
The different distribution of the flow patterns at varying  $Fr$ is mainly due to the different amplitudes of free-surface distortions and the local flow state in the vicinity of the free surface (Reichl et al. Reference Reichl, Hourigan and Thompson2005; Zhao et al. Reference Zhao, Wang, Zhu, Cao, Bao, Zhou and Han2022). At a low Froude number (
 $Fr=0.2$), only a negligible amount of vorticity resides at the free surface due to the small deformation of the free surface. As a result, the flow patterns without the free-surface shear layer are primarily observed at low Froude numbers, as indicated with light blue symbols in figure 11. However, at higher Froude numbers (
 $Fr \geqslant 0.4$), in addition to the substantial quantity of vorticity produced due to free-surface sharpening and wave breaking, the curved profile of the free surface effectively directs this free-surface vorticity into the bulk flow, significantly interfering with the wake evolution.
3.2. Free-surface effects on the mean flow field
3.2.1. Mean flow topology
It was established in the preceding section that the instantaneous flow features are significantly influenced by the presence of the free surface. We further present the free-surface effects on the mean flow topology in this section. Figure 13 shows several representative mean flow fields, revealing a significant asymmetry in the mean wake of the two circular cylinders due to the presence of the free surface. The mean flow topology can be correlated with the transient flow fields discussed in the previous section, offering a deeper insight into the underlying physical mechanisms involved.
Time-averaged streamlines with mean streamwise velocity ( $u/U_\infty$) in the wake of two tandem circular cylinders at
 $Fr=0.6$. The green lines indicate the time-averaged gas–fluid interfaces.

For the averaged wake of the upstream cylinder, the recirculation bubble in the near wake is narrowed and deflects toward the bottom side. In cases with small spacing ratios (figure 13a–c), the wake of the upstream cylinder is tightly confined within the narrow gap between the two tandem cylinders and pushed downward by the accelerated flow above the cylinders. There is a wall jet attached onto the front surface of the downstream cylinder, penetrating through the narrow gap between the cylinders. This is in contrast to the stagnant or quasi-steady fluid observed for two tandem circular cylinders without the free surface at small spacing ratios (Igarashi Reference Igarashi1981). The difference is due to the loss of symmetry in the system configuration with the presence of the free surface and the jet impingement, as discussed previously. This penetrating gap flow was also observed by Sumner et al. (Reference Sumner, Price and Paidoussis2000) for two staggered circular cylinders at small angles of incidence ( $10^\circ$ to
 $30^\circ$). At large spacing ratios, the wake of the upstream cylinder is driven downward and biased away from the centreline by the inclined jet-like flow formed above the upstream cylinder, as observed in figure 13(e,f). A comparison of figure 13(e,f) reveals that the jet-like flow has a smaller inclination angle at larger gap ratio, resulting in less confinement to the near wake of the upstream cylinder. The reduced confinement and the angled wake enable the vortex shedding process to occur for the upstream cylinder, leading to the pattern F-CW-S discussed previously. As the gap ratio and spacing ratio increase, the wake of the upstream cylinder progressively restores its symmetry, as exemplified in figure 13(h).
In terms of the averaged wake of the downstream cylinder, at small spacing ratios, the flow above the cylinders is effectively blocked and the entrainment requirement of the wake is not sufficiently met. Consequently, a subsequent low-velocity recirculation zone forms behind the cylinders, as shown in figure 13(a). In particular, when the separation spacing between the two cylinders is large enough for the jet-like flow to penetrate through the gap between the cylinders without impinging onto the downstream cylinder, the downstream cylinder will be completely immersed within the large-scale recirculation region formed behind the jet-like flow near the free surface, as illustrated in figure 13(e). It is evident that the length of the recirculation region decreases with deeper submergence depths. The extremely short formation region behind the downstream cylinder is attributed to the impingement of the upstream wake, as suggested by Carmo et al. (Reference Carmo, Meneghini and Sherwin2010b).
3.2.2. Mean mass flux ratio
As discussed above, the flow state within the gap significantly influences the wake evolution. To avoid ambiguity, the term ‘gap’ in this subsection specifically refers to the gap between the upper edge of the cylinders and the free surface. Here, two mean mass flux ratios ( $R_1$ and
 $R_2$) are defined to quantify the gap flow state, as illustrated in figure 14. Jiang et al. (Reference Jiang, Cheng, Draper and An2017) defined a similar quantity to characterize the flow within the gap between a circular cylinder and a moving wall. The mean mass flux ratio
 $R_1$ is defined as the ratio of the time-averaged mass flux through the gap at the upstream cylinder to the time-averaged mass flux of the free-stream flow, which is measured between the free surface and the cylinder centreline (
 $\kern0.7pt y=0$) at
 $10D$ in front of the upstream cylinder. The mean mass flux ratio
 $R_2$ is defined as the ratio of the time-averaged mass flux through the gap at the downstream cylinder to the time-averaged mass flux through the gap at the upstream cylinder. The definitions are given as
 $$\begin{gather} R_1=\frac{F_1}{F_0},\quad R_2=\frac{F_2}{F_1}, \end{gather}$$
 $$\begin{gather}F=\frac{1}{T} \int_{t}^{t+T} \iint_A \rho \boldsymbol{U} \boldsymbol{\cdot} \mathrm{d} \boldsymbol{A} \,\mathrm{d} t, \end{gather}$$
where  $F$ represents the time-averaged mass flux through the planar surface
 $A$ over the time duration
 $T$, while
 $F_0$,
 $F_1$ and
 $F_2$ denote the mean mass flux at the respective locations as marked in figure 14.
Sketch of the definition of the mean mass flux ratios.

Figure 15 shows the variation of the mean mass flux ratios as a function of spacing ratio and gap ratio at different Froude numbers. It can be observed that the variation of  $R_1$ with
 $G$ exhibits a consistent trend across different spacing ratios and Froude numbers, which suggests that the gap flow at the upstream cylinder is minimally influenced by the downstream cylinder. As the submergence depth increases,
 $R_1$ gradually increases from a value less than
 $0.4$ to nearly
 $1.0$. With the presence of the free surface, the mean mass flux ratios at the upstream cylinder stay below
 $1.0$ due to the fact that the flow passage above the cylinder is restricted by the free surface and it is easier for the flow to deflect to the bottom side of the cylinders where there is less restriction (Zhao et al. Reference Zhao, Wang, Zhu, Cao, Bao, Zhou and Han2022). Moreover, as the gap ratio increases, the restriction imposed by the free surface becomes progressively weaker. When the cylinders are placed extremely far below the free surface, it is expected that the mean mass flux ratio
 $R_1$ would approach a value of
 $1.0$ due to the restoration of symmetry in the system.
Variation of the mean mass flux ratio with  $G$ and
 $S$ at (a)
 $Fr=0.2$, (b)
 $Fr=0.4$, (c)
 $Fr=0.6$ and (d)
 $Fr=0.8$. The solid and dashed lines denote
 $R_1$ and
 $R_2$, respectively.

In contrast, the gap flow at the downstream cylinder is significantly affected by the upstream cylinder and the distortion of the free surface. As shown in figure 15(a), at a low Froude number ( $Fr=0.2$), the mean mass flux ratio
 $R_2$ keeps above approximately
 $0.5$, indicating that a substantial portion of the fluid entering the gap at upstream cylinder is transferred to the gap at the downstream cylinder. As the Froude number increases, the formation of the jet-like flow at small gap ratios redistributes the flow from the gap at the upstream cylinder. At small spacing ratios, the jet-like flow splits into two parts along the surface of the downstream cylinder in both clockwise and anticlockwise directions due to the impingement onto the downstream cylinder. The anticlockwise one diverts part of the flow, resulting in a decrease in the mean mass flux ratio
 $R_2$, which can be inferred from the flow visualizations in figures 5(a) and 13(a). When the jet-like flow penetrates through the region between the cylinders without impinging onto the downstream cylinder, a large-scale recirculation region forms behind the jet-like flow near the free surface, as visualized in figures 5( f) and 13(e). The downstream cylinder is completely immersed in this low-velocity recirculation region. Consequently, the mean mass flux ratio
 $R_2$ has an extremely small value, approaching zero, as shown in figure 15(d). As the gap ratio increases, the jet-like flow disappears and the mean mass flux ratio
 $R_2$ gradually approaches
 $1.0$. The representative topologies of the mean flow field corresponding to the variations of the mean mass flux ratios are shown in the insets in figure 15(d).
3.3. Free-surface effects on pressure and force
3.3.1. Pressure distribution
The free-surface effects on the flow fields discussed so far are, of course, also reflected in the pressure coefficient,  $2\bar {p}_{rgh}/\rho U_{\infty }^{2}$. The variations of the mean pressure coefficients around the two cylinders with the circumferential angle
 $\theta$ at
 $Fr=0.6$ are shown in Cartesian and polar coordinates in figure 16, where the time-averaged pressure at the middle cross-section (
 $z=4D$) is illustrated. Note that the contribution of hydrostatic pressure to the pressure coefficient has been excluded. Here,
 $\theta$ is the angle on the circumference taken from the rear base point on each cylinder, as illustrated in figure 16(b).
Mean pressure coefficient distributions around two tandem cylinders at various submergence depths at  $Fr=0.6$ for
 $S=1.50$ (a,b),
 $S=2.50$ (c,d) and
 $S=3.50$ (e,f). In Cartesian plots, the dashed and solid lines represent the pressure distribution around the upstream and downstream cylinders, respectively. The grey shaded region indicates the part of the cylinder surface facing the free surface. In polar plots, the direction of the arrows indicates the sign of the pressure, with positive values pointing inward towards the cylinder and negative values pointing outward away from the cylinder.

For the upstream cylinder, it is obvious that the mean pressure distribution around the cylinder surface is asymmetrical with respect to the cylinder centreline. The stagnation point deviates from the leading edge ( $\theta =180^\circ$) towards the upper side facing the free surface. The angle of deviation increases rapidly as the cylinder approaches the free surface, as depicted by the dashed arrow in figure 16(a). The maximum of deviation angle is approximately
 $22.9^\circ$ at
 $G=0.20)$ for all the gap ratios, and the minimum of deviation angle is approximately
 $3.5^\circ$ at
 $G=2.00)$, as shown in figure 16(a). A comparison between figures 16(a), 16(c) and 16(e) reveals that the separation distance between the two tandem cylinders hardly changes the deviation angle, which indicates that the downstream cylinder has a limited influence on the flow in front of the upstream cylinder. The pressure on the upper windward side is lower at small gap ratios than at large gap ratios, as shown in figure 16(b,d,f). This is due to the narrowing of the flow passage above the cylinders when they are placed close to the free surface. As a result, the flow is accelerated in that region, leading to a subsequent reduction in pressure. The decrease in pressure on the base side with increasing gap ratio indicates the enhancement of the vortex shedding from the upstream cylinder (Tong et al. Reference Tong, Cheng and Zhao2015).
In contrast, the mean pressure distribution around the downstream cylinder is significantly influenced by the presence of the upstream cylinder and the free surface. At small gap ratios, the inclined jet-like flow would impinge onto the downstream cylinder when it is placed close to the upstream cylinder, resulting in a region with positive pressure, as shown in figure 16(b,d). The location of the maximum pressure coefficient, corresponding to the jet impingement point, shifts upward as the gap ratio increases, as depicted by the solid arrow in figure 16(a). Additionally, the magnitude of the maximum pressure attenuates as the gap ratio increases due to the weakening of the jet-like flow. In the absence of the jet-like flow or the jet impingement, the pressure coefficient around the downstream cylinder is consistently negative, as indicated by the outward arrows in figure 16(b–f). Furthermore, figure 16(d,f) shows that, for the downstream cylinder, the red lines at small gap ratios are nearly enclosed within the blue lines at large gap ratios, indicating that the pressure magnitude decreases as the cylinder approaches the free surface. The decline of pressure magnitude implies a more energetic flow around the downstream cylinder due to the agitation of the distorted free surface. It can be observed that the mean pressure distribution around the downstream cylinder is characterized by one, two and one evident local maximum on the windward side at small, intermediate and large gap ratios, as shown in figure 16(a,c,e). This corresponds to the transition in the behaviour of the shear layers in the gap between the two tandem cylinders from impingement to reattachment to shedding.
The influence of the Froude number, spacing ratio and gap ratio on the mean stagnation pressure ( $C_{ps}$) and shift angles (
 $\alpha$) of mean stagnation points is presented in figure 17. The shift angle of the mean stagnation point is defined as the difference between the leading edge of the cylinder (
 $\theta =180^\circ$) and the angle of stagnation point, as illustrated in figure 17(b). As mentioned earlier, under certain conditions, the mean pressure distribution on the surface of the downstream cylinder exhibits two local maxima. In this case, only the larger maximum is considered as the stagnation point on the downstream cylinder. In terms of the upstream cylinder, the maximum shift angle always occurs at the smallest gap ratio, with a value of around
 $20^\circ$. The shift angle then decreases towards zero as the gap ratio increases, due to the progressive restoration of symmetry in the wake of the upstream cylinder, as discussed previously in § 3.2.1. The Froude number has a weak effect on the shift of the stagnation points on the upstream cylinder, although the shift angle increases slightly as the Froude number increases. For the downstream cylinder, when the spacing ratio is below the critical value, the shift angle rises from approximately
 $10^\circ$ to over
 $55^\circ$ as the gap ratio increases from
 $0.2$ to
 $2.0$. Simultaneously, the stagnation pressure decreases from positive values to negative values, as shown in figure 17(a–d). The deviation in shift angles between low and high Froude numbers reaches approximately
 $40^\circ$ at
 $G=0.2$, while the difference weakens as the gap ratio increases. Additionally, the mean stagnation pressure is significantly higher at larger
 $Fr$. This notable difference is primarily attributed to the strength and deflection angle of the jet-like flow formed near the free surface. However, when the flow enters the ‘co-shedding’ regime, the shift angle remains relatively stable, fluctuating within a small range of
 $20^\circ$ to
 $35^\circ$, and the mean stagnation pressure stays below
 $0.4$, as shown in figure 17(e,f).
Variations of mean stagnation pressure and shift angles of mean stagnation points as a function of gap ratios at (a)  $S=1.5$, (b)
 $S=2.0$, (c)
 $S=2.5$, (d)
 $S=3.0$, (e)
 $S=3.5$ and ( f)
 $S=4.0$. The size of the markers represents the magnitude of the stagnation pressure, with solid markers indicating positive values and hollow markers indicating negative values.

3.3.2. Force coefficients
Figure 18 shows time histories of the lift and drag coefficients and their fast Fourier transform (FFT) spectra for the upstream and downstream cylinders at  $(Fr, S)=(0.8, 3.5)$ for three submergence depths. At
 $G=0.2$, the flow pattern F-TW-O is observed, as shown in figure 5(k). In this flow pattern, a jet-like flow penetrates through the gap between the cylinders and vortex shedding is completely suppressed. Consequently, the r.m.s. values of hydrodynamic coefficients are very small, with
 $C_D^\prime =0.016$ and
 $C_L^\prime =0.024$ on the upstream cylinder, and
 $C_D^\prime =0.041$ and
 $C_L^\prime =0.050$ on the downstream cylinders, as shown in figure 18(a,d). Only a minor peak at half the vortex shedding frequency appears in the spectrum, as shown in figure 18(g). As the gap ratio increases to
 $0.6$, the flow pattern changes to F-CW-S, where staggered vortex shedding occurs, as illustrated in figure 5(m). Figure 18(b,e) shows a significant increase in the r.m.s. values of all forces, particularly for the downstream cylinder, where
 $C_D^\prime$ increases to
 $0.270$ and
 $C_L^\prime$ to
 $0.266$, while the mean drag coefficient rises from
 $-0.057$ to
 $0.596$. Obviously, this discontinuity in hydrodynamic forces corresponds to the change in the flow pattern from F-TW-O to F-CW-S. In the spectrum (figure 18a), alongside the prominent peak at the vortex shedding frequency, small peaks are also observed at half and twice this frequency due to the influence of the free-surface shear layer. The presence of the second subharmonic and harmonic of the vortex shedding frequency results in irregular time histories of the hydrodynamic forces, rather than a sinusoidal form, as shown in figure 18(b,e). As the gap ratio further increases to
 $1.0$, the wake transitions from staggered to parallel co-shedding, as illustrated in figure 5(o). The r.m.s. values of lift coefficients exhibit significant increase, as shown in figure 18(c), with
 $C_L^\prime$ rising to
 $0.420$ on the upstream cylinder and to
 $0.875$ on the downstream cylinder. The second subharmonic of the vortex shedding frequency is no longer present in the spectrum due to the weakening of the free-surface shear layer.
Time histories of lift and drag coefficients and their FFT for the upstream and downstream cylinders at  $(Fr, S)=(0.8, 3.5)$. Panels show (a,d,g)
 $G=0.2$, pattern F-TW-O; (b,e,h)
 $G=0.6$, pattern F-CW-S (staggered co-shedding); (c,f,i)
 $G=1.0$, pattern F-CW-S (parallel co-shedding).

Figure 19 summarizes the dependence of mean hydrodynamic forces on the spacing ratio and gap ratio for the two tandem cylinders near a free surface. Note that the lift force here excludes the contribution of hydrostatic force (buoyancy). The contours of mean force coefficients also reflect the dependence of the flow patterns on  $G$ and
 $S$ by comparing with figure 11.
Dependence on  $G$ and
 $S$ of mean drag coefficients (a,c,e,g) and mean lift coefficients (b,d,f,h) on the two tandem cylinders at
 $Fr=0.2$ (a,b),
 $Fr=0.4$ (c,d),
 $Fr=0.6$ (e,f) and
 $Fr=0.8$ (g,h). The white lines indicate the critical spacing ratios. In each panel, the left contours represent values for the upstream cylinder and the right contours represent values for the downstream cylinder. Contours vary from blue to white to red, representing values ranging from negative to zero to positive. The solid and dashed lines represent positive and negative values, respectively.

In terms of the mean drag force, the ‘drag inversion’ (Carmo et al. Reference Carmo, Meneghini and Sherwin2010b) is well reproduced at any Froude number. As shown in figure 19(a,c,e,g), the mean drag coefficient on the upstream cylinder jumps from a relatively small value to a higher value approaching that of a single isolated cylinder with increasing spacing ratio. Similarly, the mean drag coefficient on the downstream cylinder exhibits a discontinuous jump from negative values (a thrust force Zdravkovich Reference Zdravkovich1977) to positive values as the spacing ratio increases. The discontinuity in the values of the hydrodynamic forces when the separation distance between the two tandem cylinders varies continuously has been reported extensively in the literature (e.g. Arie et al. Reference Arie, Kiya, Moriya and Mori1983; Ljungkrona et al. Reference Ljungkrona, Norberg and Sundén1991; Alam et al. Reference Alam, Moriya, Takai and Sakamoto2003).
Although the ‘drag inversion’ occurs for any submergence depth, the mechanism responsible for small gap ratios (roughly  $G \leqslant 0.4$) is fundamentally different from that for larger gap ratios. The latter is attributed to the transition of the flow from the reattachment regime to the co-shedding regime, which is the result of the wake interference between the two cylinders. However, at small gap ratios, the reduction of the mean drag force on the upstream cylinder results from the incidence angle of the oncoming flow induced by the presence of the free surface. The angled oncoming flow in front of the upstream cylinder produces a downward inclined force on the upstream cylinder. Only the streamwise component of this force contributes to the drag force, resulting in a smaller drag compared with that in a uniform free stream, while the transverse component contributes the lift force on the upstream cylinder, leading to a negative value of the lift force, as shown in figure 19(b,d,f,h).
Regarding the mean lift force, as shown in figure 19(b,d,f,h), it is not surprising to see that the mean lift coefficients are not equal to zero due to the asymmetry of the mean wake topology discussed in § 3.2.1. It can be seen that the majority of the lift coefficient values across the  $G$–
 $S$ plane are negative. This can be attributed to the presence of the jet-like flow or the accelerated flow in the narrow gap between the cylinders and the free surface. The mean lift coefficients on the downstream cylinder recover to zero at large spacing ratios and gap ratios, but not for the upstream cylinder. This means influence of the free surface on the upstream cylinder is more severe than on the downstream cylinder.
Figure 20 is a compilation of the Strouhal numbers for the two tandem cylinders across the range of gap ratios and Froude numbers examined in this study. It is evident that the vortex shedding frequency is consistent for both the upstream and downstream cylinders, except in certain cases at small gap ratios. This frequency inconsistency is attributed to the no-shedding flow pattern, specifically patterns TW-O and F-TW-O, where the downstream cylinder is immersed in the low-velocity region formed behind the upstream cylinder, as shown in figures 4(a) and 5( f). Due to the low velocity of the oncoming flow, the Strouhal numbers are significantly higher for the downstream cylinder compared with the upstream cylinder. As shown in figure 20(a,b), the Strouhal numbers increase with deeper submergence depths for all Froude numbers at small spacing ratios ( $S=1.5$, 2.0). At large spacing ratios (
 $S=3.5$, 4.0), the Strouhal numbers exhibit different trends depending on the Froude number: they rise from lower values (approximately
 $0.15$) with increasing
 $G$ at low Froude numbers (
 $Fr = 0.2$ and
 $0.4$), while they decrease from higher values (around
 $0.225$) with increasing
 $G$ at high Froude numbers (
 $Fr = 0.6$ and
 $0.8$), as shown in figure 20(e,f). Eventually, at large gap ratios, the Strouhal numbers converge to the same value (
 $\approx$0.175). The small Strouhal numbers observed at small gap ratios and low Froude numbers are attributed to the delayed roll-up process of the upper shear layer caused by the confinement of the free surface, as shown in figure 4(h). In contrast, the high Strouhal numbers at small gap ratios and high Froude numbers are due to the presence of the free surface that causes the oncoming flow to deviate from the centreline of the cylinder, thus reducing the effective oncoming flow velocity, as shown in figure 5(m).
Variations of Strouhal numbers for the two tandem cylinders as a function of gap ratios at (a)  $S=1.5$, (b)
 $S=2.0$, (c)
 $S=2.5$, (d)
 $S=3.0$, (e)
 $S=3.5$ and ( f)
 $S=4.0$.

3.4. Free-surface distortions
As shown in figures 8–10, unsteady undulations of the free surface are discernible. In addition to the noticeable curvature of the free surface in the region immediately above the cylinders that is generated by the obstruction of the blunt bodies, the distortions downstream of the cylinders induced by the vortex street are also of interest. Therefore, this section highlights the characteristics of the deformations of the free surface and their correlation to the flow fields.
Before starting this section, it is necessary to clarify the nearly two-dimensionality of the free-surface deformation in the spanwise direction. Figure 21 shows the instantaneous free-surface deformation at  $(Fr, G, L)=(0.8, 1.0, 4.0)$, where the most violent distortion occurs within the parameter space examined in the present study. It can be observed that the free-surface profile remains consistent in the
 $z$-direction both upstream and downstream of the cylinders, while slight spanwise inhomogeneity in free-surface deformation can be seen near the cylinders due to wave breaking and strong vortex interactions. The regular profile of the time evolution of the free-surface elevation at the streamwise section of
 $x/D=7$ further supports the spanwise homogeneity of the free-surface deformation at a low Reynolds number of
 $Re=180$. In fact, severe inhomogeneity of the free-surface distortion in the spanwise direction can be induced by the totally 3-D flow at much higher Reynolds numbers (see Appendix A). Therefore, the free-surface deformation is considered nearly two-dimensional at
 $Re=180$, the free-surface elevation mentioned henceforth refers to the elevation sampled at the middle cross-section of the cylinders.
Isometric view of the instantaneous free-surface distortions with an exaggeration of  $4:1$ in the
 $y$ direction at
 $(Fr, G, L)=(0.8, 1.0, 4.0)$. The top inset shows the time evolution of the free-surface elevation at the streamwise section of
 $x/D=7$.

3.4.1. Mean surface elevation
Figure 22 shows the profiles of the time-averaged elevations of the free surface along the streamwise direction for three Froude numbers addressed in the present study. Yu & Tryggvason (Reference Yu and Tryggvason1990) has suggested that the Froude number is the decisive parameter governing the free-surface distortion. Although not shown here, at the lowest Froude number ( $Fr=0.2$), the free surface exhibits negligible distortions at any gap ratio, with the maximum mean elevation not exceeding
 $2\,\%$ of the cylinder diameter. At a similar Froude number (
 $Fr\approx 0.24$), Miyata, Shikazono & Kanai (Reference Miyata, Shikazono and Kanai1990) observed no discernible free-surface distortions in the flow around a circular cylinder steadily advancing beneath a free surface. This can be attributed to the low effective Froude number, where the small inertial force compared with gravity prevents significant distortions of the free surface (Sarpkaya Reference Sarpkaya1996). However, as the Froude number increases, the inertial force becomes increasingly dominant compared with gravity, resulting in noticeable deformations of the free surface due to the stirring and mixing effects caused by the significant inertial force, as shown in figure 22 (note the difference in the limits of the
 $y$-coordinate). The maximum mean elevation reaches approximately
 $0.05D$,
 $0.15D$ and
 $0.25D$ at
 $Fr=0.4$,
 $0.6$ and
 $0.8$, respectively. Noticeable surface distortions have also been observed in the flow around a single circular cylinder close to a free surface at large Froude numbers (e.g. Reichl et al. Reference Reichl, Hourigan and Thompson2005; Moreira & Peregrine Reference Moreira and Peregrine2010; Zhao et al. Reference Zhao, Wang, Zhu, Ping, Bao, Zhou, Cao and Cui2021).
Variation of profile of mean free-surface elevation ( $\bar {\eta }/D$) with
 $G$ and
 $S$ at
 $Fr=0.4$ (a–c),
 $Fr=0.6$ (d–f) and
 $Fr=0.8$ (g–i). The dashed lines represent vertical centrelines of the upstream and downstream cylinders.

As shown in figure 22, a pronounced hydraulic jump induced by the obstruction beneath the free surface occurs immediately above the upstream cylinder. This leads to a rather abrupt rise with a constant height in the free surface followed by a widely extended trough. In general, a sink with varying depth appears immediately behind each cylinder. In the region behind the two tandem cylinders, the mean free-surface elevation remains close to the still water level, while significant elevation fluctuations can be identified due to wave generation, as discussed in the next subsection.
The occurrence of the hydraulic jump is attributed to the abrupt change in flow regime from locally supercritical to locally subcritical, as suggested by Chanson (Reference Chanson2004). This phenomenon and its underlying mechanism are virtually the same as those observed in the flow around a single circular cylinder near a free surface, as investigated in previous studies (Zhao et al. Reference Zhao, Wang, Zhu, Ping, Bao, Zhou, Cao and Cui2021, Reference Zhao, Wang, Zhu, Cao, Bao, Zhou and Han2022). It can be observed from figure 22 that the variation of the height of the hydraulic jump almost remains consistent across varying spacing distance between the cylinders. Figure 23 shows variations of the hydraulic jump height ( $H_{Jump}$) as a function of gap ratios for all Froude numbers at
 $S=3.5$. The height of the hydraulic jump shows a clear tendency to increase with higher Froude number and decrease with deeper submergence depth. The jump height reaches its maximum at the smallest gap ratio (
 $G=0.2$):
 $0.017D$ at
 $Fr=0.2$,
 $0.072D$ at
 $Fr=0.4$,
 $0.160D$ at
 $Fr=0.6$ and
 $0.274D$ at
 $Fr=0.8$. It then decreases to
 $0.1D$ at
 $Fr=0.8$ and falls below
 $0.05D$ at
 $Fr \leqslant 0.6$ at the largest gap ratio
 $G=2.0$ examined in the present study.
Variations of the hydraulic jump height as a function of gap ratios at  $S=3.5$.

3.4.2. Free-surface waves
The gravity waves induced by a submerged cylinder in a uniform flow near a free surface has attracted extensive attention. Assuming a steady irrotational potential flow with a linearized free-surface boundary condition and replacing the cylinder by an equivalent doublet at its centre, Lamb (Reference Lamb1932) observed a local distortion immediately above the obstacle followed by a train of stationary sinusoidal gravity waves downstream of the cylinder. Furthermore, Tuck (Reference Tuck1965) considered the nonlinear effects from the free-surface boundary and suggested that the nonlinear solution would involve highly non-sinusoidal or even breaking waves. Other authors who have more recently investigated free-surface gravity flow around a submerged cylinder include Dagan (Reference Dagan1971), Moreira & Peregrine (Reference Moreira and Peregrine2010) and Semenov & Wu (Reference Semenov and Wu2020). However, the present vortex system involves intricate arrays of vortices shed from both the cylinders and the free surface, and these vortices are not fixed in position but convect and diffuse within the viscous flow. Therefore, the distortions of the free surface are a consequence of the mutual induction and interaction of all vorticity concentrations (Cetiner & Rockwell Reference Cetiner and Rockwell2001).
Figure 24 presents the temporal evolution of the free surface at a spacing ratio of  $S=4.00$ for the three Froude numbers examined in the present study. The selected gap ratios of
 $G=0.40$, 0.80, 1.60 represent shallow, intermediate and deep submergence, respectively. Gravity waves are discernible on the downstream side, although the regularity and continuity of the waves vary depending on the specific parameter combinations. Free-surface undulations can be observed between the two tandem cylinders, which results from the large drop of the hydraulic fall. This phenomenon is similar to the trapped waves induced by two successive submerged obstacles investigated by many other authors, such as Dias & Vanden-Broeck (Reference Dias and Vanden-Broeck2004), Page & Părău (Reference Page and Părău2014) and Shelton & Trinh (Reference Shelton and Trinh2023). At the free surface between the cylinders, the waves are not as well organized as the waves far downstream, and the wavelengths are shorter and more irregular. Note also that some ripples may be formed in front of the upstream cylinder at small Froude numbers (
 $Fr \leqslant 0.4,$), while a stationary hydraulic jump with a constant height is formed at a large Froude number (
 $Fr \geqslant 0.6$). The reason may be that the relatively small upstream Froude numbers might potentially intersect with the linear dispersion relation (Wang et al. Reference Wang, Chai, Părău, Page and Wang2022), leading to a train of waves upstream. It can be observed that the induced waves downstream of the cylinders have higher phase velocities and shorter wavelengths at higher Froude numbers, as indicated by the steeper slope of the wave propagation trajectories. A summarized profile of the free-surface distortion is illustrated in figure 25.
Temporal evolution of the free surface at  $S=4.00$ for
 $Fr=0.2$ (a–c),
 $Fr=0.4$ (d–f),
 $Fr=0.6$ (g–i) and
 $Fr=0.8$ (j–l). The green dashed lines indicate the centres of the upstream and downstream cylinders.

Schematic profile of the free-surface distortion in the flow around two tandem circular cylinders near a free surface.

Figure 26 shows variations of wave height ( $H_{Wave}$) as a function of gap ratios for all Froude numbers at
 $S=3.5$. Here, wave height is defined as the r.m.s. value of free-surface elevation multiplied by
 $2\sqrt {2}$. Wave heights are measured at two streamwise locations:
 $x/D=-10$ (upstream of the cylinders) and
 $x/D=10$ (downstream of the cylinders). As shown in figure 26(a), observable wave heights occur only at
 $Fr=0.4$, while the wave heights stay well below
 $0.03D$ for the other Froude numbers. This observation is consistent with figure 24, which indicates that wave generation upstream of the cylinders only occurs at
 $Fr=0.4$. A comparison between figures 26(a) and 26(b) reveals that the wave heights upstream at
 $Fr=0.4$ are consistently higher than the wave heights downstream at any submergence depth. As shown in figure 26(b), the wave height downstream of the cylinder increases and then decreases with increasing submergence depth. The height of wave is related to the strength of the vortex structures and the regularity of the vortex streets beneath the free surface. At shallow submergence depths, the vortex shedding from the cylinders can be disrupted or completely suppressed by the free-surface shear layer. As a result, waves generated behind the cylinders are less energetic, with low wave heights at small gap ratios. As the submergence depth increases, the interference effects of the free-surface shear layer are reduced, allowing for a more regular and continuous vortex street, so that the fluid can be stirred up violently, thus generating waves with large wave heights. As the gap ratio further increases, the vortex streets are too far from the free surface to effectively transfer energy to the free surface, leading to a decrease in wave height. As shown in figure 26(b), the wave height reaches its maximum value of
 $0.10D$ at
 $G=0.8$ for
 $Fr=0.4$,
 $0.15D$ at
 $G=1.0$ for
 $Fr=0.6$ and
 $0.22D$ at
 $G=1.2$ for
 $Fr=0.8$. It can also be observed that the wave height increases with higher Froude number, and the gap ratio at which the wave height reaches it maximum also increases with higher Froude number. This is consistent with the conclusion from other authors (Reichl et al. Reference Reichl, Hourigan and Thompson2005; Bouscasse et al. Reference Bouscasse, Colagrossi, Marrone and Souto-Iglesias2017; Zhao et al. Reference Zhao, Wang, Zhu, Cao, Bao, Zhou and Han2022) that a larger Froude number leads to more drastic free-surface deformation.
Variations of wave height as a function of gap ratios for  $S=3.5$ at (a)
 $x/D=-10$ and at (b)
 $x/D=10$.

Figure 27 shows variations of wave height as a function of spacing ratios for all Froude numbers at  $G=0.8$. It can be observed that the wave heights stay below approximately
 $0.05D$ before the critical spacing ratio, while they increase abruptly at the critical spacing ratio. This is attributed to the wake transition from the ‘reattachment’ regime to the ‘co-shedding’ regime, where two vortex streets behind the two tandem cylinders in the ‘co-shedding’ regime can induce waves with large wave heights.
Variations of wave height as a function of spacing ratios for  $G=0.8$ at
 $x=10$.

3.4.3. Characteristics of the induced waves
Furthermore, figure 28 shows the dispersion relations of the waves on the downstream side at  $S=4.00$,
 $G=1.60$ for three Froude numbers examined in the present study, obtained by performing the space–time fast Fourier transform of surface elevations. The abscissa represents the wavenumber (
 $k$) normalized by the diameter of the cylinder (
 $D$). The frequency is normalized in the form of Strouhal frequency. The linear dispersion relation of waves on a mean current in deep water is given by (Phillips Reference Phillips1966)
 \begin{equation} (\omega-kU)^2=gk, \end{equation}
where  $g$ is the acceleration due to gravity,
 $k$ is the wavenumber,
 $\omega$ is the angular frequency and
 $U$ is the constant velocity of the mean current. On the downstream side of the cylinders, the flow velocity gradually recovers to the that of the free stream, i.e.
 $U=U_\infty$ in the present study. The dispersion relations of waves downstream of the cylinders show good agreement with the linear dispersion relation at harmonics of the vortex shedding frequency.
The dispersion relations of the waves on the downstream side at  $S=4.0$,
 $G=1.6$ for: (a)
 $Fr=0.2$, (b)
 $Fr=0.4$, (c)
 $Fr=0.6$ and (d)
 $Fr=0.8$. The white curves represent the linear dispersion relations of waves on a mean current in deep water.

It can be observed that the frequencies of the waves cluster around the vortex shedding frequency, as shown in figure 28. Figure 29 shows the time histories of the wave heights and their power spectral density (PSD) along the streamwise locations at  $x/D=-10$,
 $-5$, 0, 5, 10 for
 $(Fr, G, S) = (0.4, 0.8, 1.6)$, corresponding to the case shown in figure 24( f). The peak frequencies of the waves at all streamwise locations are consistent and align with the vortex shedding frequency, which further confirms the correlation between the vortex shedding and wave generation on the downstream side.
Wave height at different streamwise locations at  $(Fr, G, S) = (0.4, 0.8, 1.6)$. (a) Time histories of the wave height at
 $x/D=-10$,
 $-5$, 0, 5, 10; (b) PSD of the wave heights.

It should be noted that well-organized waves on the downstream side are only allowed to occur when the vortex street is stable and the vorticity is well concentrated in the wake of the cylinders. In cases where vorticity is dispersed due to unstable vortex shedding, vortex impingement or interference from the free-surface vorticity, the generation of free-surface waves is inhibited, as shown in figure 24(j). Compared with the wave generation by a single fixed submerged point vortex (Shelton & Trinh Reference Shelton and Trinh2023) or a single fixed submerged doublet (Moreira & Peregrine Reference Moreira and Peregrine2010), the generation of waves by moving vortex arrays in the present system can be more complex and challenging.
4. Conclusions
This study presents 3-D simulations of flow around two tandem circular cylinders near a deformable free surface. The simulations are carried out at  $Re=180$ in a parameter space of gap ratios (
 $G=h/D$) ranging from
 $0.20$ to
 $2.00$, spacing ratios (
 $S=L/D$) from
 $1.50$ to
 $4.00$ and Froude numbers of
 $0.2$,
 $0.4$,
 $0.6$ and
 $0.8$.
The free-surface effects on the wake flow have been examined. Owing to the constraint of the free surface to the flow passage above the upstream cylinder, a jet-like flow accompanied by a shear layer of positive vorticity is formed in the wake at small gap ratios. The jet-like flow may impinge on the downstream cylinder, penetrate through the gap between the cylinders or undergo an oscillation adjacent to the free surface as the spacing ratio increases. Correspondingly, the dynamic behaviours of the free-surface shear layer significantly alter the wake evolution, leading to the classification of the wake into eight distinct flow patterns. At intermediate gap ratios, the wake flow of two tandem cylinders resembles that of two staggered cylinders due to jet-like flow altering the incidence angle, effectively mimicking a staggered configuration.
The 3-D wake is characterized by a mode B structure with a spanwise wavelength of around  $1.3D$ when the flow pattern is F-SW-SR. For other flow patterns, the spanwise vorticity in the wake is dominated by the primary vortices with spanwise-periodic deformation at various wavelengths, resembling mode A. At shallow submergence depths, large-scale streamwise vortex structures are formed in the free-surface shear layer. As the gap ratio increases, the wavy deformation of the primary vortex cores disappears, and the flow transitions to a two-dimensional (2-D) state. The three-dimensionality of the flow around two tandem cylinders near a free surface becomes more pronounced with increasing Froude number.
A map of dependence of flow patterns on the gap ratio and spacing ratio is summarized. Boundaries between different flow regimes are also proposed. The flow pattern exhibits a dominant dependence on the gap ratio, in which the free-surface shear layer plays a significant role. Higher Froude numbers can extend the effect of the free surface to deeper submergence depths. The critical spacing ratio tends to be larger at higher Froude numbers, although the jet-like flow with small deflection angle formed at shallow submergence depths may cause the critical value to advance. As the submergence depths increases, it is expected that the critical spacing ratio gradually converges to that observed in the absence of a free surface.
A large-scale low-velocity recirculation zone near the free surface at small gap ratios may form due to the blockage of the front blunt bodies. The blocking effect is quantified by the mean mass flux ratios of the gap flow. The variation of the mean mass flux ratios with  $G$ and
 $S$ reveals that the gap flow above the upstream cylinder is minimally influenced by the downstream cylinder while the gap flow above the downstream cylinder is significantly affected by the upstream cylinder.
The presence of the free surface also significantly affects the mean pressure distribution and mean hydrodynamic forces on each of the two cylinders. The stagnation point of the upstream cylinder deviates from the leading edge towards the upper side facing the free surface, resulting in an asymmetrical pressure distribution. While the pressure distribution on the downstream cylinder is even more complex since it is significantly influenced by the presence of the upstream cylinder and the jet-like flow. Maps of the dependence of the mean drag and lift coefficients on  $G$ and
 $S$ have been compiled. The ‘drag inversion’ phenomenon is well reproduced. The mean lift coefficients are not equal to zero or even negative due to the asymmetry of the mean wake topology, and recover to zero at large spacing ratios and gap ratios. The Strouhal numbers increase with deeper submergence depths for all Froude numbers at small spacing ratios (
 $S=1.5$, 2.0). At large spacing ratios (
 $S=3.5$, 4.0), the Strouhal numbers rise from lower values with increasing
 $G$ at low Froude numbers (
 $Fr = 0.2$ and
 $0.4$), while the opposite trend occurs at higher Froude numbers. Eventually, the Strouhal numbers converge to the same value at large gap ratios.
The Froude number is the dominant parameter that governs the deformation of the free surface. The free-surface undulation is negligible at low Froude numbers, whereas the free surface distorts violently at moderate and high Froude numbers. The free-surface profile typically consists of a hydraulic jump immediately ahead of the upstream cylinder, trapped waves in the vicinity of the two tandem cylinders and well-defined travelling waves on the downstream side. The dispersion relations of the generated waves downstream of the cylinders show good agreement with the linear dispersion relation. The frequencies of the waves cluster around the vortex shedding frequency, which implies an intrinsic correlation between the vortex shedding and the wave generation.
Supplementary movies
Supplementary movies are available at https://doi.org/10.1017/jfm.2024.1066.
Funding
The authors gratefully acknowledge the financial support by the National Natural Science Foundation of China (grant nos. 12372270, 42076210, 52122110, 52101322, 52371285 and U2341242). The numerical calculations in this study were carried out on the ORISE Supercomputer.
Declaration of interests
The authors report no conflict of interest.
Appendix A. Three-dimensional large-eddy simulation results at $(Fr, G, S)=(0.6, 0.4, 2.5)$

The present study investigates the flow around two tandem circular cylinders near a free surface at a low Reynolds number of  $Re=180$. To examine the difference of the flow structures and free-surface deformation between low and high Reynolds number, a 3-D large-eddy simulation (LES) is performed at
 $Re=7550$ for
 $(Fr, G, S)=(0.6, 0.4, 2.5)$. The same numerical approach and set-up as used in Zhao et al. (Reference Zhao, Wang, Zhu, Ping, Bao, Zhou, Cao and Cui2021) are adopted here. The only difference is the presence of two tandem cylinders instead of a single isolated circular cylinder in the study of Zhao et al. (Reference Zhao, Wang, Zhu, Ping, Bao, Zhou, Cao and Cui2021).
A.1. Wake evolution
Figure 30 shows snapshots of the wake evolution in the middle cross-section of the cylinders, including the instantaneous pressure and vorticity fields. From an overall perspective, the snapshot series of the wake evolution cycle exhibit many similar flow behaviours to those observed at  $Re=180$ shown in figure 7. The shear layer separating from the free surface undergoes breakdown as it travels downstream and intermittently impinges on the downstream cylinder. The wake of the upstream cylinder is elongated and forced to deflect downward due to the presence of the jet-like flow. The vortex shed from the upper shear layer separating from the upstream cylinder impinges on and sweeps over the downstream cylinder. The downstream cylinder is subjected to the impingement of the jet-like flow and immersed in the wake of the upstream one and the free-surface shear layer. The vortex shedding process from the downstream cylinder is relatively weak and the recirculation length is short. The upper shear layer separating from the downstream cylinder interacts significantly with the free-surface shear layer. These observations from the downstream cylinder are quite similar to the findings reported by Aasland et al. (Reference Aasland, Pettersen, Andersson and Jiang2022) for tandem cylinder flow. The important flow features are illustrated and described in the internal captions in figure 30, which are similar to those observed in the 2-D simulation results and will not be discussed in detail here. A movie showing the wake evolution is available as supplementary movie 2.
Instantaneous vorticity contours with pressure distributions (left column) in the middle cross-section of the cylinders. The time instants (a–e) are specified by dashed lines in the inset of the time history of the lift force coefficient ( $C_L$) of the upstream cylinder. The internal captions identify the major flow behaviours. The green lines indicate the gas–fluid interfaces.

Figure 31 shows the development of shear layer vortices from both the cylinders and the free surface. With respect to the free-surface shear layer, large-scale spanwise vortices are generated during the initial stage of separation from the free surface. A movie showing the temporal development of flow structure is available as supplementary movie 3. As shown in the left top image in figure 31, the primary spanwise vortices immediately undergo a stretching, twisting and disintegration process and reorganize the vorticity in the form of a train of hairpins. The hairpin vortices are entrained by the jet-like flow and travel in group in the region between the two tandem cylinders. As the free-surface shear layer approaches the downstream cylinder, the hairpin vortices arches break down, leading to the formation of streamwise structures in the overtopping region of the downstream cylinder, as portrayed in the right top inset in figure 31. In the overtopping region, the free-surface shear layer and the upper shear layer of the downstream cylinder are clearly layered, rather than merged with each other. Similar observations were reported by Aasland et al. (Reference Aasland, Pettersen, Andersson and Jiang2022), although in their study, both shear layers were separating from cylinders. These large-scale streamwise vortices transverse further downstream and are entrained in the wake, subsequently interacting with the upper shear layer separating from the downstream cylinder through diffusion and cross-annihilation. The interaction precludes the formation of large-scale vortices from the upper shear layer, resulting in the transformation of the upper shear layer into a loose aggregation of small-scale vortices.
Instantaneous wake of two tandem cylinders near a free surface, represented by isosurfaces of  $QD^2/U_\infty ^2 =10$ coloured by spanwise vorticity
 $\omega _z D/U_\infty$. The top image shows only top part of the flow structures for clarity. The left top image shows the hairpin vortices coloured by velocity in the free-surface shear layer. The right top inset shows large-scale streamwise vortices in the overtopping region of the downstream cylinder, which have been coloured with the streamwise vorticity to highlight their orientation. The middle and the bottom images provide the side and bottom views of the wake, respectively. The internal captions identify the major vortex behaviours discussed in the text.

The shear layers separating from the upstream cylinder roll up in front of the downstream cylinder and large-scale spanwise vortices are shed. These large-scale spanwise structures subsequently impinge on the downstream cylinder. The impingement of vortices on the downstream cylinder is not direct, but rather delayed or buffered by the presence of the irrotational region created by the impingement of the jet-like flow, as illustrated in the side view in figure 31. The shear layer vortices shed from the upstream cylinder undergo rapid twisting and breakdown as they sweep over the downstream cylinder, resulting in the disintegration of the vortices into smaller structures within a short distance. The disintegrated structures mix and merge with the shear layer vortices separating from the bottom side of the downstream cylinder, leading to the entrainment of these structures into larger-scale vortex structures, as shown in the bottom view in figure 31.
In general, the vorticity at a low Reynolds number is more concentrated and energetic primarily due to the absence of the disruptions and diffusion caused by three-dimensionality (Tong et al. Reference Tong, Cheng and Zhao2015). Benefiting from the well-resolved 3-D numerical simulation, the small-scale structures of the flow are well captured. The wake predicted by the 3-D model consists of numerous small-scale eddies and spanwise vortex dislocations. The less concentrated vorticity and the spanwise inhomogeneity result in more intricate free-surface distortions, which will be addressed in the next section.
A.2. Surface distortion
Figure 32 shows the instantaneous free-surface distortions. To highlight the wave profile, appropriate exaggeration of the geometry in the  $y$-direction is applied. From an overall perspective, the free-surface distortions exhibit a similar pattern to the summarized profile concluded from results at
 $Re=180$ shown in figure 25. A noticeable hydraulic jump in the overtopping region of the upstream cylinder is formed. A free-surface rise of relatively small height can also be observed in the overtopping region of the downstream cylinder. In the region between the cylinders, there is intense surface agitation characterized by violent wave motion, localized wave breaking and air entrainment. This is primarily caused by the complex vortex dynamics in the free-surface shear layer, as discussed in the previous section. Spatially periodic free-surface undulations start to develop downstream of the cylinders. Particularly after a distance of approximately
 $x/D \geqslant 4$, a discernible long-wavelength wave is generated, as shown in the side view in figure 32. The generated travelling wave exhibits a well-organized wave motion, as seen in the time evolution of the free-surface elevation at the streamwise section of
 $x/D=7$, and maintains its wave shape over a long distance on the downstream side.
Isometric view of the instantaneous free-surface distortions with an exaggeration of  $5:1$ in the
 $y$ direction. The bottom inset provides the side view of the free-surface profile with a vertical exaggeration of
 $10:1$. The top inset shows the time evolution of the free-surface elevation at the streamwise section of
 $x/D=7$.

Wave generation is observed at both low and high Reynolds numbers; however, the waves generated at high Reynolds numbers tend to be more irregular compared with those at low Reynolds numbers. This irregularity is reflected in the undulation and interruption of the wave shape both in streamwise and spanwise directions, as shown in figure 32. In the LES results, the vorticity is less concentrated and less energetic in the wake, leading to a less sinusoidal wave shape and lower wave height. In addition, the aforementioned three-dimensionality of the flow gives rise to the inhomogeneity of the wave in the spanwise direction.



