

Sickle cell anaemia, a common chronic debilitating haematological disease,Reference Ashley-Koch, Yang and Olney1 is prevalent in sub-Saharan AfricaReference Piel, Patil and Howel2 with Nigeria having the largest number of children with the condition world wide.3 It is one of the highest non-infectious cardiopulmonary causes of mortality in children.Reference Powars, Chan, Hiti, Ramicone and Johnson4–Reference Alkali and Ambe6
Most data describing the cardiovascular complications in sickle cell anaemia come from the adult literature where only steady-state changes were obtained.Reference Machado, Kyle Mack and Martyr7–Reference Kuma, Owusu-Amsah and Ampomah11
Pain which is the clinical hallmark of vaso-occlusive crisis is debilitating for the sufferer and is associated with high hospital admission rates, a high economic burden, and loss of school hours. Severe painful crisis is a major cause of morbidityReference Yusuf, Atrah, Grosse, Parker and Grant12,Reference Ahmed, Kagu, Abjah and Bukar13 and an important contributor to mortality in adults and children with sickle cell anaemia. Acute painful crises are triggers for the acute chest syndrome,Reference Elenga, Cuadro, Martin, Cohen-Addad and Basset5,Reference Alkali and Ambe6,Reference Vichinsky, Neumayr and Earles14 which is one of the leading causes of morbidity and the most common cause of mortality in sickle cell anaemia patients.Reference Powars, Chan, Hiti, Ramicone and Johnson4,Reference Elenga, Cuadro, Martin, Cohen-Addad and Basset5 Both vaso-occlusive crisis and acute chest syndrome cause acute increases in pulmonary artery pressureReference Machado, Kyle Mack and Martyr7,Reference Dessap, Leon and Habibi8 which can be measured indirectly using echocardiography. Even a mild but acute increase in pulmonary artery pressure could be devastating and may result in cardiovascular collapse and sudden death. StudiesReference Gladwin, Sachdev and Jison9,Reference Gladwin and Vichinsky10 in adult patients with sickle cell anaemia have shown that the tricuspid regurgitation velocity of ≥2.5 m/s using echocardiography increases the risk of death 10-fold and is a major independent risk factor for sudden death.Reference Gladwin, Sachdev and Jison9 In addition, electrocardiographic evidence of ischaemic cardiac changes that were thought to be rare in children are now being frequently documented during vaso-occlusive crisis and acute chest syndrome thus suggesting that these conditions might have been under-diagnosed and under-reported.Reference Bode-Thomas, Hyacinth, Ogunkunle and Omotoso15,Reference de Montalembert, Maunoury, Acar, Brouser and Lenoir16 It is therefore necessary to evaluate the effects of severe sickle cell crisis on the cardiovascular system in order to establish the prevalence of these conditions in children with sickle cell crisis and provide a platform for advocating anticipatory care during episodes of severe sickle cell crisis in at-risk patients.
Methodology
Study location
This study was conducted in the Federal Capital Territory of Nigeria, Abuja. There are two well-established tertiary health facilities in the area, namely the National Hospital Abuja and the University of Abuja Teaching Hospital.
Paediatric sickle cell clinics are held weekly in these hospitals. A total of 800 sickle cell disease patients are registered on the clinics database. The majority of the patients (95%) have sickle cell anaemia. Children who develop mild vaso-occlusive crisis are treated in the clinic, while those with severe pain and other manifestations of crisis are hospitalised in the emergency unit in the respective hospitals.
Study design
A cross-sectional comparative study involving age- and sex-matched children with sickle cell anaemia between ages 5 and 17 years with any form of severe crisis (cases) warranting hospital admission and those in steady state (controls) was conducted. Children in steady state (haemoglobin SS patients with no acute illness in the preceding 4–6 weeks) were obtained from the weekly held sickle cell clinic. The cases with sickle cell crisis were obtained from the Emergency Paediatric Unit.
Exclusion criteria
Children with concomitant heart diseases and metabolic conditions were excluded.
Study outcome variables
Primary outcome was the proportion of children with myocardial ischaemia determined by electrocardiography and a serological cardiac biomarker (N-terminal pro B-type natriuretic peptide ≥160 pg/ml, cardiac troponin I > 0.2 ng/ml).
Secondary outcomes determined using echocardiography included (a) systolic and diastolic cardiac dysfunction using Doppler parameters, (b) tricuspid regurgitation velocity >2.5 m/s and Doppler-estimated mean pulmonary artery pressure >25 mmHg, and clinical parameters such as systemic blood pressure and heart rates
Sample size calculation was based on the data published by Bode-Thomas et al.Reference Bode-Thomas, Hyacinth, Ogunkunle and Omotoso15 from Jos, north-central Nigeria on the prevalence of significant myocardial ischaemia in children with vaso-occlusive crisis (89.5%) and those in steady state (72.5%). Using Stata 14 statistical software, a power of 80%, a significance level of 5%, a sample size of 166 patients (83 patients in steady state and 83 patients in crisis) were shown to be sufficient in order to detect a significant influence of sickle cell crisis on the prevalence of myocardial ischaemia. For the study, 176 patients were recruited, comprising 92 patients in steady state and 84 patients in crisis.
Study procedure
Children that fulfilled the inclusion criteria were recruited by convenience (non-probability) sampling. The patients had a single pulse oximetry, blood pressure, and heart rate measurements performed manually, as well as a single standard 12-lead surface electrocardiography and a single transthoracic echocardiography. Blood samples were taken for cardiac biomarkers for the two groups of patients (in the haematology clinic for those in steady state and during admission for those in crisis. Patients in whom significant cardiac abnormalities such as systemic blood pressures >99 percentile +5 mmHg (eight patients), tricuspid regurgitation ≥3 m/s (five patients), and elevation of mean pulmonary pressure >40 mmHg (three patients) were referred to the cardiac clinic for follow-up but their follow-up details are not included in this report.
Detailed study procedures
The processes involved in the study procedures were explained to each parent/child, with a demonstration to reassure them of its safety and to calm the child. For those recruited during a crisis episode, the measurements were taken after administration of pain medications, once the pain had subsided and the patient was calm.
Blood pressure measurement
A supine brachial blood pressure was obtained manually with an appropriate size cuff of the mercury sphygmomanometer (AccosonDekamet®; A.C. Cossor and Son Surgical Ltd, Accoson Works, Harlow, Essex, UK) applied to the right arm. The results were interpreted according to normative referenced values17
Electrocardiographic evaluation
A conventional 12-lead resting electrocardiography (using Biocare 12Ch Digital Resting ECG W/5.7″ LCD Foldable Screen, ECG-1210) was then recorded with the child lying on a couch in supine position, according to a standardised protocol.18 A minimum of five cardiac cycles were recorded per lead. All measurements were done manually with the aid of a magnifying lens according to standard guidelines. The values obtained were interpreted using both NigerianReference Kolawole and Omokhodion19and other reference values used for Caucasian children.Reference Rijnbeek, Witsenburg, Schrama, Hess and Kors20 Various electrocardiographic parameters were used to compute the myocardial ischaemia score as described by Bode-Thomas et al.Reference Bode-Thomas, Hyacinth, Ogunkunle and Omotoso15 (Appendix in the Supplementary Material). These parameters included prolonged PR and corrected QT intervals, >98th percentile for age and sex, as well as ST-T abnormalities (flat and/or inverted T-wave and ST elevation and depression) as defined by Park and Guntheroth.Reference Park and Guntheroth21
Echocardiographic evaluation
Standard two-dimensional, M-mode, and Doppler echocardiograms were performed by the researcher in the supine and left lateral decubitus positions and measurements done according to the American Society of Echocardiography guidelines.Reference Lai, Geva and Shirali22A General Electric Vivid-e echocardiography machine with a high-resolution 5–7.5 MHz sequential transducer and an integrated calculation package was used. All imaging was captured with a simultaneous 3-lead electrocardiographic tracing. Standard parasternal, apical, subcostal, and suprasternal views were recorded. Left ventricular end-diastolic and end-systolic dimensions, septal and left ventricular posterior wall thickness at end diastole and end systole, mitral inflow velocities, left and right ventricular outflow tract velocity time integral (VTILVOT, VTIRVOT), tricuspid and pulmonary valves regurgitation jet velocities (TRV, PRV) were captured. Left ventricular ejection fraction, fractional shortening, and cardiac output were computed by the machine, while pulmonary artery systolic (PASP) and diastolic (PADP) pressures were estimated from the peak tricuspid and pulmonary regurgitation velocities, respectively, using the simplified Bernoulli equation (P = 4V2, where P = pressure, V = peak velocity of regurgitant jet) and the right atrial pressure (obtained from inferior vena cava dimensions and collapsibility index). Mean pulmonary artery pressure (mPAP) was calculated from the formula: mPAP = 2/3 PADP + 1/3 PASP, while pulmonary vascular resistance (PVR)Reference Abbas, Fortuin, Schiller, Appleton, Moreno and Lester23 and systemic vascular resistance (SVR)Reference Porter, Shillcutt and Adams24 were obtained using the equation: PVR = 10 (TRV/VTIRVOT) + 0.16; SVR = Mean Arterial Pressure/Cardiac Index.
The velocity of circumferential fibre shortening and end-systolic wall stress (meridional and circumferential) was calculated using published formulasReference Mortens, Friedberg, Allen, Driscoll, Shaddy and Feltes25 (Appendix in the Supplementary Material). Pulse Wave Doppler Tei index of the left and right ventricles was determined from the ratio of the summation of isovolemic relaxation and contraction times to the ejection time. Mitral and tricuspid annular plane systolic excursion were measured using the standard M-mode technique with the cursor placed at the lateral site of the annulus from the apical four-chamber view and interpreted using published normative valuesReference Koestenberger, Nagel and Ravekes26,Reference Koestenberger, Ravekes and Everett27 All measurements were made online by a single investigator using an average of three cardiac cycles. The images were saved and re-analysed offline by the same researcher to obtain a second measurement.
Serum biochemical analysis
A single sample 5 ml of venous blood was collected into a lithium heparin bottle from the antecubital vein of each patient. The blood samples were centrifuged at 3500 rpm for 15 minutes by the researcher or trained assistant. Specimens for plasma NT-pro BNP and cardiac troponin I were stored at −80°C until analysed using an electrochemiluminescence immunoassay.
Statistical analysis
Mean values of heart rates, blood pressures, and oxygen saturation during crisis and steady states were compared using a paired t-test for variables with normal distribution, while the Shapiro–Wilk test was used for variables not normally distributed. The relationship between myocardial ischaemia score and the variables of pulmonary and systemic circulations was tested using Pearson’s correlation matrix. The chi square test was used to test the differences between categorical variables. Intraobserver reproducibility of echocardiographic measurements was tested according to the method of Bland and Altman. All analyses were performed with Stata 14 software. A p value of less than 0.05 was set as level of statistical significance.
Ethical approval
The study was approved by the Human Research Ethics Committee of University of the Witwatersrand, Johannesburg, South Africa and the Health Research Ethics Committees of University of Abuja and National Hospital, Abuja, Nigeria.
Results
General characteristics
A total of 176 children were recruited, comprising of 92 steady-state patients and 84 patients in crisis. The age at presentation was similar for both groups: 10.4 ± 3.2 years for steady state and 10.5 ± 3.4 years for those in crisis, p = 1.00. The male:female ratio was 1.2:1 for steady state and 1.3:1 for those in crisis. The average steady-state haemoglobin concentration was 7.9 g/dl and 7.7 g/dl, respectively, for patients recruited without crisis and those recruited at the time of crisis, p = 0.98. Similarly, the mean lifetime blood transfusion was comparable in both groups: 1.2 ± 1.7 for patients in steady state and 1.3 ± 1.4 for those in crisis, p = 0.67, while the mean number of blood transfusion in the preceding 1 year was 0.5 ± 0.7 for patients in steady state and 0.5 ± 0.5 for those enrolled during crisis.
Reproducibility assessment
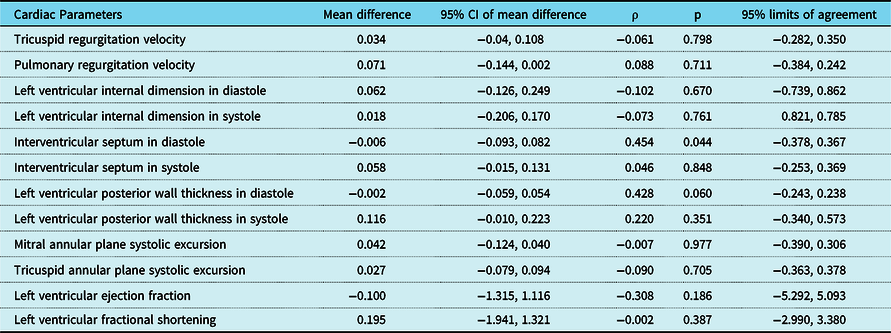
Table 1 shows the results of intraobserver variability in cardiac parameter assessment. The echocardiographic measurements showed minor intraobserver difference between the online and offline measurements. The mean difference in the tricuspid regurgitation velocities, for instance, was 0.034 (CI −0.04 to 0.104) (r = 0.061, p = 0.798) with a 95% limits of agreement of −0.282 to 0.350.
Intraobserver reproducibility of cardiac parameters measurements.

Heart rate and blood pressure changes in crisis
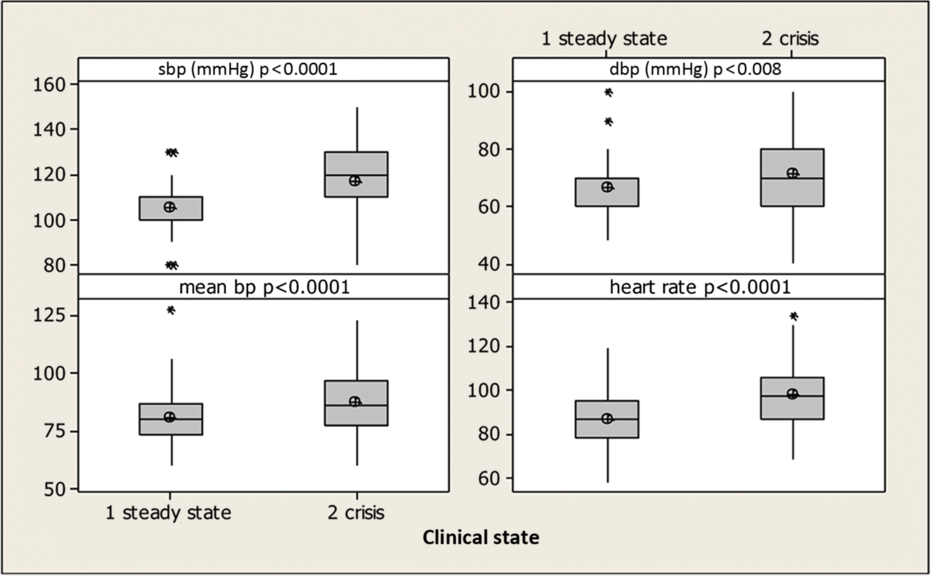
The mean heart rate in patients with crisis (98.1 ± 14.2 bpm) was higher than in those in steady state (86.9 ± 1.4 bpm) (p < 0.01). The blood pressures (systolic, p < 0.01, diastolic, p < 0.01, mean, p < 0.01) were also higher in the crisis group than in the steady-state group (Fig 1). During crisis, 40.2% had a systolic blood pressure greater than the 95th percentile (21.6% of those were higher than the 99 + 5 mmHg percentile). In the steady-state group, markedly elevated blood pressures (>99 + 5 mmHg percentile) were not documented. Only 5.4% had a systolic blood pressure greater than the 95th percentile.
Boxplot of heart rates and blood pressures in sickle cell crisis and in steady state.

Similarly, elevations in the diastolic blood pressure were observed, with 31% of patients recorded to have a diastolic blood pressure greater than the 95th percentile (19.2% of those were greater than the 99 + 5 mmHg percentile) during crisis, while only 9.6% of those in steady state had blood pressure in excess of the 95th percentile. None were greater than the 99th percentile.
Prevalence of conduction abnormalities
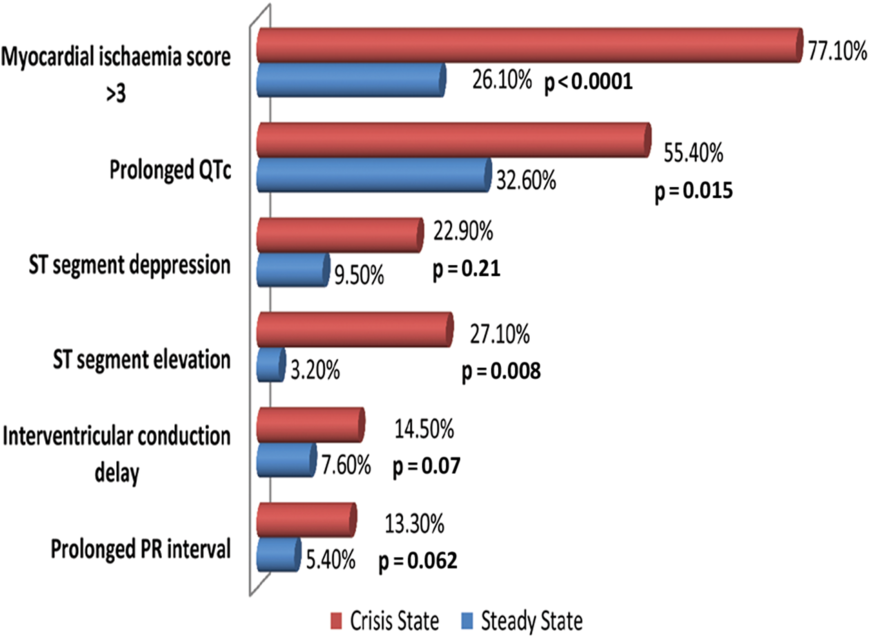
The prevalence of prolonged PR interval (5.4%) and prolonged corrected QT interval (32.6%) during the steady state was about half the prevalence in crisis (13.3% for prolonged PR interval and 55.4% for prolonged corrected QT interval), Figure 2. Sickle cell crisis doubled the prevalence of interventricular conduction delay from 7.6% in the steady-state group to 14.5% in the crisis group.
Influence of sickle cell crisis on the prevalence of prolonged PR and QTc, ST segment changes, and significant myocardial ischaemia scores. p value < 0.05 signifies statistical significance.

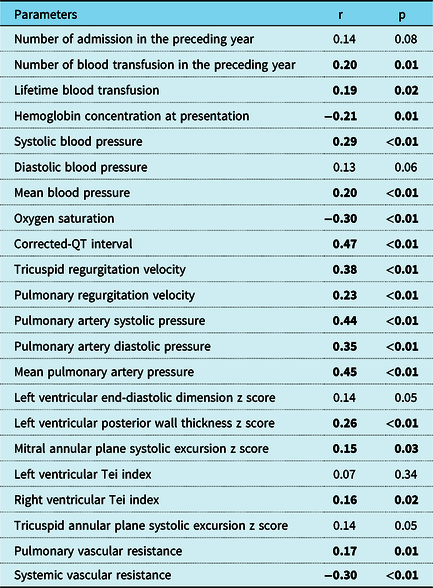
The myocardial ischaemia score (a composite of T-wave abnormalities, ST segment changes, and conduction abnormalities) had a negative correlation with haemoglobin concentration at presentation (r = −0.21, p = 0.01), oxygen saturation (r = −0.30, p < 0.01), and systemic vascular resistance (r = −0.30, p < 0.01), but correlated positively with number of blood transfusion in the preceding year, pulmonary artery pressures, right ventricular Tei index, and left ventricular wall thickness as shown in Table 2. The mean myocardial ischaemia score obtained in patients having crisis (3.14 ± 1.61) was higher than that recorded in patients recruited at steady state (1.97 ± 1.41), p < 0.01. Likewise, those with acute chest syndrome (n = 11) had higher mean ischaemia score than those without acute chest syndrome: 4.4 ± 1.59 versus 3.33 ± 1.28, p = 0.02.The mean N-terminal pro B-type natriuretic peptide was also higher in those with acute chest syndrome than in those without acute chest syndrome: 980.46 ± 1498.92 pg/ml versus 175.30 ± 664.00 pg/ml, p = 0.01.
Correlation of myocardial ischemia score with clinical and echocardiographic parameters.

p value < 0.05 signifies statistical significance.
Echocardiographic changes detected during crisis in the right and left heart
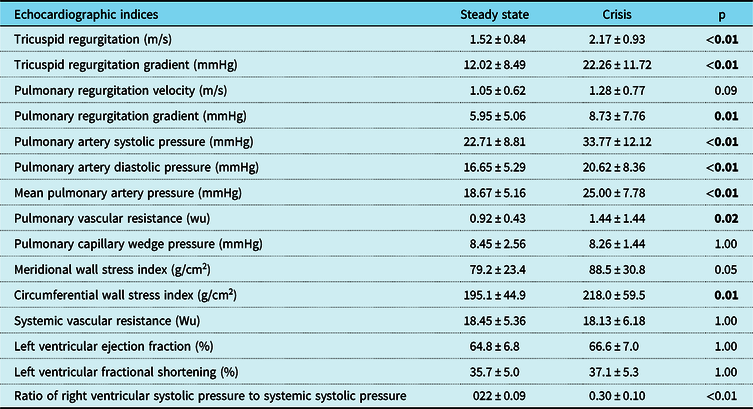
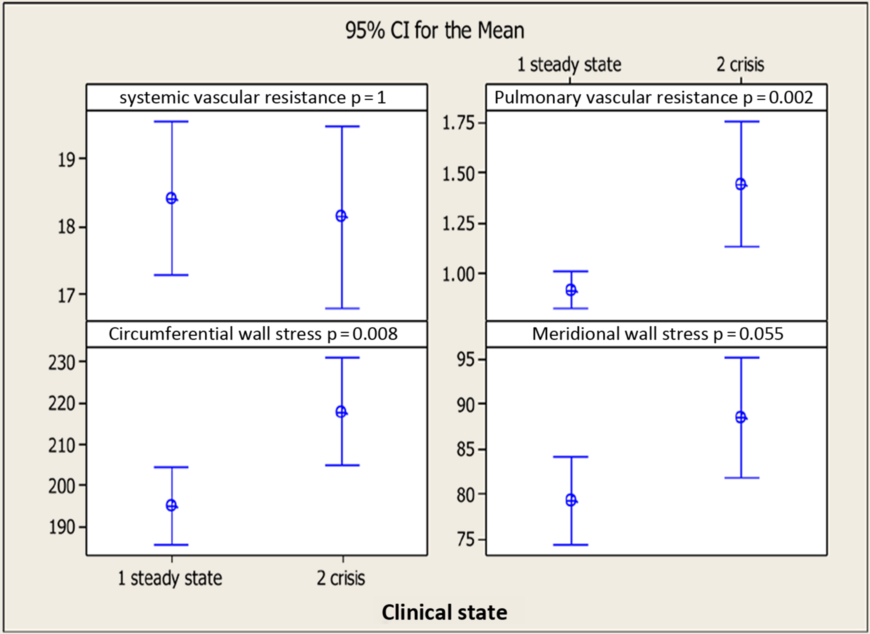
Both tricuspid and pulmonary regurgitation velocities as well as pulmonary artery pressures and pulmonary vascular resistance calculations were elevated during crises. Similarly, the mean circumferential wall stress index in patients having crisis (218.0 ± 59.5 g/cm2) was higher than the value recorded for steady-state patients (195.1 ± 44.9 g/cm2), p = 0.01, but there was no statistically significant difference in the meridional wall stress index in the two groups: 79.2 ± 23.4 g/cm2 (steady state) versus 88.5 ± 30.8 g/cm2 (crisis group), p = 0.05 (Table 3). The left ventricular fractional shortening (35.7 ± 5.0%) and ejection fraction (64.8 ± 6.8%) mean values in steady state were comparable to those obtained in crisis state: 37.1 ± 5.3% and 66.6 ± 7.0%, respectively.
Comparison between echocardiographic parameters of patients in steady state and of those in crisis.

p value < 0.05 signifies statistical significance.
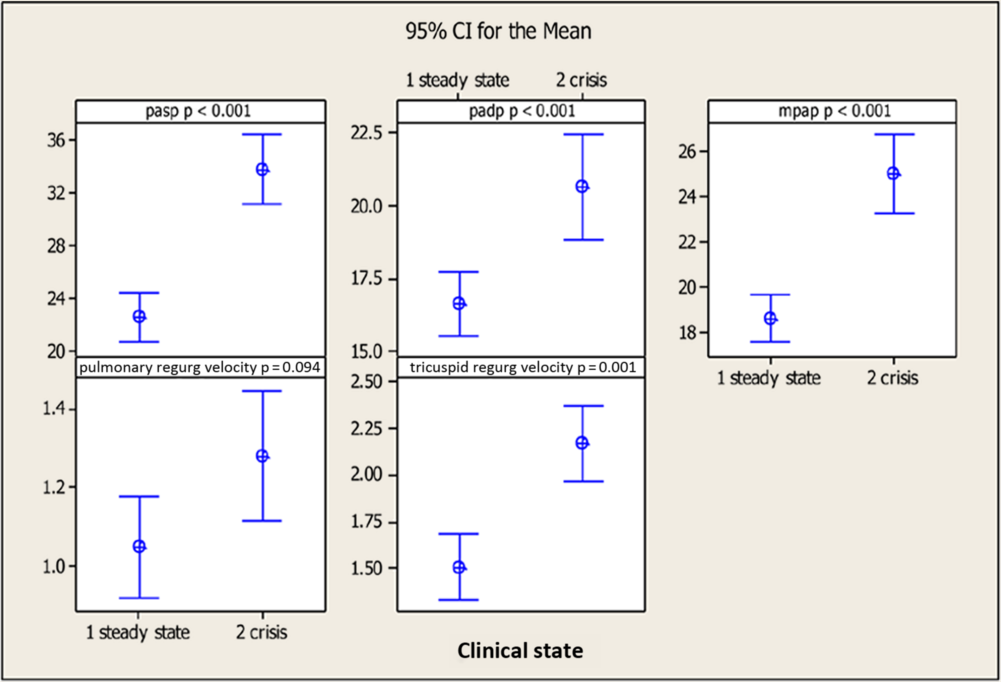
The interval plot of mean of tricuspid regurgitation, pulmonary artery systolic and diastolic pressures shows a significant difference between values documented in the steady state and those in crisis. No significant difference in the mean pulmonary regurgitation velocity was shown between the two groups (Fig 3).
Interval plot of mean of indices of pulmonary hypertension in crisis and in steady-state patients.

Prevalence of ventricular dysfunction and pulmonary hypertension
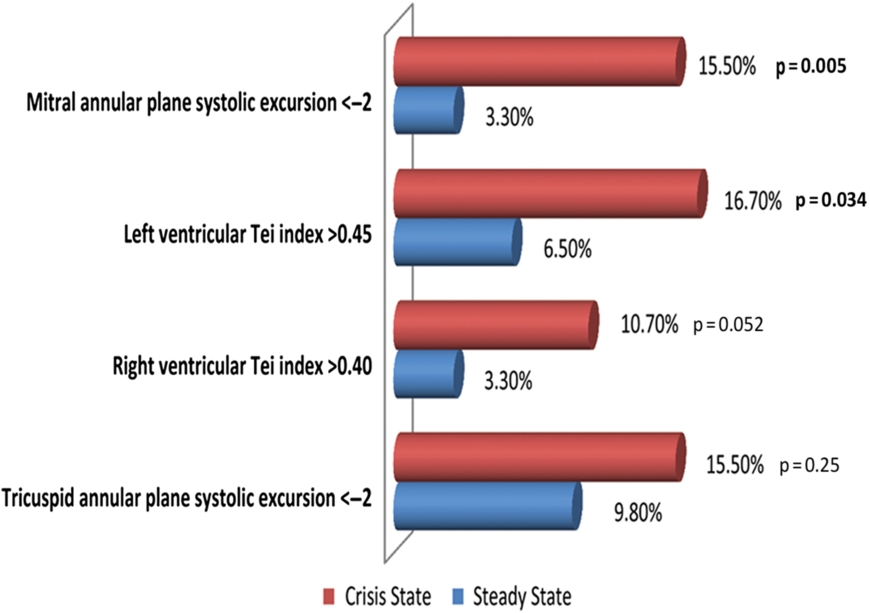
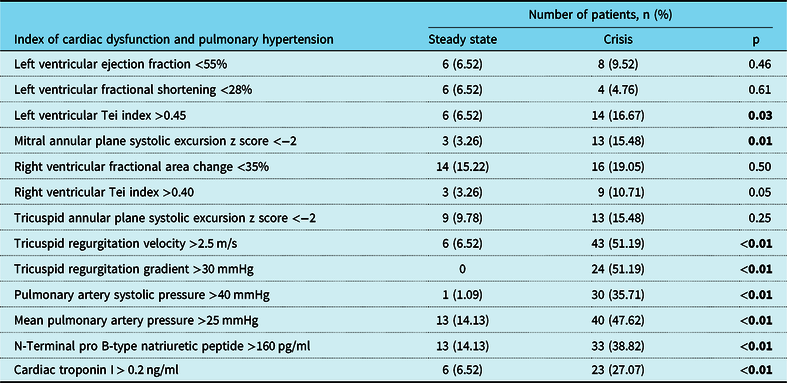
The prevalence of left ventricular dysfunction (left ventricular Tei index >0.45) was 2.5-fold higher in patients having crisis than in patients without crisis: 16.7% versus 6.5%, p = 0.03 (Fig 4 and Table 4). Likewise, the number of children with mitral annular plane systolic excursion z score <−2 was five times higher in the crisis group than in the steady-state group: 13 (15.5 %) versus 3 (3.3%), p = 0.01.
Prevalence of abnormal Tei index and annular plane systolic excursion in crisis and in steady state. p value < 0.05 signifies statistical significance.

Comparison of the prevalence of cardiac dysfunction and pulmonary hypertension in steady state and in crisis.

p valve < 0.05 signifies statistical significance.
The prevalence of right ventricular dysfunction (right ventricular Tei index value >0.4) was three times higher in the crisis group than in the steady-state group (3.3% in steady state versus 10.7% in crisis). This difference, however, fell short of statistical significance, p = 0.05. (Fig 4 and Table 4).
The prevalence of pulmonary hypertension (mean pulmonary artery pressure >25 mmHg) tripled when comparing those in steady state with those in crisis (14.1% versus 47.6%) (Table 4).
The interval plot of systemic vascular resistance, pulmonary vascular resistance, and wall stress index mean values are shown in Figure 5. The interaction test for systemic vascular resistance and meridional wall stress index shows a p value of > 0.05. The interaction test for pulmonary vascular resistance and circumferential wall stress index in steady state and crisis shows a p < 0.01 and 0.01, respectively.
Plot of systemic vascular resistance, pulmonary vascular resistance and wall stress index in steady state and crisis.

Discussion
Sickle cell crisis triggers a cascade of events in the cardiovascular system, including increases in heart rate, blood pressure, electrical and functional abnormalities. In this study, the heart rate was higher in those in crisis compared with those in steady state, by an average of 12 bpm, a finding corroborated by the report of other authors.Reference Koestenberger, Ravekes and Everett27 Many factors in crisis acting independently and/or cumulatively could increase the heart rate including pain, fever, hypoxia, and myocardial ischaemic injury. Tachycardia as a compensatory mechanism can cause an increase in oxygen consumption with a possible worsening of myocardial ischaemia.
Sickle cell patients generally have lower blood pressures than individuals with normal haemoglobin genotype (haemoglobin AA).Reference Johnson and Giorgio28,Reference Hatch, Crowe and Miles29 However, a transient elevation in systemic blood pressures has been documented in sickle cell crisis.Reference Singer, Boghossians, Bevan and Bennett30 An average difference of 14 mmHg in systolic pressures was observed between children in crisis and those in steady state. Of those in crisis, 40.2% had systolic blood pressures greater than the 95th percentile, and 21.6% of those were higher than the 99 + 5 mmHg percentile. In contrast, only 5.4% of children in the steady state were documented to have systolic blood pressures greater than the 95th percentile and none were found to have blood pressures greater than the 99 + 5 mmHg percentile in the present study. Elevations in diastolic blood pressures were also observed, with 31% of those in crisis having diastolic blood pressures greater than the 95th percentile, and 19.2% of those were greater than the 99 + 5 mmHg percentile. A possible explanation for the elevation of blood pressure in sickle cell crisis is the marked increase in total blood volume and cardiac output during crisis.Reference Emst, Weiss, Johnson and Takakuwa31–Reference Maisel, Friedman, Flint, Koshy and Prabhu34 Acute elevations of blood pressures in excess of the 99 + 5 mmHg percentile may alter the regulation of the blood–brain barrier resulting in cerebral hyperperfusion syndromes which manifest with symptoms such as headaches. Furthermore, children with very high blood pressures have been shown to be at-risk for silent strokes and associated memory loss. The same report showed the relative risk of silent stroke in sickle cell disease children to be 1.7 times of those with lower blood pressures.Reference Richards and Tzeng32 Although four patients with crisis in our study presented with overt stroke, the role of blood pressure elevation in their stroke could not be determined. An elevated systemic blood pressure during crisis may be associated with the development of left ventricular dysfunction.Reference Gordeuk, Sachdev, Taylor, Gladwin, Kato and Castro35 Although there is no definitive proof, the elevated blood pressures recorded during crisis could have had a role in the twofold increase in the proportion of children with cardiac dysfunction compared to those in a steady state. Further studies are required to confirm this relationship.
Acute increases in pulmonary artery pressures recorded in the presence of severe vaso-occlusive bone pain crisis and acute chest syndromesReference MekontsoDessap, Leon and Habibi36 are poorly tolerated by adult sickle cell patients.Reference Machado, Kyle Mack and Martyr7 An increase of 10 mmHg in the mean pulmonary artery pressure has been associated with 1.7-times increase in the hazard ratio of death.Reference Castro, Hoque and Brown37 The acute pressure change exerts pressure overload on the right ventricle which could precipitate right ventricular dysfunction. The proportion of patients with high pulmonary artery pressures and right ventricular dysfunction was higher in the crisis than in the steady-state group in this study.
Electrocardiographic evaluations of patients with sickle cell crisis revealed features suggestive of myocardial ischaemia.Reference Bode-Thomas, Hyacinth, Ogunkunle and Omotoso15,Reference Norris, John and Haywood33 In this study, ST segment abnormalities, particularly ST elevation, and prolonged PR and QT intervals were more prevalent during crisis. However, unlike Maisel et al.Reference Maisel, Friedman, Flint, Koshy and Prabhu34 who used 12–24 hour continuous electrocardiographic monitoring, the presence of ventricular arrhythmias in the study patients was not documented, most likely because a single 12-lead electrocardiogram was performed during admission for sickle cell anaemia crisis.
T-wave abnormalities suggestive of myocardial ischaemia (flat T-waves, T-wave inversion in more than two contiguous leads) have been documented in children with sickle cell crisis in a study from Nigeria by Bode-Thomas et al.Reference Bode-Thomas, Hyacinth, Ogunkunle and Omotoso15 The use of the composite myocardial ischaemia score devised by these authors as well as the addition of cardiac biomarkers further increases the sensitivity and specificity of the diagnosis of myocardial ischaemia. The majority of children with sickle cell crisis in the present study (77.1%) fulfilled the Bode-Thomas’ electrocardiographic criteria for myocardial ischaemia. However, the prevalence of myocardial ischaemia was significantly reduced to 40% when elevated myocardial injury biomarkers such as N-terminal pro B-type natriuretic peptides and cardiac troponin I were added as evidence of myocardial injury suggesting the need for caution when using ST-T wave abnormalities alone.
Radionuclide cardiac scans and autopsy resultsReference de Montalembert, Maunoury, Acar, Brouser and Lenoir16 have shown the mechanism of myocardial ischaemia to be due to microvascular occlusion with sickled red blood cells in some patients. The chest pain experienced by certain patients during crisis in the present study may be due to a vaso-occlusive process resulting in myocardial ischaemia. Further evidence of myocardial ischaemia caused by vascular occlusion is the finding of left ventricular wall motion abnormalities by Maisel et al.Reference Maisel, Friedman, Flint, Koshy and Prabhu34 during sickle cell crisis in patients presenting with an acute chest syndrome and severe vaso-occlusive bone pain crisis.
Echocardiographical imaging in the present study showed that the prevalence of left ventricular dysfunction (based on left ventricular Tei index > 0.45 and mitral annular plane systolic excursion z score < −2) was about three times higher in patients having crisis than in those in steady state. Furthermore, right ventricular dysfunction (right ventricular Tei index > 0.4) is more prevalent during a crisis than in the steady state.
The presence of elevated pulmonary artery pressures during a crisis is reflected by the tricuspid regurgitant jet velocity which was higher (mean of 2.2 m/s) in the crisis group than in the steady-state group (mean of 1.52 m/s). Numerous publicationsReference Machado, Kyle Mack and Martyr7–Reference Gladwin and Vichinsky10,Reference Vichinsky, Neumayr and Earles14–Reference de Montalembert, Maunoury, Acar, Brouser and Lenoir16 have shown up to a fourfold increase in mortality and sudden death in patients with elevated pulmonary pressures during a crisis. In the present study, the mean pulmonary artery pressure in patients with sickle cell crisis was higher than those of patients in steady state with 47.6% of those in crisis having a mean pulmonary artery pressure greater than 25 mmHg compared to 14.1% in the steady-state group. One patient who presented with acute chest syndrome in the current study died suddenly during the crisis before a full echocardiographic and electrocardiographic evaluation could be done.
In this study, the authors have identified pertinent cardiovascular changes that may occur during sickle cell crisis to include elevation in blood pressures, subclinical myocardial ischaemia, reduction in systolic performance, and increases in severity of tricuspid regurgitation and hence pulmonary artery pressure.
Conclusions
The present data suggest that sickle cell crisis has negative effects on the cardiovascular system causing elevations in blood pressures, myocardial ischaemia, left ventricular dysfunction, and elevation of pulmonary artery pressures.
Recommendations
A repetition and follow-up of the clinical, biochemical, echocardiographic, and electrocardiographic parameters between crises may provide confirmation of whether outcomes such as sudden death are due to accumulative damage of the myocardium caused by repeated episodes of systemic hypertension versus pulmonary hypertensive events or vaso-occlusive coronary artery disease.
Limitations of study
No follow-up of patients following crises.
No facility to undertake direct intracardiac catheter measurements such as pulmonary artery pressure.
Indirect assessment of pulmonary artery pressures and calculation of pulmonary vascular resistance and other cardiac indices using echocardiographic-acquired parameters.
Acknowledgements
The authors thank the staff of Haematology Unit of University of Abuja Teaching Hospital and National Hospital for their immense support at the time of data collection.
Financial support
This work was supported by Tertiary Education Trust Fund, Nigeria.
Conflict of interest
The authors declared that the research was conducted in the absence of any financial relationship that could be considered a potential source of conflict of interest.
Ethical standards
The authors assert that all procedures contributing to this work comply with the ethical standards of Nigerian Code of Health Research Ethics on human experimentation and with the Helsinki Declaration of 1975 as revised in 2008 and have been approved by the Human Research Ethics Committee of University of the Witwatersrand, Johannesburg, South Africa and the Health Research Ethics Committees of University of Abuja Teaching Hospital and National Hospital, Abuja, Nigeria.
Supplementary material
To view supplementary material for this article, please visit https://doi.org/10.1017/S1047951120000037