I. INTRODUCTION
Iron-oxide nanoparticles have received growing attention owing to their unique electrical, Reference Haque and Arajs1 magnetic, Reference Einaga, Taguchi, Li, Akitsu, Gu, Sugai and Sato2 and catalytic Reference Srivastava, Perkas, Gedanken and Felner3 properties and wide variety of potential applications in various fields, such as electro-optic materials, Reference Miteva and Stoimenova4 sorbents, Reference Toledano and Henrich5 pigments, Reference Schwertmann and Cornell6 and ion exchangers. Reference Apblett, Kuriyavar and Kiran7 Of all forms of iron oxides in soil, goethite (α-FeOOH) is the most abundant and most stable. Reference Grossl, Eick, Sparks, Goldberg and Ainsworth8 It has double bonds and possesses the capability of incorporating a range of environmentally important oxy-anions and cations in its complex matrix. Reference Jaiswal, Banerjee, Mani and Chattopadhyaya9 Hence, it shows strong affinity for many contaminants such as heavy-metal ions and organic pollutants, becoming the most commonly used adsorbent for wastewater remediation. Reference Nassar10–Reference Hristovski, Baumgardner and Westerhoff13 Due to this nature of goethite, considerable amount of researches have been developed to synthesize goethite nanoparticles for heavy metals Reference Zhao, Geng, Wang, Gu and Gao14–Reference Trivedi, Axe and Dyer18 and nutrient Reference Gao and Mucci19,Reference Xu, Christodoulatos and Braida20 adsorption.
As is well known, the physical and chemical properties of iron oxide nanomaterials are closely related to their phase composition, size, morphology, structure, and surface properties. Reference Yang, Hu, Nie and Qu21 However, these properties of synthesized functional materials strongly depend on the synthetic methods and the surface modification methods. Reference Kosmulski, Durand-Vidal, Maczka and Rosenholm22–Reference Choi, Jung, Cho, Ryu, Yang and Baek26 To improve the physical chemistry properties of α-FeOOH, several kinds of transition metal ions, Reference Silva, Mello, Gasparon, Abrahão, Ciminelli and Jong27–Reference Tufo, Sileo and Morando31 such as Cu, Al, Mn, Co, and Mg, or organic compounds, Reference Wei, Qiao and Nan32–Reference Xie, Meng, Wu, Zhang and Kong35 such as surfactants (cetyltrimethylammonium bromide, etc.), complexing agents (ethylenediaminetetraacetic acid, etc.), and polymers (poly(ethylene oxide)-block-poly(propylene oxide)-block-poly(ethylene oxide), etc.,) have been used as structure controllers or surface modifiers for modified α-FeOOH preparation.
Surfactants have been frequently used to control the shape of synthesized nanomaterials in the hydrothermal method. Reference Rădiţoiu, Diamandescu, Cosmin Corobea, Rădiţoiu, Popescu-Pogrion and Andi Nicolae33,Reference Yuan and Su36,Reference Yuan, Ren and Su37 This is because the addition of the surfactants can influence hydrolysis of Fe3+ ions to control the size, morphology, and chemical structure of α-FeOOH nanoparticles in the preparation process. Reference Ristić, Musić and Godec38 Meanwhile, surfactants can be used as surface modifiers to prepare surfactant-modified adsorbents by two-step preparation, Reference Sun, Lin and Zhan39–Reference Nadeem, Shabbir, Abdullah, Shah and McKay42 which are not only superior in terms of removal efficiency than the conventional adsorbents, but also enhanced in terms of selective adsorption. Reference Nadeem, Mahmood, Shahid, Shah, Khalid and McKay43,Reference Armagan, Turan and Karadag44 However, surfactant-modification of α-FeOOH nanoparticles for improving the adsorption of organic pollutants has rarely been reported.
Methylene blue (MB) has been widely used as a model for the adsorption test of organic dyes from aqueous solutions, and various adsorbents have been reported for its removal. Reference Fan, Luo, Li, Lu, Qiu and Sun45–Reference Zhang, Zhang, Wu, Zhang, Zeng and Zhou47 In this study, we evaluated the feasibility of using anionic surfactant sodium dodecyl sulfate (SDS) as a structure controller and surface modifier for one-step hydrothermal preparation of surfactant-modified α-FeOOH nanorods. The performance of the prepared surfactant-modified α-FeOOH for cationic dye MB removal was evaluated. The effect of SDS on the product morphology was studied in detail. Meanwhile, the adsorption behavior of MB onto the surfactant-modified α-FeOOH nanorods was investigated, with the main adsorption mechanisms involved.
II. MATERIALS AND METHODS
A. Materials
Ferric chloride (FeCl3·6H2O) and potassium hydroxide (KOH) were procured from Nanjing Ningshi Chemical Reagent Co., Ltd. (Nanjing, China). SDS (C12H25NaO4S) was procured from Shanghai Lingfeng Chemical Reagent Co., Ltd. (Shanghai, China). MB (C16H18N3ClS·3H2O) was obtained from Shanghai Aisansi Chemical Reagent Co., Ltd. (Shanghai, China). All other reagents used in this study were of analytical grade and were used without further purification.
B. Synthesis and characterization of the samples
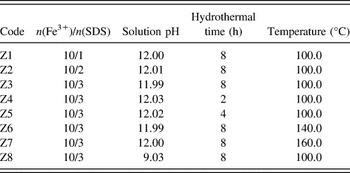
In a typical synthesis, two solutions were prepared by dissolving 10 mmol of ferric chloride (FeCl3·6H2O) and 3 mmol of SDS into 10 mL of deionized water, respectively. Later on, the two solutions were mixed under vigorous stirring. Afterward, 10 mL of 1.0 mol/L KOH was added into the mixed solution with continuous stirring for 30 min, and then the mixture was subsequently transferred into a stainless Teflon lined autoclave, and distilled water was then added to a final volume of 80 mL, heated at 100 °C for 8 h. Afterward, the autoclave was cooled to room temperature, and the resulting yellow solid precipitation was collected by centrifugation and washed 5 times with distilled water and absolute ethanol to remove the loosely attached SDS, and dried at 60 °C in an air oven for 24 h, ground by a mortar, passed through a 0.35 mm sieve and then finally stored in a desiccator over silica gel for further use. Table I gives the synthesized conditions of α-FeOOH samples.
The synthesized conditions of α-FeOOH samples.

The physicochemical properties of synthetic samples were characterized. The crystalline form of the samples was identified by x-ray diffraction (XRD) using a Rigaku D8 power XRD meter (Tokyo, Japan) with Cu Kα (λ = 1.5405 Å) radiation operating at 40 kV and 40 mA. The scanning rate of 0.02°/s was applied to record the pattern in the 2θ range of 10–80°. The size and morphology of the products were examined by transmission electron microscopy (TEM, JEOL JSM-2010, Tokyo, Japan), which was equipped with a LaB6 filament as an electron source and operated at 200 kV with 1.9 Å point-to-point resolution. Specimens for TEM were ultrasonically dispersed in 1 mL of ethanol. A small drop of the suspended solution was placed onto a porous carbon film supported on a TEM nickel grid and was dried in air before observation. Infrared spectrum measurements were performed on a BOMEM MB154S type infrared spectrometer, with scanning from 4000 to 490 cm−1 by using KBr pellets under ambient temperature. Pellets were prepared with 13 mm KBr die set by compressing an intimate mixture obtained by grinding 1 mg of the substance in 100 mg of KBr with mortar and pestle and applying an optimum pressure of 9 ton using a 15 ton hydraulic pellet pressure (Kimaya Engineers, Thane, India). While preparing the pellets, necessary precautions were taken to avoid moisture. The BET surface area (S BET) of the samples of α-FeOOH was estimated by N2 adsorption–desorption method at 77 K using a Micromeritics ASAP-2020 surface area analyzer. Before analysis, the samples were degassed overnight at 50 °C under a nitrogen (N2) gas flow. The specific area was calculated using the BET equation. Potentiometric titration measurement was conducted with an automatic titrator (LEI-CI ZD-2, Shanghai, China). 0.1 g of α-FeOOH was added to a conical flask containing 50 mL of 0.1 M NaNO3 as background ionic strength. The solution was shaken for 24 h on a shaker. The titration was carried out using 0.05 M NaOH and 0.05 M HCl solutions.
C. MB adsorption experiments
Adsorption experiments were carried out in 250 mL Erlenmeyer flasks with 100 mL of MB solutions on a thermostated shaker (150 rpm). The pH of the solutions was gradually adjusted by adding 0.1 M HCl solution. An agitation was provided for 60 min, which was more than sufficient to reach equilibrium. Samples (5 mL aliquot) were collected at designated time intervals, filtered through 0.45 μm organic membrane syringe filters, and analyzed for color removal by measuring absorbance at the maximum absorbance wave length of MB (λ = 664 nm) using a Beijing Ruili UV-9600 spectrophotometer (Beijing, China). A previously constructed calibration curve was used to relate the optical density measurements to MB concentration in the samples. In this paper, the effect of different pH on the MB adsorption was investigated, while all other factors were kept constant at MB = 200 mg/L, α-FeOOH = 0.5 g/L, contact time = 2 h, T = 30 °C, and shaking speed = 150 rpm.
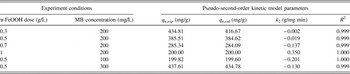
The kinetic studies were carried out at different initial MB concentrations, mass of adsorbent on MB adsorption, and the experimental conditions are illustrated in Table II. After the equilibrium time of 120 min, the absorbance of MB in the equilibrium solution was determined.
Experimental conditions of the various kinetic adsorption experiments for the removal of MB onto α-FeOOH at constant volume of dye solution (100 mL).

III. RESULTS AND DISCUSSION
A. Characterizations of the as-synthesized samples
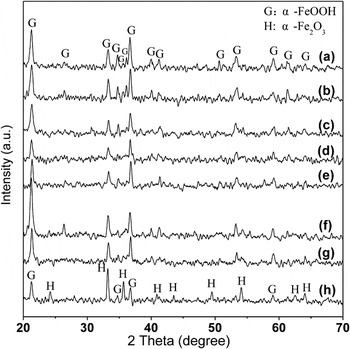
Figure 1 shows the XRD patterns of the as-synthesized samples under different synthesized conditions. The JCPDS PDF database was used for the phase identification. Compared with the standard card JCPDS No. 29-0713, all of the strong sharp diffraction peaks can be indexed as the pure orthorhombic phase of α-FeOOH with cell constants a = 4.608 Å, b = 9.956 Å, and c = 3.021 Å; no other impurity phases have been found in the samples Z1–Z7, Reference Wei, Qiao and Nan32 as shown in Figs. 1(a)–1(g). Moreover, it was found that strong sharp diffraction peaks of α-Fe2O3 (PDF#33-0664) were detected in Z8 Reference Wei, Qiao and Nan32,Reference An, Zhang and Pan48 as shown in Fig. 1(h). Figures 1(a)–1(c) (samples Z1–Z3) showed that the intensities of diffraction peaks of α-FeOOH did not change obviously with the increase in SDS ratio. The results showed that the increase in SDS dosage in examined range had no significant influence on the crystallinity of α-FeOOH. From samples Z3–Z7 [Figs. 1(c)–1(g)], it could be seen that both hydrothermal time and hydrothermal temperature were important factors influencing the crystallinity. When the pH was adjusted to 9, new XRD peaks corresponding to α-Fe2O3 appeared, indicating the formation of a mixture of phases: α-FeOOH + α-Fe2O3.
XRD patterns of samples: (a) Z1, (b) Z2, (c) Z3, (d) Z4, (e) Z5, (f) Z6, (g) Z7, and (h) Z8.

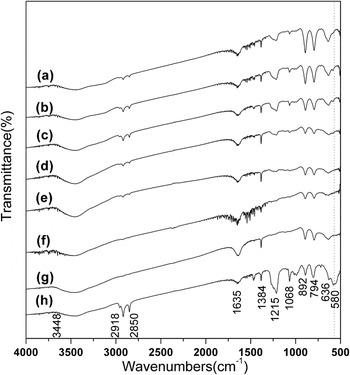
To further characterize the as-synthesized samples, Fourier transform infrared spectroscopy (FTIR) spectra of the final samples were recorded as shown in Fig. 2. The broad absorption band at 3448 cm−1 was due to the stretching modes of surface H2O molecules or to the envelope of hydrogen-bonded surface OH groups. Reference Jaiswal, Banerjee, Mani and Chattopadhyaya9,Reference Krehula and Musić49 The IR absorption band at 1635 cm−1 was due to the bending vibrations of H2O molecules, while the bands at 1384, 892, and 794 cm−1 were due to Fe–O–H bending vibrations. The band at 636 cm−1 was attributed to Fe–O stretching vibrations, as was reported elsewhere. Reference Ou, Xu, Ren, Hou and Han50–Reference Krehula, Popović and Musić52 The FTIR spectra of samples Z1–Z7, as shown in Figs. 2(a)–2(g) demonstrated that the as-obtained samples were α-FeOOH. When the pH was decreased to ∼9, the absorption band at 580 cm−1, which was assigned to Fe–O vibrations of the α-Fe2O3, Reference Wei, Qiao and Nan32,Reference Krehula and Musić53 was found in sample Z8 as shown in Fig. 2(h). This IR absorption peak was not found at the same position in Figs. 2(a)–2(g), and it could be concluded that the product prepared at the pH value of ∼9 was composed of α-FeOOH and α-Fe2O3. These results were in good agreement with those obtained by XRD patterns. Meanwhile, the bands situated at 2918 and 2850 cm−1 were ascribed to methylene symmetric and asymmetric stretching vibrations, and the peak at 1215 cm−1 was attributed to –S=O deformation vibration for the presence of SDS. Reference Rădiţoiu, Diamandescu, Cosmin Corobea, Rădiţoiu, Popescu-Pogrion and Andi Nicolae33 This result confirmed that SDS was on the surface of goethite particles.
The FTIR spectra of samples: (a) Z1, (b) Z2, (c) Z3, (d) Z4, (e) Z5, (f) Z6, (g) Z7, and (h) Z8.

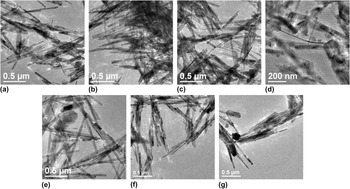
The morphology and size of the as-prepared products were identified by TEM, as shown in Fig. 3. It was found that well-structured acicular-like or rod-shaped crystals clearly existed in samples Z1–Z7 (except Z4). From the TEM images of samples Z1–Z3 [Figs. 3(a)–3(c)], it could be inferred that the SDS ratio significantly affected the diameter of the as-prepared products. With the increase in SDS dosage, the samples were tended to form uniform rod-shaped crystals with an average diameter of ∼36 nm and average length with ∼700 nm, as shown in Figs. 3(a)–3(c). The TEM images of samples Z3–Z5 indicated that hydrothermal time affected the formation processes of the α-FeOOH nanoparticles. When the reaction time was controlled at 2 h, a small amount of α-FeOOH nanowires and nanorods with ill-defined morphology were formed in sample Z4, as shown in Fig. 3(d). As the reaction time was increased to 4 h, vast well-structured nanorods were gradually obtained with an average diameter of ∼45 nm and a length of 450 nm–1.1 μm, as shown in Fig. 3(e). Upon prolonging the reaction time to 8 h, uniform nanorods were produced with an average diameter of ∼36 nm and average length of ∼700 nm, as shown in Fig. 3(c). To understand the influence of the reaction temperature on the morphology of α-FeOOH, the reaction temperatures were increased from 100 to 140 and 160 °C (corresponding to Z3, Z6, and Z7, respectively) without changing other experimental conditions as was given in the typical synthesis process. The TEM images of Z6 [Fig. 3(f)] showed that sample Z6 was a typical rod-like α-FeOOH with an average length of ∼790 nm and a mean diameter of ∼25 nm. The size of the sample synthesized at 140 °C was smaller than that obtained at 100 °C, because free Fe3+ dissociated from the complex increased with the increase in temperature. The nuclear number became higher with the increase in temperature, so that the α-FeOOH nanorods prepared at 140 °C were smaller than those obtained at 100 °C. Reference Wei, Qiao and Nan32 When the temperature rose to 160 °C, nanorods with an average diameter of ∼30 nm and a length of ∼730 nm and irregular nanostructures were produced, as shown in Fig. 3(g).
TEM images of samples: (a) Z1, (b) Z2, (c) Z3, (d) Z4, (e) Z5, (f) Z6, and (g) Z7.

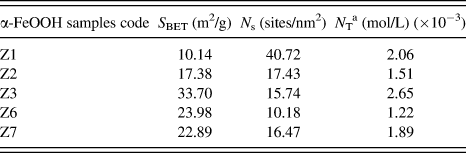
To further investigate the surface properties of the synthesized samples, the analyses of BET surface area (S BET) and potentiometric titration were conducted. The potentiometric titration was used to estimate the site-densities (N s) for α-FeOOH nanorods. The site-density, N s, (sites/nm2), determined the maximum concentration of adsorbed species, to some extent. To determine the N s of the dispersed α-FeOOH, the Gran's functions were used Reference Mayant, Grambow, Abdelouas, Ribet and Leclercq54,Reference Shao, Xu, Wang, Fang, Wu, Dong and Wang55 :
 $${G_a} = ({V_{{\rm{in}}}} + {V_{{\rm{added}}}}) \times {10^{ - {\rm{pH}}}}\quad {\rm{for}}\;\,{\rm{pH}} \,\lt\, 7.0\quad ,$$
 $$\!\!\!\!{G_b} = ({V_{{\rm{in}}}} + {V_{{\rm{added}}}}) \times {10^{{\rm{pH + }}\log {K_{\rm{w}}}}}\quad {\rm{for}}\;\,{\rm{pH}}\, \gt\, 7.0\quad ,$$
where V in is the initial volume (50 mL) and V added is the added volume in the reactor at the considered pH. K w is the ionic product of water at a given temperature at a given ionic strength. For the batch titration, log K w is considered to be −13.93 (T = 25.0 °C), according to PHREEQC calculations for these respective temperatures. The plot of the Gran's function versus the added volume of titrant can be fitted by two straight lines that cross the X-axis at V e1 and V e2. The N s is then calculated according to Reference Mayant, Grambow, Abdelouas, Ribet and Leclercq54 :
 $${N_{\rm{s}}} = {{{C_{{\rm{titrant}}}} \times ({V_{{\rm{e2}}}} - {V_{{\rm{e1}}}}) \times {N_{\rm{A}}}} \over {m \times S \times {{10}^{18}}}}\quad ,$$
where C titrant is the concentration of the titrant solution (0.05 mL), N A is Avogadro's number, m is the α-FeOOH mass (g), and S is its specific surface area, S BET, (m2/g).
The total number of sites, N T (mol/L), is related to the site-density by the following equation Reference Sahai and Sverjensky56 :
 $${N_{\rm{T}}} = {N_{\rm{s}}} \times A \times {C_{\rm{s}}} \times {1 \over {{N_{\rm{A}}}}} \times {10^{18}}\quad ,$$
where A is the specific surface area (m2/g) of the mineral, C s is the concentration (g/L) of solid mineral in the aqueous dispersion, N A is Avogadro's number, and the factor 1018 converts nm2 to m2. The potentiometric titration was used to estimate the site-densities (N s) for α-FeOOH nanorods. Table III shows the surface properties of synthesized α-FeOOH nanorods. The result revealed that the increase of SDS ratio resulted in an increase of S BET. Hence, we could conclude that the Fe3+/SDS molar ratio had an important role in the S BET of the samples. The N s value of each prepared sample was close to the previous research. Reference Yates, Grieser, Cooper and Healy57,Reference Rustad, Felmy and Hay58
Surface properties of synthesized α-FeOOH.

a N T is calculated by C s = 0.5 g/L.
B. Adsorption behavior of MB on synthetic α-FeOOH samples
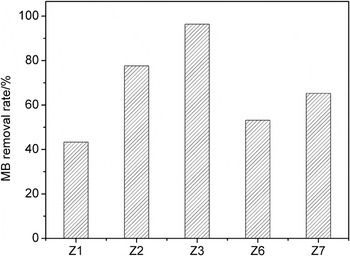
The characteristics of pollutant sorption are closely related to the physical and chemical properties of adsorbents. The results of comparison experiments of MB adsorption onto different as-prepared α-FeOOH samples are shown in Fig. 4. It could be seen that the MB removal rates on samples Z1, Z2, Z3, Z6, and Z7 were 43.36, 77.60, 96.38, 53.16, and 65.26%, respectively. This could be explained by the fact that the S BET and N T influenced the adsorption property of MB on α-FeOOH nanorod. The maximum S BET and N T of sample Z3 resulted in the most available sites. So sample Z3 was considered as an optimum adsorbent and was adopted for the next optimization process.
Comparison of MB adsorption on different as-prepared α-FeOOH samples. (Experimental conditions: MB = 200 mg/L, α-FeOOH = 0.5 g/L, pH = 5, contact time = 2 h, T = 30 °C, and shaking speed = 150 rpm.)

C. Effect of MB solution pH
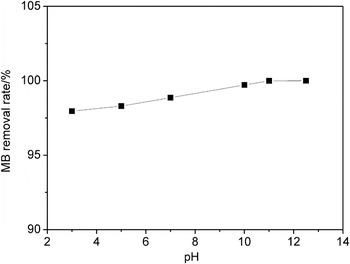
α-FeOOH can adsorb MB molecules from aqueous solution readily. It was found that α-FeOOH changed into blue color within several minutes when α-FeOOH particles were dispersed into MB solution. The effect of solution pH on MB adsorption onto α-FeOOH was studied, and the results were illustrated in Fig. 5. It could be seen that the MB removal rates could reach more than 95% at all pH range examined. However, no significant MB removal increased with increasing pH from 3 to 12.
Effect of solution pH on the adsorption of MB onto α-FeOOH. (Experimental conditions: MB = 200 mg/L, α-FeOOH = 0.5 g/L, contact time = 2 h, T = 30 °C, and shaking speed = 150 rpm.)

D. Effects of α-FeOOH dosage and initial MB concentration
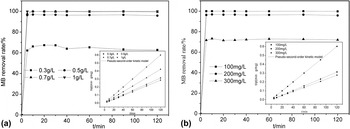
Figure 6 shows the effects of α-FeOOH dose and initial MB concentration on the removal rate. In these conducted experiments, an increase in α-FeOOH dosage from 0.3 to 0.7 g/L increased the adsorption ratio of MB from 62% to a remarkably high 100% [Fig. 6(a)]. The increase in the adsorption efficiency could be explained by the increase in the surface sites available for adsorption. However, no significant increase in adsorption was observed after increasing the loading to 1 g/L. This could be attributed to the adequate available surface sites for adsorbing MB. 96% of MB could be removed from the solution at pH 5, initial MB concentration 200 mg/L, α-FeOOH dosage 0.5 g/L, and temperature 30 °C. The adsorption capacity was as high as 385 mg/g. The adsorbent dosage of 0.5 g/L was considered optimum and was adopted for the next optimization process.
Effect of (a) α-FeOOH dose, (b) initial MB concentration, and adsorption time of MB on α-FeOOH. The pseudo-second-order kinetics linear fitting plot for adsorption of MB on α-FeOOH at different α-FeOOH dose and initial MB concentration are depicted in the inset figures. (Other conditions: MB = 200 mg/L, α-FeOOH = 0.5 g/L, pH = 5, contact time = 2 h, T = 30 °C, and shaking speed = 150 rpm.)

Figure 6(b) shows the adsorption of MB on α-FeOOH at initial concentrations of 100, 200, and 300 mg/L. The results showed that the MB was completely removed at an initial concentration of 100 mg/L, and when the initial MB concentration was increased to 200 and 300 mg/L, MB adsorption decreased to 96% and 71%, respectively. It was evident that the initial MB concentration played a significant role in the adsorption process.
E. Adsorption kinetics
Adsorption kinetics of the MB on α-FeOOH are shown in Fig. 6. As shown, the MB adsorption was rapid and independent of the initial concentration. For three initial concentrations, adsorption equilibrium was reached within ∼10 min. The fast adsorption at the initial stage might be due to the higher driving force, resulting in fast transfer of MB molecules to the surface of α-FeOOH particles. In addition, the availability of the uncovered surface area and the remaining active sites on the adsorbent were also significant for the fast adsorption.
The pseudo-second-order model is used to analyze the kinetics of MB adsorption on α-FeOOH using different α-FeOOH dose and initial MB concentration, which can be represented by the following equation Reference Vučurović, Razmovski and Tekić59,Reference Ma, Jia, Jing, Yao and Sun60 :
 $${t \over {{q_t}}} = {1 \over {{k_2}q_{\rm{e}}^2}} + {1 \over {{q_{\rm{e}}}}}t\quad ,$$
where k 2 (g/mg min) is the rate constant of the pseudo-second-order equation, q e and q t (mg/g) are the uptake of MB at equilibrium and at time t (min), respectively. The linear fitting plot for adsorption of MB on α-FeOOH at different α-FeOOH dose and initial MB concentration is shown in the inset figures of Figs. 6(a) and 6(b). It could be seen that the experimental data well fitted with the pseudo-second-order model, and the kinetic parameters are calculated and given in Table IV. There was good agreement between the experimental adsorption capacity values (q e,exp) and the calculated adsorption capacity values (q e,cal), with the correlation coefficient (R 2) >99% for adsorption. This suggested that the adsorption of MB on α-FeOOH followed second-order kinetics. The high adsorption rate of the MB onto α-FeOOH nanoparticles might have resulted from not only the fast electrostatic and/or complexation reaction between the MB and α-FeOOH nanoparticles, but also the low diffusion resistance of MB onto the nanoscale α-FeOOH particles. The k 2 had negative value, illustrating that MB desorption happened in this process.
The pseudo-second-order kinetic model parameters for MB adsorption at different α-FeOOH dose and initial MB concentration.

F. Adsorption isotherms
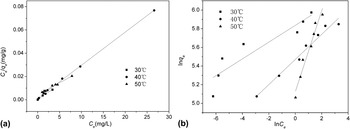
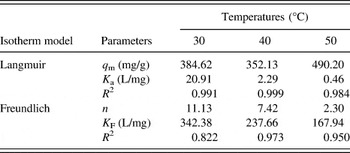
To describe the adsorption of MB on α-FeOOH at different temperatures (30, 40, and 50 °C), Langmuir and Freundlich isotherm model were used to fit the data obtained for MB adsorption on α-FeOOH. The Langmuir and Freundlich equation can be represented by Eqs. (6) and (7) Reference Zhang, Zhang, Wu, Zhang, Zeng and Zhou47 :
 $${{{C_{\rm{e}}}} \over {{q_{\rm{e}}}}} = {1 \over {{q_{\rm{m}}}}}{C_{\rm{e}}} + {1 \over {{K_{\rm{a}}}{q_{\rm{m}}}}}\quad ,$$
 $$\ln \left( {{q_{\rm{e}}}} \right) = \ln \left( {{K_{\rm{F}}}} \right) + {1 \over n}\ln \left( {{C_{\rm{e}}}} \right)\quad ,$$
where C e (mg/L) is the equilibrium concentration of MB in solution, q e (mg/g) is the adsorption capacity in equilibrium, q m (mg/g) is the maximum adsorption capacity, K a and K F (L/mg) are the Langmuir and Freundlich adsorption constants, respectively, and n (dimensionless) is the Freundlich exponential coefficient. Figure 7 shows the linear Langmuir and Freundlich isotherm plots.
Linearized (a) Langmuir and (b) Freundlich adsorption isotherms for the MB adsorption by α-FeOOH at different temperatures. (Other conditions: MB = 200 mg/L, α-FeOOH = 0.5 g/L, pH = 5, contact time = 2 h, and shaking speed = 150 rpm.)

The Langmuir and Freundlich isotherm parameters for MB adsorption are calculated and given in Table V. The results of Table V show that the Langmuir isotherm correlated the data with R 2 value higher than that of Freundlich isotherm, which indicated that the Langmuir model showed better fit than Freundlich model for the adsorption data.
Isotherm parameters for MB adsorption onto α-FeOOH at different temperatures.

G. Adsorption mechanism
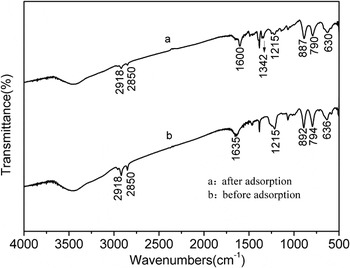
Understanding the mechanisms of the solute adsorption onto the α-FeOOH surfaces is essential for the removal of solute from aqueous solution. FTIR spectroscopy is a useful tool for studying the interaction between an adsorbate and the active groups on the surface of the adsorbent. The FTIR spectra of the α-FeOOH before and after MB adsorption are shown in Fig. 8. By comparing the FTIR spectra of α-FeOOH before and after MB adsorption, it could be found that the intensity of the bands at 2918, 2850, and 1215 cm−1, which was attributed to the presence of SDS, becomes slightly weaker. The result could be explained by the fact that MB adsorption process occurred through electrostatic attraction between SDS of α-FeOOH surface and MB. In addition, the band at 1635 cm−1, characteristic for water molecules was diminished due to the MB adsorption onto the goethite surface and consequently to the hydrophobic character gained by the modified particles. Meanwhile, the bands at 1600 and 1342 cm−1 appeared in the case of goethite modified particles, due to –C=C–, –C=N–, and –C–N– stretching vibrations of the MB molecules adsorbed onto the surface. Reference Khraisheh, Al-Ghouti, Allen and Ahmad61,Reference Al-Ghouti, Li, Salamh, Al-Laqtah, Walker and Ahmad62 The characteristic bands at 892, 794, and 636 cm−1, which were assigned to Fe–O–H bending vibrations and Fe–O stretching vibrations in FeOOH, shift 5, 4, and 6 cm−1 to lower wave number, respectively. This might be attributed to the formation of surface hydrogen bonds between the hydrogen atoms of the Fe–O–H groups and the nitrogen atoms of MB or by electrostatic interaction induced by the resonance structure of MB. Reference Al-Ghouti, Li, Salamh, Al-Laqtah, Walker and Ahmad62
The FTIR spectra of the α-FeOOH before and after MB adsorption.

IV. CONCLUSIONS
The α-FeOOH nanorods were successfully synthesized via a surfactant SDS assisted one-step hydrothermal synthetic route at mild conditions. The effects of the SDS ratio, reaction temperature, pH, and the hydrothermal time on the morphologies and crystalline phases of the resulting products were investigated by XRD, TEM, FTIR, BET, and potentiometric titration. α-FeOOH nanorods obtained under operating conditions of the hydrothermal time 8 h, the molar ratio of Fe3+/SDS 10/3 and pH 12, exhibited the maximum adsorptive capability (96% for MB). Moreover, the effects of various process parameters, i.e., solution pH, initial MB concentration, α-FeOOH loading on the MB adsorption onto α-FeOOH, were studied. The adsorption ratio and capacity of the MB were found to be 96% and 385 mg/g, respectively. Adsorption kinetics was well described by the pseudo-second order kinetic equation with correlation coefficients of over 0.99. The isothermic data fitted well with the Langmuir model. FTIR spectrum was used to investigate the changes of the α-FeOOH before and after adsorption. The characteristic peak-change of SDS indicated that SDS obviously influenced adsorption processes of MB onto α-FeOOH. The results obtained showed that SDS-modified α-FeOOH nanorods adsorbent is promising for the removal of organic pollutant (MB) from wastewater.