INTRODUCTION
Intestinal schistosomiasis is caused by infection with the trematode worm Schistosoma mansoni, and is widely distributed throughout sub-Saharan Africa, with several tens of millions of people infected (Stothard et al. Reference Stothard, Chitsulo, Kristensen and Utzinger2009a; Utzinger et al. Reference Utzinger, Raso, Brooker, De Savigny, Tanner, Ornbjerg, Singer and N'Goran2009). In East Africa, a combination of appropriate climatic conditions, permissive snail hosts and aquatic environments polluted by faecal contamination make the shoreline of Lake Victoria a hot-spot for disease transmission. For example, recent surveys have shown that infection prevalence among schoolchildren can reach 100% in some areas, but distribution of the disease is often heterogeneous as it is influenced by place-specific factors which include local environmental, behavioural and biological determinants (Brooker et al. Reference Brooker, Kabatereine, Gyapong, Stothard and Utzinger2009; Standley et al. Reference Standley, Adriko, Alinaitwe, Kazibwe, Kabatereine and Stothard2009).
In terms of disease control, although biotic factors such as snail abundance were targeted in the past, recent interventions have focused exclusively on chemotherapy using praziquantel (PZQ). Indeed, mass drug administration programmes, as organized at a national governmental level, are ongoing throughout East Africa with Uganda implementing since 2003 (Kabatereine et al. Reference Kabatereine, Fleming, Nyandindi, Mwanza and Blair2006). Despite wide-spread roll-out of treatment throughout the past 10 years in some regions, other areas remain under-surveyed for baseline levels of prevalence, and localities which are receiving PZQ may lack on-going monitoring of the performance of the treatment regime (Standley et al. Reference Standley, Adriko, Alinaitwe, Kazibwe, Kabatereine and Stothard2009). Moreover, such surveillance rarely looks further than measuring point prevalence and intensity of infection, even though molecular tools could potentially inform, with greater accuracy, data regarding re-infection rates, emerging resistance to PZQ, and theories of local snail-parasite compatibility.
Current developments of molecular tools, and in particular advances in DNA sequencing, have made genetically-focused research all the more timely and DNA ‘barcoding’ approaches are being more widely adopted (Rollinson et al. Reference Rollinson, Webster, Webster, Nyakaana, Jorgensen and Stothard2009). A new species of schistosome, believed to be a sister species to S. intercalatum, has been described from a site near Kisumu, in the Lake Victoria basin (Hanelt et al. Reference Hanelt, Brant, Steinauer, Maina, Kinuthia, Agola, Mwangi, Mungai, Mutuku, Mkoji and Loker2009), highlighting that there are still exciting opportunities for molecular characterization research. Other recent work in East Africa has shown that S. mansoni from the region was included in 4 out of 5 global ‘groups’ of the parasite, by looking at the cytochrome oxidase 1 (COI) gene (a gene frequently used for DNA barcoding in higher animals), but sampling was reported at a district, if not country, level, and barcodes from Lake Victoria all clustered together in Group 4 (Morgan et al. Reference Morgan, Dejong, Adeoye, Ansa, Barbosa, Bremond, Cesari, Charbonnel, Correa, Coulibaly, D'Andrea, De Souza, Doenhoff, File, Idris, Incani, Jarne, Karanja, Kazibwe, Kpikpi, Lwambo, Mabaye, Magalhaes, Makundi, Mone, Mouahid, Muchemi, Mungai, Sene, Southgate, Tchuente, Theron, Yousif, Magalhaes, Mkoji and Loker2005). Attempts at greater population sampling in later surveys, such as that by Stothard et al. Reference Stothard, Webster, Weber, Nyakaana, Webster, Kazibwe, Kabatereine and Rollinson(2009b) have shown a high diversity of barcodes in the ‘ASMIT’ fragment of the COI gene, and also a divide between barcodes collected from Lake Victoria versus those of neighbouring Lake Albert, suggesting population segregation, perhaps due to differences in snail-parasite compatibility between the two lakes. If this were the case, then it might also be expected to find differentiation between the barcodes found in various parts of Lake Victoria, spanning as it does over 3000 km of shoreline. Work on microsatellites in S. mansoni from Kenya and Uganda (Lake Albert region) has revealed high allelic diversity across numerous loci, which also revealed a surprising absence of heterozygotes, perhaps due to population structuring within the human host (Agola et al. Reference Agola, Mburu, DeJong, Mungai, Muluvi, Njagi, Loker and Mkoji2006; Gower et al. Reference Gower, Shrivastava, Lamerton, Rollinson, Webster, Emery, Kabatereine and Webster2007).
The aims of this study were to sample S. mansoni as extensively as possible across the endemic area of Lake Victoria by collecting widely across the shoreline environments, to determine whether diversity is high throughout the lake and, if so, to consider possible reasons for this. Using multiple genetic markers, this variation could also be examined at regional, local and host levels. Furthermore, the data were analysed spatially, to look for geographical trends that would either support or counter the conclusions drawn by previous genetic studies of Schistosoma mansoni in this region where significant geographical patterning was inferred.
MATERIALS AND METHODS
Collection of genetic material
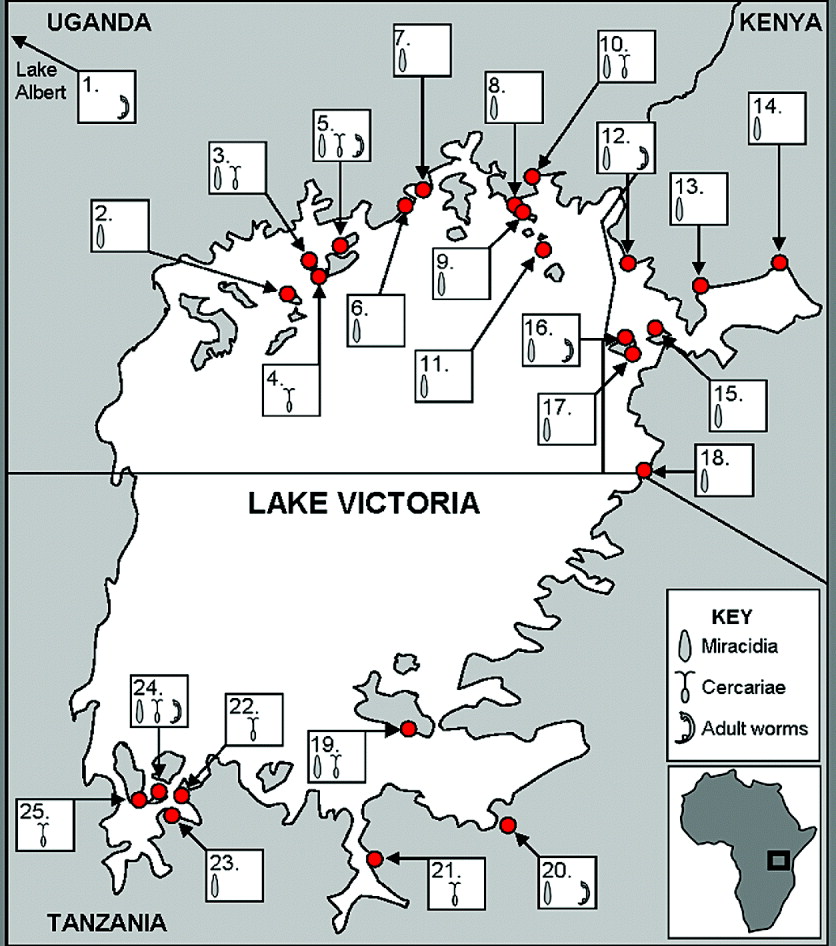
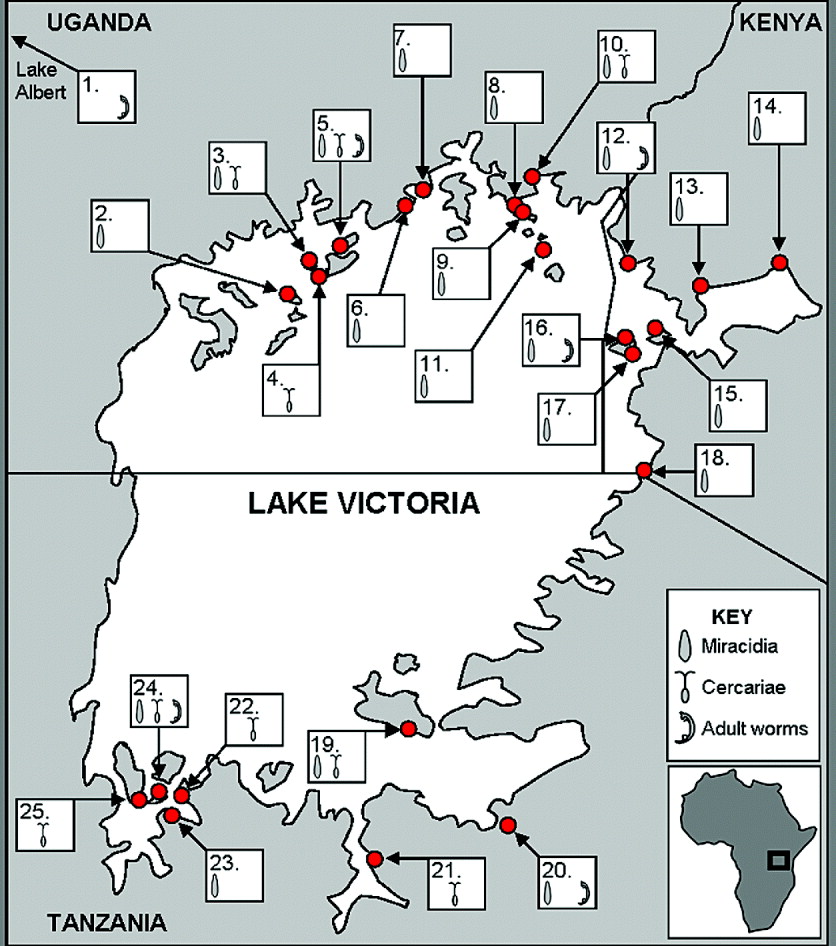
Miracidia and cercariae were collected from 25 different sites around the Ugandan, Tanzanian and Kenyan lakeshore of Lake Victoria (see Fig. 1), using the methods described below. The material was collected over 3 field visits, each lasting 3–4 weeks: Uganda in February-March of 2008, Tanzania (Mwanza region and further west) in June 2008, and finally Tanzania (Musoma region and north to the Kenyan border) and Kenya in January and February of 2009.
Map of the schistosome collection sites around Lake Victoria, denoting which forms of the parasite were collected at each location. Adult worms were collected from laboratory-infected mice, which had been exposed to cercariae produced by snails (of various species, see Table 1) infected from miracidia from the sites shown here.
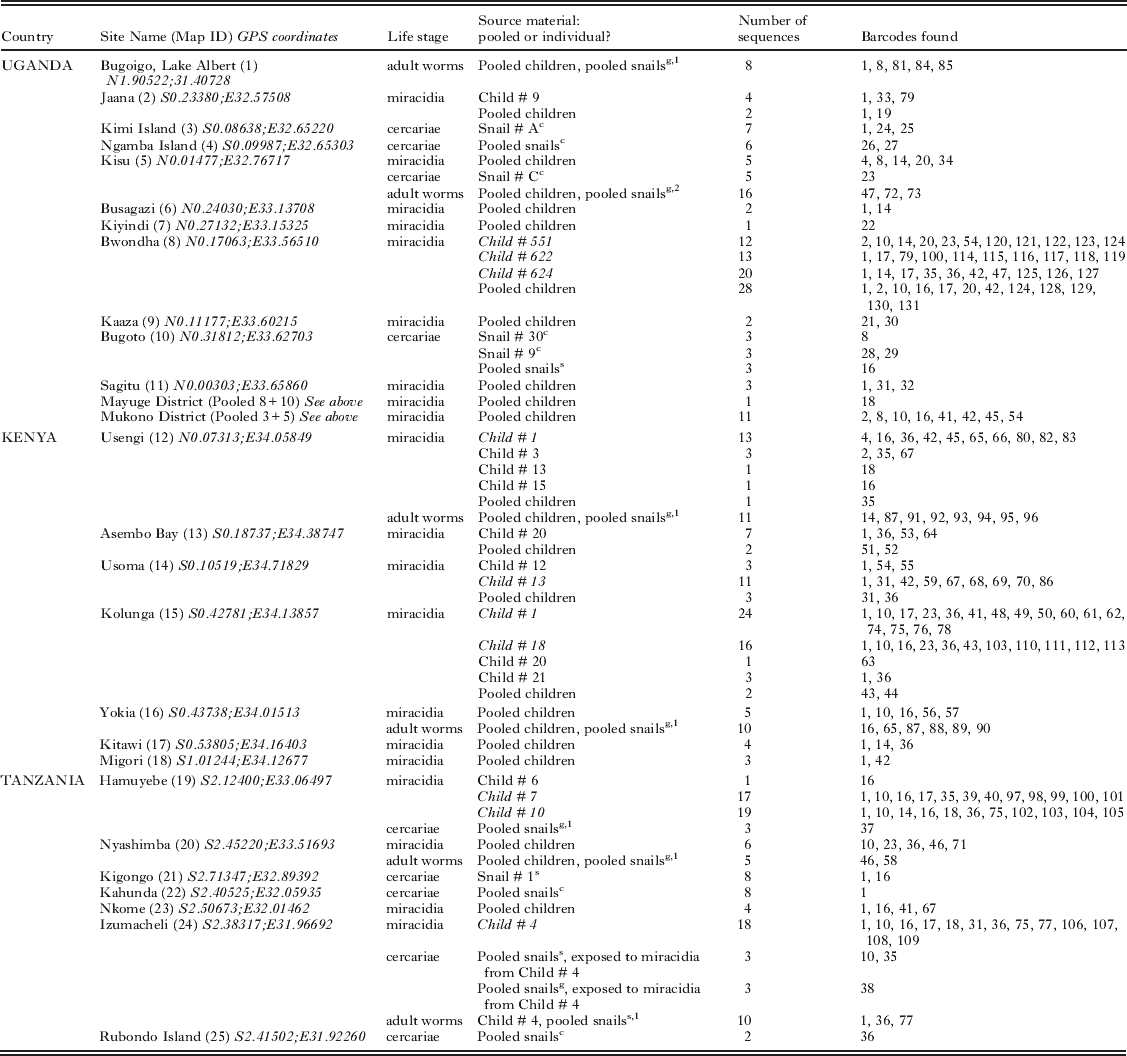
Schistosome sampling sites, life stage of parasite collected and source, number of individuals sequenced and barcodes found at each site

Miracidia
As part of on-going research mapping the distribution of schistosmiasis in the Lake Victoria region, 25 schools were surveyed in Uganda, Tanzania and Kenya in the period 2008–2009. At 19 schools, the egg-positive stool of children was used for hatching, via the Pitchford-Visser funnel method (Stothard et al. Reference Stothard, Webster, Weber, Nyakaana, Webster, Kazibwe, Kabatereine and Rollinson2009b), either individually or pooled by school or region, to collect miracidia. These miracidia were transferred individually, in 2 μl of water, onto Whatman FTA® indicator cards, under a dissecting microscope.
If large numbers of miracidia were obtained from hatching, some were used to infect Biomphalaria snails, in order to obtain a laboratory isolate of the parasite. Where possible, local snails (either B. sudanica or B. choanomphala) were infected to limit experimentally induced effects of selection pressure on the isolate. However, due to difficulties in maintaining populations of these species in the lab, where they were not available laboratory-bred populations of B. glabrata were used. For each isolate, between 10 and 15 snails were exposed to 5 miracidia for 1 h. In some cases, locally collected snails were also infected, as part of on-going compatibility experiments (Standley, unpublished data). These snails were examined for infection status on collection, and for 3 weeks subsequently, to confirm they had not previously been infected.
Cercariae
At all schools, and at more than 150 additional sites (Standley, unpublished data), collections of snails were made from within Lake Victoria as well as fringing marshes. These snails were placed, either individually or pooled by site, into pots of still mineral water and exposed to sunlight for between 2 and 5 h, to encourage emergence of cercariae. Once checked with a dissecting microscope, if found to be shedding visually-identified human cercariae, these were transferred individually in 2 μl of water onto Whatman FTA® indicator cards.
The B. glabrata laboratory-bred snails, which had been brought for exposure in situ to field-collected miracidia, were kept in the laboratory for at least 18 days, and were then regularly inspected for shedding schistosome cercariae, following the above protocol, every other day. When found to be shedding cercariae, these were again individually transferred to FTA cards for preservation of genetic material.
In order to maintain the isolate ex situ and retrieve adult worm material from laboratory hosts, cercariae were also used to infect several laboratory mice (150–200 cercariae per mouse), as described by Smithers and Terry (Reference Smithers and Terry1965).
Adult worms
Approximately 3 months after infection, the mice were euthanized and adult worms collected by perfusion with saline solution. Dissections of paired worms were carried out according to standard methodology (Smithers and Terry, Reference Smithers and Terry1965) and preserved in 100% ethanol until processing for DNA extraction took place.
Extraction and amplification of DNA
FTA cards
DNA from FTA cards was extracted according to the methodology described by Gower et al. (Reference Gower, Shrivastava, Lamerton, Rollinson, Webster, Emery, Kabatereine and Webster2007).
Genomic material
Extraction of genomic DNA from the adult worm samples was done using a standard CTAB (hexadecyltrimethylammonium bromide) extraction protocol, with chloroform-isoamyl alcohol and ethanol precipitation (Stothard and Rollinson, Reference Stothard and Rollinson1996), with the DNA finally re-suspended in 50–100 μl of double distilled water.
PCR of COI ASMIT region and sequencing
A 396 base-pair fragment of the cytochrome oxidase subunit 1 was amplified using the ASMIT 1 and ASMIT 2 primers (Stothard et al. Reference Stothard, Webster, Weber, Nyakaana, Webster, Kazibwe, Kabatereine and Rollinson2009b), between 1 and 10 ng of gDNA template and Ready-To-Go PCR beads (GE Healthcare, Chalfont St Giles, UK) in a 25 μl total reaction volume, and under standard thermal cycling conditions (Stothard and Rollinson, Reference Stothard and Rollinson1997). Five μl of each PCR product was visualized on a 1% ethidium bromide agarose gel, and amplified samples were purified using a QIAQuick PCR Purification Kit (QIAGEN Ltd, Crawley, UK). Product concentration was quantified on a Nanodrop ND-1000 Spectrophotometer (Nanodrop Technologies Inc., Willington, USA), and sequencing reactions were performed on each purified PCR product using an Applied Biosystems Big Dye Kit (version 1.1) and run on an Applied Biosystems 3730 DNA Analyzer (Applied Biosystems, Carlsbad, USA). Both sense and anti-sense strands of the gene were sequenced, to minimize the possibility of sequencing errors.
Microsatellite amplification
On adult worm genomic DNA, 5 nuclear microsatellite loci were amplified in individual PCR reactions using Ready-To-Go PCR beads (as above). The loci used were smd89, smd28, smd25, s9-1 and cal1-1: the primers used were all previously published, and fluorescently labelled with 6-FAM, PET, NED and VIC dyes (Blair et al. Reference Blair, Webster and Barker2001; Gower et al. Reference Gower, Shrivastava, Lamerton, Rollinson, Webster, Emery, Kabatereine and Webster2007). Amplifications were performed on a Veriti thermal cycler (Applied Biosystems Inc., Foster City, CA, USA) with an initial hot-start activation of 15 min at 95°C, followed by 40 cycles of 94°C, 90 sec at an annealing temperature (48°C for smd89, smd28 and smd25, and 50°C and 51°C for s9-1 and cal1-1 respectively) and 60 seconds at 72°C. A final extension step of 30 min at 60°C was also included. PCR products were visualized on a 1% GelRed™ (Hayward, CA, USA) agarose gel then diluted 1:10 in HiDi formamide (Applied Biosystems, as above) and analysed using an ABI3730 automated sequencer, with a GeneScan 500 LIZ size standard (both Applied Biosystems, as above). Allele sizes were calculated using PeakScanner v 1.0 (Applied Biosystems, as above). Individuals for which 2 or more loci failed to amplify or be analysed were excluded from later analyses.
Sequence analysis and phylogeography
The sequences were assembled and edited by eye using Sequencher v 4.8 (Gene Codes Corporation, Ann Arbor, Michigan, USA: http://www.genecodes.com). Individual sequences were visually aligned in MacClade 4.05 (Sinauer Associates, Sunderland, Massachusetts, USA: http://macclade.org/macclade.html) and polymorphic positions checked back to the original chromatograms in Sequencher. Sequencing accuracy was tested by performing repeat sequencing of 1 individual's genomic DNA; these repeat sequences were shown to be identical. Species identification of each sequence was checked by performed a BLAST (Basic Local Alignment Search Tool; http://blast.ncbi.nlm.nih.gov/Blast.cgi) search. Barcodes were identified using Collapse v 1.2 (http://darwin.uvigo.es/software/collapse.html) and compared to the barcodes found, using the same primers, by Stothard and colleagues (2009b), and numbered sequentially following theirs. All barcodes found were submitted, according to geographical location of origin, to GenBank (Accession numbers GQ415163-GQ415316).
A minimum spanning network analysis of the barcodes was performed using TCS (http://darwin.uvigo.es/software/tcs.html), and the results also presented in a bifurcating tree, based on pair-wise distance calculations (and using a Tamura-Nei 4-parameter model, calculated as optimal through earlier analyses on the data in ModelTest v 3.7: http://darwin.uvigo.es/software/modeltest.html). A consensus tree was built using Neighbour-Joining analysis, with bootstrapping (500 replicates, only probabilities above 50% were included), using MEGA 4.0 (Tamura et al. Reference Tamura, Dudley, Nei and Kumar2007).
Population genetics and spatial analyses
Unless otherwise stated, the population genetics analyses were carried out using Arlequin v 3.11 (Excoffier et al. Reference Excoffier, Laval and Schneider2005). For the COI marker, this was done on a subset of the data. Only miracidia were included, and only those from hosts where greater than 10 samples had been successfully sequenced, to ensure sufficient statistical power. In all, 163 COI sequences from 10 children, from 6 sites across the 3 countries, were included in this subset (Table 1). All 40 of the individual worms in the microsatellite analysis were also subjected to population genetics analyses. Tests included analysis of molecular variance (AMOVA), Tajima's and Fu's tests of neutrality, a mismatch test of population expansion and calculation of FST pairwise distances between and within groups. The microsatellite data were also tested for Hardy-Weinberg equilibrium and allelic diversity. Analyses were carried out at host, site and country level, where appropriate. A Mantel Z-test was used to investigate the spatial relationship of the COI subdataset. Average pairwise distances were calculated in MEGA 4 (Tamura et al. Reference Tamura, Dudley, Nei and Kumar2007) and geographical distances were measured in ArcView (part of ArcGIS, http://www.esri.com/software/arcgis/) and the output plotted in Excel (Microsoft® Office, Microsoft Corporation, Redmond, WA, USA).
RESULTS
Barcode data
Overall, 388 sequences were obtained: 60 from adult worms, 57 from cercariae and 272 from miracidia. These were resolved into 122 unique barcodes; of these, 9 corresponded to barcodes already described by Stothard et al. (Reference Stothard, Webster, Weber, Nyakaana, Webster, Kazibwe, Kabatereine and Rollinson2009b), who also found a further 9 barcodes which were not recovered in this survey, creating a combined barcode dataset of 131 barcodes (see Table 1). The majority of barcodes were recovered from miracidia collected from individual children (66·4%).
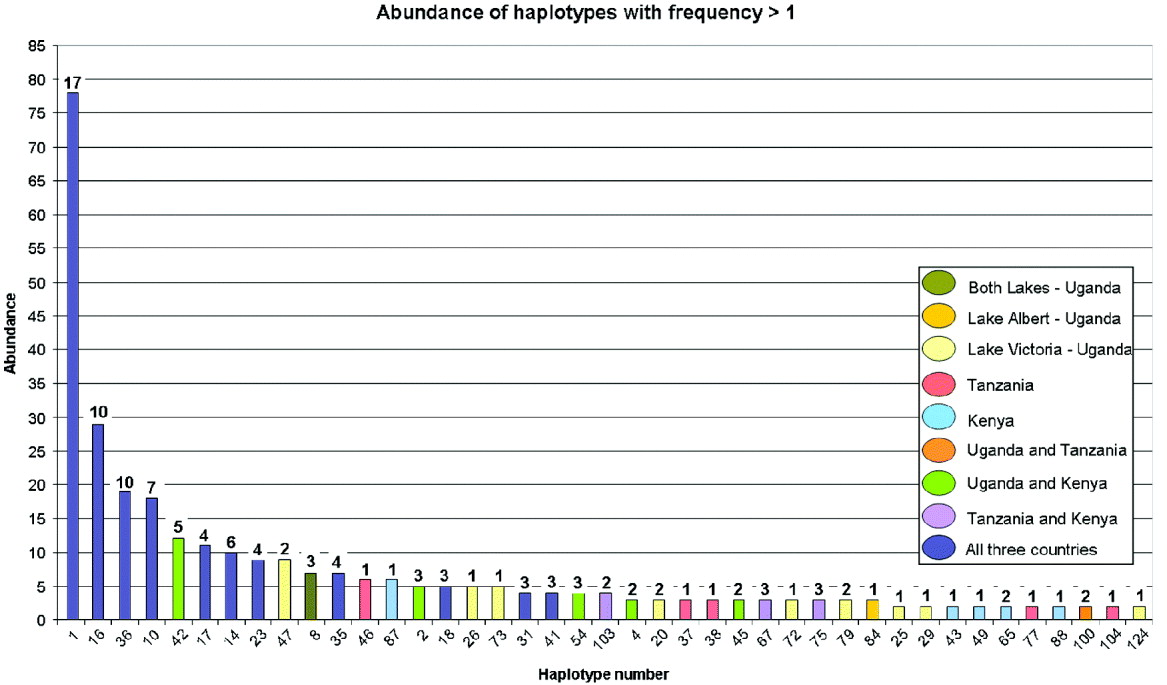
The percentage occurrence of each barcode varied widely, with the majority (66·4%) of the collected barcodes being only found once; 7 barcodes were recovered 10 or more times. However, the abundant barcodes were also generally widely geographically distributed, occurring in all 3 countries (see Fig. 2).
Barcode abundance bar chart, for those barcodes that were recovered more than once. The colour of each column refers to the countries and/or lake in which the barcode was found; the number above each bar is the number of sites, out of the total of 25, at which the barcode was found.
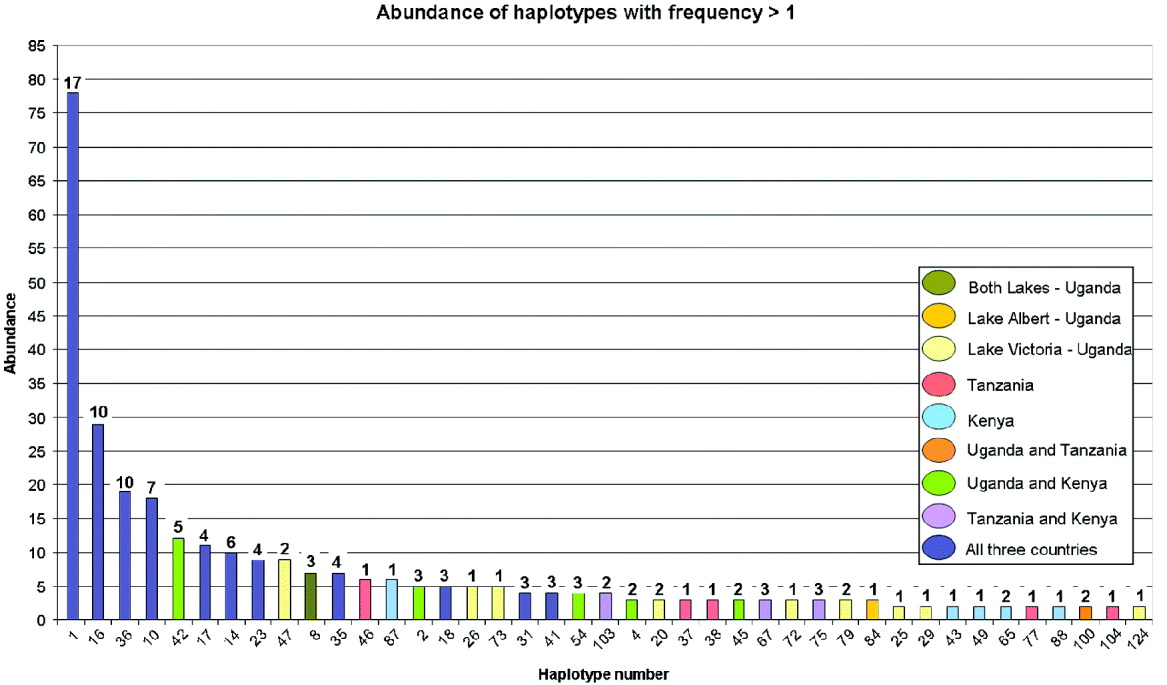
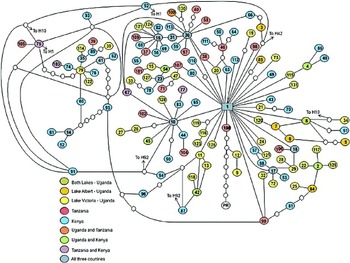
The minimum spanning TCS network suggested that barcode 1 was the most likely ancestral genotype, and it was also the most abundant and widely distributed, occurring at 17 of the 25 sites (see Fig. 3). In addition, the network showed that central nodes tended to be widely distributed and occur in all 3 countries. The hypothesized presence of some non-sampled barcodes was evident by the occurrence of missing steps between barcodes on the network. Two branches were emphasized by longer barcode-free stepwise substitutions: one culminated in the Puerto Rican S. mansoni out group sample, but the other centred around barcode 79, which was only found in Uganda.
Minimum spanning TCS network of all the barcodes discovered, including those found by Stothard et al. (Reference Stothard, Webster, Weber, Nyakaana, Webster, Kazibwe, Kabatereine and Rollinson2009b). The colour of each circle refers to the countries and/or lakes in which that barcode was found (note that size of circle is not proportional to abundance). Each line represents a single base change; small white circles represent unsampled, or perhaps extinct, barcodes. ‘PR’ refers to an isolate of Schistosoma mansoni from Puerto Rico, sequenced for the same ‘ASMIT’ region (reference as above).

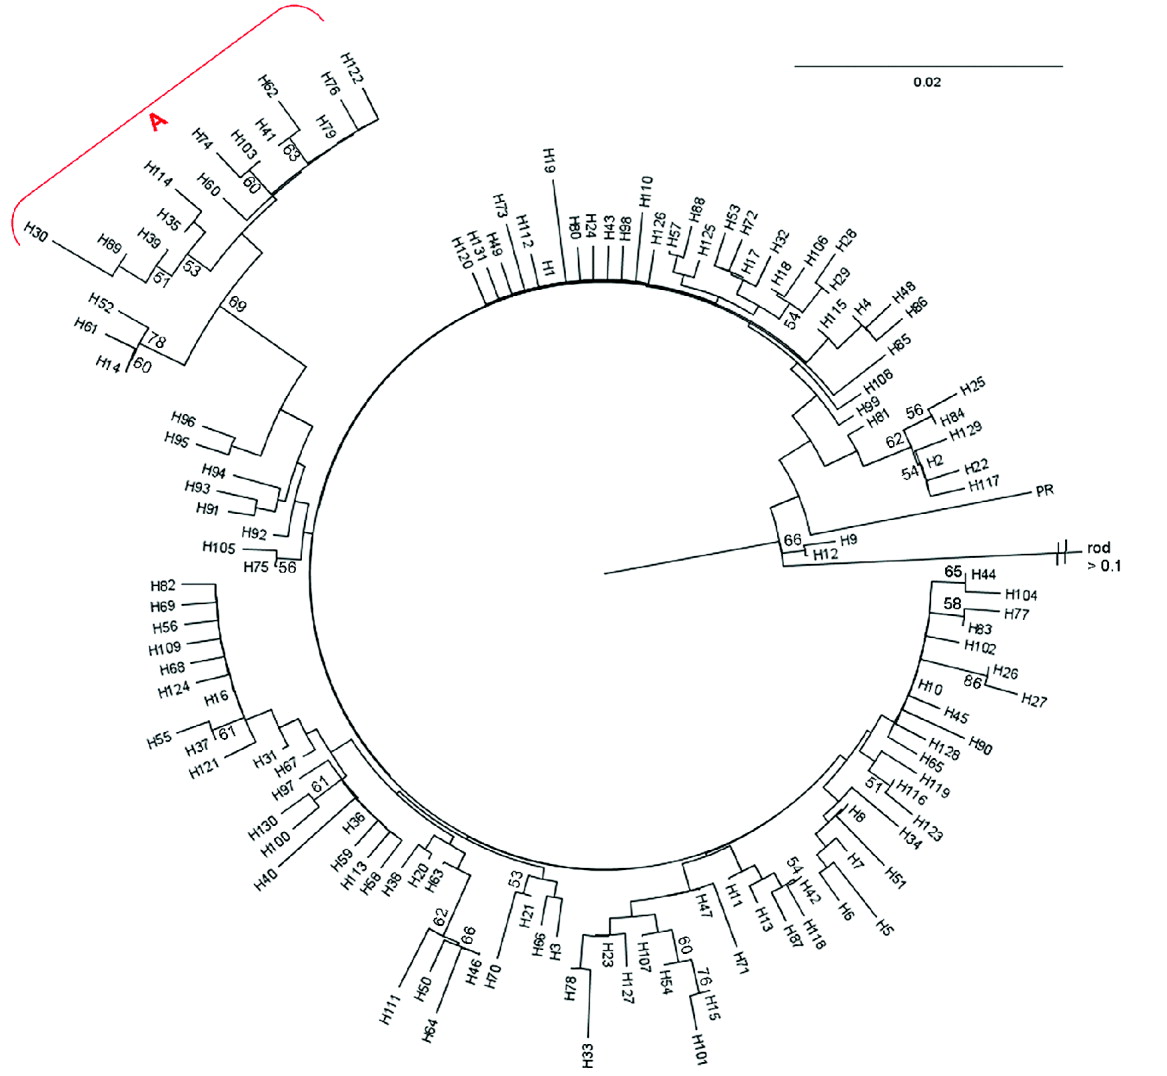
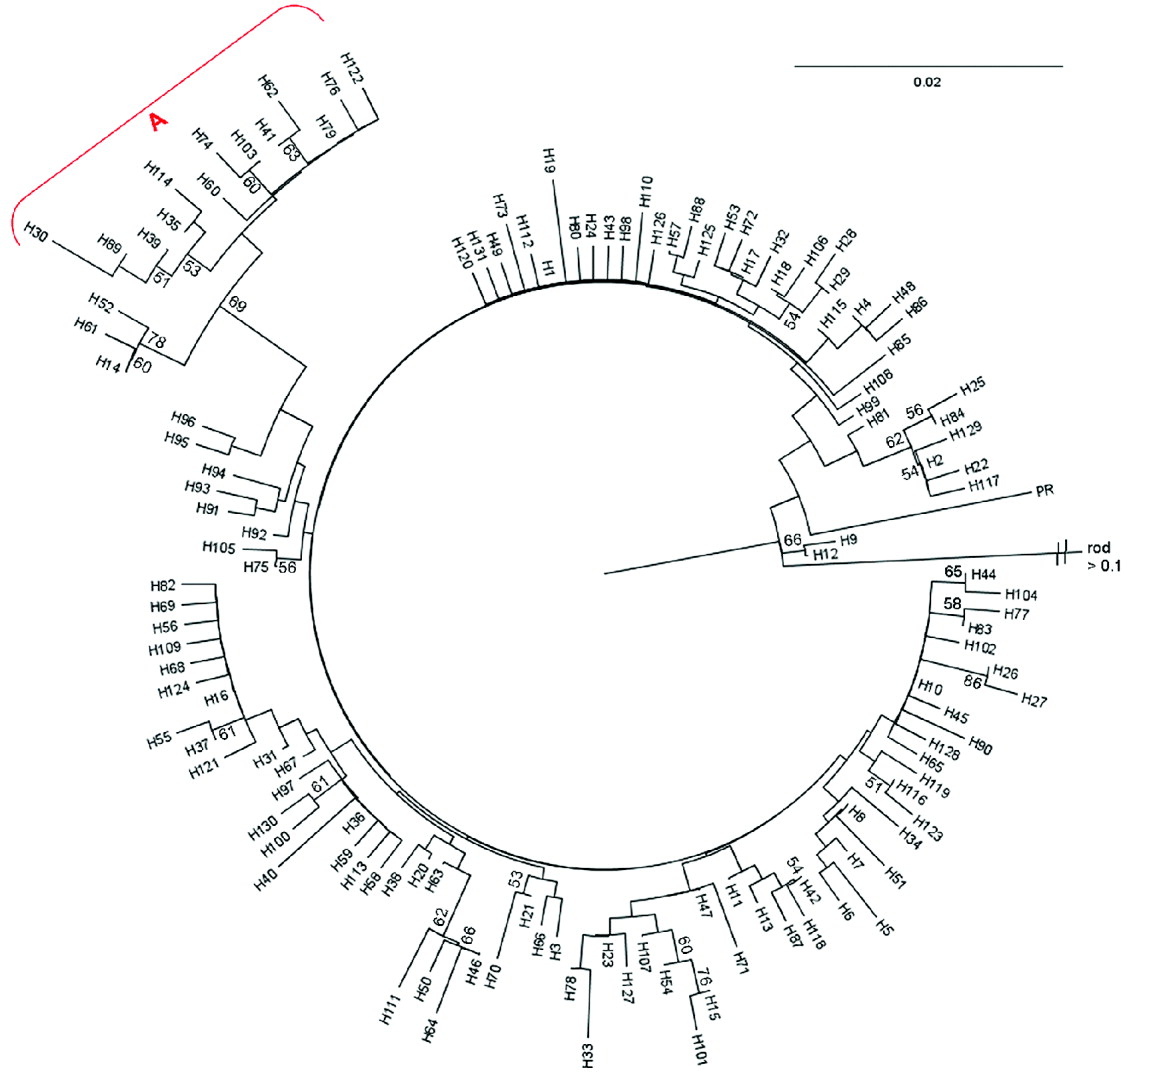
The bifurcating tree supported the evidence provided by the TCS network as to the distinctive nature of the cluster around barcode 79, but did not strongly support the clustering of barcodes 9 and 12 with the Puerto Rican sample, as they had been in the TCS network (see Fig. 4).
Distance-based Neighbour-Joining tree of all 131 barcodes, including those found by Stothard et al. (Reference Stothard, Webster, Weber, Nyakaana, Webster, Kazibwe, Kabatereine and Rollinson2009b), based on Kimura-2 parameters and with 500 bootstraps. Only clades supported by probabilities greater than 50% are reported, and ‘rod’, signifying Schistosoma rhodaini, was assigned as the outgroup. The clade designated by ‘A’, is the most strongly divergent clade, and can also be seen as a more distant grouping on the TCS network in Fig. 3.
Population genetics
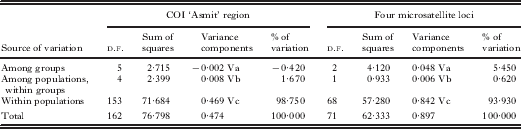
One of the microsatellite loci (smd28) proved to be monomorphic, so was discarded from the dataset. Analysis of the 4 remaining microsatellite loci revealed a total of 22 distinct genotypes out of the 36 individuals successfully analysed, with only 1 genotype shared between each isolate's populations (between Yokia and Usengi). The number of alleles and private alleles found, per population, can be seen in Table 2. Hardy-Weinberg equilibrium was observed for all 4 loci in the Izumacheli and Yokia populations, but rejected for 3 loci in Kisu and Usengi. In all these cases bar one, observed heterozygosity was significantly higher than expected heterozygosity (Table 2). The average FST value across the populations was 0·06, indicating very low, but non-negligible, genetic differentiation, and differentiation was greater than 0·10 between Kisu and Usengi and Izumacheli and Usengi, respectively. Overall, the results of the AMOVA showed that 93·9% of the total variation seen could be explained at the level of individual children (Table 3).
Microsatellite allelic diversity, from four populations of laboratory-passaged adult worms

* Signifies expected heterozygosity was significantly lower than observed heterozygosity; **corresponds to the opposite.
AMOVA results for COI ‘Asmit’ region population subset and microsatellite four loci population subset, showing high within-population variation in both cases
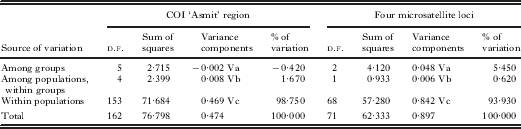
Similar tests were performed for the COI region on a subset of the data containing sequences retrieved from individual children. These showed an FST fixation index for the subdataset as whole of 0·033, suggesting negligible levels of genetic differentiation, and the same was true for the pairwise FST values calculated between populations. The AMOVA analysis, performed with groups defined by site, again showed that the vast majority of the variation was explained at the intra-host level (Table 3). The analysis was executed a second time, with the groups defined by country, and the results remained similar, with 98% of the variation explained by variation within each host.
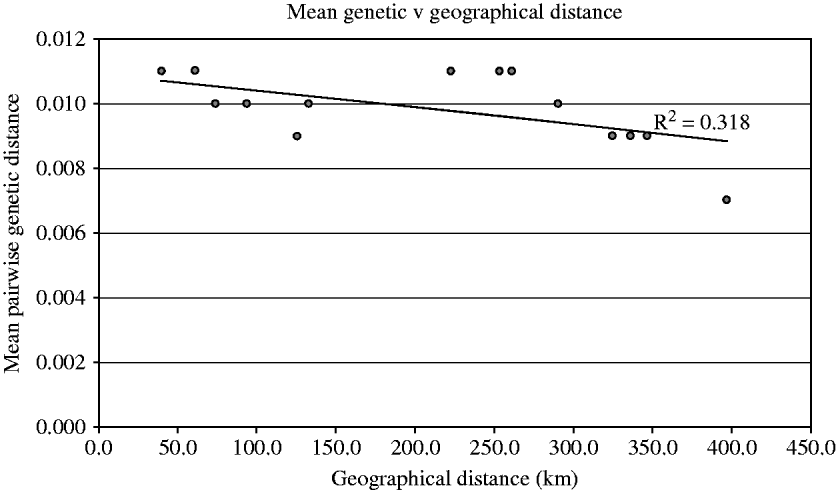
The Mantel Z-test, which was used to look for spatial autocorrelation within the genetic distance data, was insignificant (P=0·888), and the correlation coefficient was negative (−0·374), which would suggest increasing genetic similarity with greater geographical distance. A plot of the mean pairwise genetic distances against the pairwise geographical distance similarly showed no clear trend, apart from a slight negative correlation (see Fig. 5).
Graph showing pairwise geographical distance (in km) plotted against mean pairwise genetic distance. No significant correlation was seen, though the trend appears slightly negative.

Tajima's neutrality test was performed on each of the populations in the smaller subset of data, and the P-values produced from the resultant D values were all found to be significant (bar Child no. 4 from Izumacheli), which rejects neutrality (Tajima, Reference Tajima1989). Fu's Fs test also produced values which were all significant (P<0·02), and also suggests rejecting neutrality (Fu, Reference Fu1997). A mismatch test was performed on the dataset, and both the sum of squared deviation from simulated data and Harpenden's Raggedness index were not significant, thus preserving the null hypothesis of population expansion.
DISCUSSION
This survey has revealed that the extent of genetic variation of Schistosoma mansoni in Lake Victoria is much higher than previously envisaged. Most importantly, the vast amount of diversity is found within individual children and not at the geographical level from which they were sampled; this immediately highlights that increased sampling per child by location is necessary to build a more comprehensive picture of the parasite across its epidemiological landscape. Although previous surveys had also discovered high diversity (Gower et al. Reference Gower, Shrivastava, Lamerton, Rollinson, Webster, Emery, Kabatereine and Webster2007; Stothard et al. Reference Stothard, Webster, Weber, Nyakaana, Webster, Kazibwe, Kabatereine and Rollinson2009b), few had sampled as extensively, either geographically or numerically, from individual locations, and so it was surprising to find that even when more than 70 sequences were recovered from a single site (Bwondha, in Uganda) new unique barcodes were still being found. The other analyses performed helped to provide a better understanding of why this high diversity may exist, although the picture is yet to be resolved.
The barcode frequency bar chart showed that abundant barcodes were also geographically widespread and found in multiple sites. Rare barcodes may be examples of recent, local mutations, contributing to the earlier suggestion that barcodes may be ‘philopatric’ to a particular lake or site (Stothard et al. Reference Stothard, Webster, Weber, Nyakaana, Webster, Kazibwe, Kabatereine and Rollinson2009b). Our data, in contrast, demonstrate how this type of site-based geographical interpretation can be misleading; as can be seen in the TCS network, rare, geographically restricted barcodes appear to radiate from widespread, common ones. There was, however, sampling bias intrinsic in the methodology, in that it was more difficult to collect many barcodes from some sites than others, and some populations were sequenced more successfully; again, greater sampling effort at more locations might increase the abundance, and perhaps geographical spread, of even some of the ‘rare’ barcodes found here (cross-reference Fig. 1 with Table 1). The mismatch test demonstrated that population expansion could also have occurred, which adds support for these results, and explains the non-neutrality of the data.
The Neighbour-Joining (NJ) distance tree further supported the hypothesis of recent sequence radiation, as the majority of the bifurcations were only weakly supported (bootstrap probability <50%). However, 1 clade, also identified on the TCS network as being multiple steps away from the main, ancestral barcode, was strongly supported by the tree, suggesting this divide may have occurred less recently. Morgan et al. (Reference Morgan, Dejong, Adeoye, Ansa, Barbosa, Bremond, Cesari, Charbonnel, Correa, Coulibaly, D'Andrea, De Souza, Doenhoff, File, Idris, Incani, Jarne, Karanja, Kazibwe, Kpikpi, Lwambo, Mabaye, Magalhaes, Makundi, Mone, Mouahid, Muchemi, Mungai, Sene, Southgate, Tchuente, Theron, Yousif, Magalhaes, Mkoji and Loker2005) showed that East African S. mansoni is represented in 4 out of the 5 major lineages recovered, although all Lake Victorian and Albertine samples were in one group (Group 4). Within this group, 2 differentiated subgroups were strongly supported (>80%) by all phylogenetic methods used. However, there appeared to be no obvious national or even lacustrine clustering within these groups, with barcodes from Lake Victoria (Kenya and Tanzania) and Lake Albert (Uganda) appearing in both clusters. This is consistent with the tree structure found with our data; while most of the samples were poorly differentiated, a few subgroupings were reasonably well supported, though without clear geographical patterns. Conversely, Stothard et al. (Reference Stothard, Webster, Weber, Nyakaana, Webster, Kazibwe, Kabatereine and Rollinson2009b) found that when the separate ‘MORGAN’ section of the COI gene was sequenced for their Lake Victorian and Albertine data, their samples clustered within 2 out of the 5 major lineages of Morgan et al. (Reference Morgan, Dejong, Adeoye, Ansa, Barbosa, Bremond, Cesari, Charbonnel, Correa, Coulibaly, D'Andrea, De Souza, Doenhoff, File, Idris, Incani, Jarne, Karanja, Kazibwe, Kpikpi, Lwambo, Mabaye, Magalhaes, Makundi, Mone, Mouahid, Muchemi, Mungai, Sene, Southgate, Tchuente, Theron, Yousif, Magalhaes, Mkoji and Loker2005); barcode 2 was found to be in a separate lineage to the other 17 barcodes they found. As barcode 2 was also recovered in this survey, the possibility that this pattern could be seen again with these data, given analysis of different genetic fragments, should not be discounted, especially as divergence of barcode 2 was reasonably well-supported in the analysis presented here.
It is worth emphasizing that despite some apparent differentiation between specific barcodes, the subsets of the data analysed from a population genetics perspective showed very little structure, indicating that describing collections of parasites from a particular site or child as a ‘population’ may not be valid. This low level of population structuring is consistent with other research on allogenic parasites that have both terrestrial and aquatic hosts (Criscione and Blouin, Reference Criscione and Blouin2004; Devon et al. Reference Devon, Tania, Diane and Robert2009). The greater population structuring seen in microsatellite markers has been seen in other studies of schistosome populations and has been in some cases attributed to human migration (Curtis et al. Reference Curtis, Sorensen and Minchella2002; Stohler et al. Reference Stohler, Curtis and Minchella2004; Steinauer et al. Reference Steinauer, Hanelt, Agola, Mkoji and Loker2009). These studies also found significantly different levels of observed and expected heterozygosity, which have been attributed to effects of lab passage (Rodrigues et al. Reference Rodrigues, Coura, de Souza, Passos, Dias-Neto and Romanha2002), and in this study, resulted in higher observed heterozygosity than expected. This may be due to enhanced selection for genetically diverse individuals (such as heterozygotes) in a laboratory setting, or a bottleneck event while the isolate is being established in the laboratory (Gower et al. Reference Gower, Shrivastava, Lamerton, Rollinson, Webster, Emery, Kabatereine and Webster2007). However, these findings also contrast with other recent studies of East African S. mansoni, where much stronger population structuring was evident (Agola et al. Reference Agola, Mburu, DeJong, Mungai, Muluvi, Njagi, Loker and Mkoji2006). The Mantel Z-test added statistical weight to the observation that there appeared to be no significant relationship between genetic distance and geographical distance among the COI subdataset.
Evidence highlighting the potential importance of human migration in creating the results described above comes from examining questionnaires, carried out at the same time as the parasite collection. These revealed a very high level of itinerancy among the communities being surveyed (Standley et al. Reference Standley, Adriko, Alinaitwe, Kazibwe, Kabatereine and Stothard2009). If human migration carries particular parasite genotypes to new areas, they may still be able to transmit in these locations, if compatible snails are also widely distributed. The taxonomic status of Biomphalaria host snails of S. mansoni in Lake Victoria is still not clear (Jorgensen et al. Reference Jorgensen, Kristensen and Stothard2007), but recent results suggest that their diversity is also very high (Standley et al., manuscript in preparation), which means that perhaps these common barcodes of S. mansoni are compatible with a wider diversity of snails than previously thought. Even without the snails, adult worms may live for years within a terminal host, so people may carry genotypes of the parasite from a home village to areas far from the original infection site. As it happened, this effect did occur within the data: Child no. 4 from Izumacheli, in the south-western region of Lake Victoria, was found to have been born in Kisumu District in Kenya, near the Usoma site, and thus could have carried parasites from the region across the Lake to Tanzania. This raises the suggestion that the diversity of each child's parasitological burden may act as a historical ‘signature’ of infection events, across different water contact sites and through time, depending on where that child has been living. Snail movement throughout Lake Victoria could also be implicated in de-coupling geographical and genetic patterns, as is the case in China with S. japonicum (Shrivastava et al. Reference Shrivastava, Qian and Webster2005). Further molecular work on the snail distributions is ongoing in Lake Victoria and will elucidate the role of snail movement in the spread of parasite genotypes.
The implications of these genetic findings are manifold. First of all, it would seem that sampling is still not sufficient even at the levels we have attempted. Moreover, the existence of temporal variation in diversity patterns should also not be ruled out; despite exhaustive sampling, in this survey 5 of the barcodes found in Mayuge District (Uganda) by Stothard et al. (Reference Stothard, Webster, Weber, Nyakaana, Webster, Kazibwe, Kabatereine and Rollinson2009b) were not recovered, despite revisiting 2 out of 4 of the same villages. This could be the result of treatment in the intervening time-period, but also potentially the effect of variation in barcode type between individuals, even from the same locality. It is worth emphasizing that the population structuring seen in these data is likely mirrored in other systems, where the parasite has high diversity and its human host may be highly migratory (Kumar et al. Reference Kumar, Patra, Hoti and Das2002).
Secondly, the data also show that children have very diverse individual parasite loads; the implication of this finding on the resultant pathology of the disease is not known, nor how this relates to treatment, although there is evidence from studies of Schistosoma haematobium that genetic type may have implications for clinical manifestation of the disease (Brouwer et al. Reference Brouwer, Ndhlovu, Wagatsuma, Munatsi and Shiff2003). Morbidity has been shown to vary between individual children, even from the same locality, independent of infection intensity, and therefore it is highly likely there could be a genetic determinant to disease pathology (Balen et al. Reference Balen, Stothard, Kabatereine, Tukahebwa, Kazibwe, Whawell, Webster, Utzinger and Fenwick2006). Again, there are further implications to high parasite diversity; the children in this survey were shown to have unique profiles of barcode diversity, so if morbidity is linked to genetic type, then child-to-child comparisons of infections will be rendered dubious, as morbidity could only be evaluated or predicted at an individual level, by looking at that child's particular parasitological barcode profile. Diversity may also impact re-infection and treatment dynamics (Dumont et al. Reference Dumont, Mone, Mouahid, Idris, Shaban and Boissier2007). It is hypothesized that a wide genetic base for selection to act upon may increase the rate of resistance to treatment developing, though this would result in a decline in diversity over time to a few, resistant genotypes (Feng et al. Reference Feng, Curtis and Minchella2001). Continued monitoring of S. mansoni diversity in individual children will provide information regarding the efficacy of on-going treatment campaigns and warning signals were resistance to emerge.
Finally, our results have shown very high levels of genetic diversity of S. mansoni, which defy straightforward attempts to assign geographical patterns. Rather than be tied to the concept of a particular school, or even site, at a specific time as the basis for a parasite ‘population’, these data suggest that future research on the genetic patterns of S. mansoni in this region should potentially consider Lake Victoria as one, inter-mixing parasite population, with a substructure of individual children who are highly mobile across the Lake and differential snail compatibilities. Further surveys, across more of the region, could determine at what scale this mixing occurs: for example, how parasitologically disjointed, or rather, how connected, is Lake Albert from Lake Victoria? This is particularly important in the context of on-going national control programmes, which might benefit from a more regionally integrated outlook.
ACKNOWLEDGEMENTS
The authors would like to thank all the staff and technicians at the following organizations, who assisted with school surveys and snail collection: Vector Control Division, Kampala; National Institute of Medical Research, Mwanza and the National Museum of Kenya, in Nairobi. Cambridge University kindly shared FTA cards for inclusion in this study, and Dr Bonnie Webster allowed her data to be used for comparisons with this dataset, which was much appreciated. Dr Steve Ansell's expertize in population genetics software and analyses was indispensible. Dr Aidan Emery, Mike Anderson and Jayne King assisted in the maintenance of the parasite isolates in the laboratory, and also in the extraction of adult worm material. This research was generously funded by an NHM Studentship and supported by the EU grant CONTRAST (FP6 STREP contract no: 032203, http://www.eu-contrast.eu).