

Background
Stroke is the third leading cause of long-term disability (American Heart Association Statistics Committee and Stroke Statistics Subcommittee, 2006), and its incidence increases markedly with advancing age (U.S. Department of Health and Human Services, 1995). Thus, people who have had a stroke constitute one of the main clienteles of rehabilitation services. Because stroke can affect physical, functional, psychological, cognitive, and social capabilities, persons who have had a stroke usually need to engage in a wide range of rehabilitation activities.
It is now recognized that rehabilitation for older adults who have suffered a stroke must consist of a continuum of services that includes three main types: (a) evaluation; (b) active rehabilitation (i.e., activities aimed at reducing impairment resulting from stroke, and at increasing capabilities and social participation); and (c) support (i.e., home support activities aimed at preventing the deterioration of capabilities and social participation) (Association des établissements en déficience physique du Québec, 2003). Consequently, a continuum of such services should also include interventions related to both capabilities and social participation.
Ideally, these services should be provided to people with stroke according to their needs, taking into account the stroke severity and the older person’s progress (Desnoyers & Lagacé, Reference Desnoyers and Lagacé1995). In Québec province, there are no fewer than seven ways to ensure a continuum of rehabilitation services to the elderly: (a) acute care hospitals, (b) in-inpatient rehabilitation units (Stroke Unit Trialists’ Collaboration, 1997), (c) geriatric day hospitals, (d) local community service centres (Direction générale de la planification et de l’évaluation & ministère de la Santé et des Services sociaux, 1998), (e) day centres, (f) private medical clinics (Lebel, Reference Lebel, Dans Arcand and Hébert1997), and (g) not-for-profit community organizations.
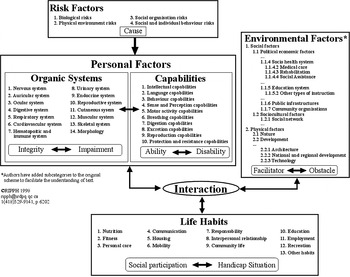
To identify and classify rehabilitation interventions systematically and consistently, the international nomenclature (taxonomy) of the Disability Creation Process (DCP) model (Fougeyrollas, Noreau, Bergeron, Cloutier, Dion, & St-Michel, Reference Fougeyrollas, Noreau, Bergeron, Cloutier, Dion and St-Michel1998) is useful. This model conceptualizes how the effects of stroke are highly dependent on personal factors including impairments, disabilities, and socio-demographic characteristics such as age, gender, and schooling. Figure 1 illustrates that diseases of the nervous system and other organic systems (e.g., muscular) can lead to impairments, which can be operationalized through 10 categories of disabilities (e.g., intellectual, language, behaviour, sense and perception, motor activity). Depending on the number and extent of these disabilities, people vary in their ability to accomplish their daily activities and social roles, called “life habits” in the DCP model, which operationalize the concept of social participation. In this model, social participation refers to the accomplishment of tasks in 12 domains of life; six of these refer to the person’s daily activities, and six refer to social roles. Social participation of people with stroke is also influenced by social environmental factors (e.g., support from the family, access to health and social services), whereas physical environmental factors refer to natural or technological elements such as geographical territory and technical aids. As obstacles or facilitators, these factors can either hinder or help in the accomplishment of daily activities and social roles.
The Disability Creation Process, conceptual scheme (Fougeyrollas, Cloutier, Bergeron, Côté, Côté, & St-Michel, 1998). CRIPPH 1998. ripph@irdpq.qc.ca. 1(418)529–9141, p. 6202. *Authors of this manuscript have added subcategories to the original scheme to facilitate the understanding of text.

Indications are that older adults with stroke fail to receive services related to their needs; for example, there are insufficient home care or community services, especially in semi-urban areas (Britton & Andersson, Reference Britton and Andersson2000). Furthermore, day hospitals and active rehabilitation units are available only in urban centres. Rehabilitation services are not systematically allocated according to people’s disabilities (Lincoln, Gladman, Berman, Luther, & Challen, Reference Lincoln, Gladman, Berman, Luther and Challen1998; Robinson, Reference Robinson2000), especially when specific interventions are required (e.g., with language). Unfortunately, it seems that advanced age affects the equitable distribution of the available services (Tangeman, Banatis, & Williams, Reference Tangeman, Banatis and Williams1990; Trahan, Bélanger, & Bolduc, Reference Trahan, Bélanger and Bolduc1993) and that the services currently available for older adults with stroke are often insufficient to meet their rehabilitation needs (Talbot, Viscogliosi, Desrosiers, Vincent, Rousseau, & Robichaud, Reference Talbot, Viscogliosi, Desrosiers, Vincent, Rousseau and Robichaud2004; Vincent, Deaudelin, Robichaud, Rousseau, Viscogliosi, Talbot et al., Reference Vincent, Deaudelin, Robichaud, Rousseau, Viscogliosi and Talbot2007). The results from most of these studies reinforce our observation that many services are neither available nor accessible in all regions.
Empirical and quantitative data are lacking on the availability of interventions in the continuum of rehabilitation services and types of services offered in different types of regions. This lack has limited the ability to guide the organization and enhancement of services at the political (ministerial?) and regional health levels. Accordingly, in this study we aimed at the following goals:
• Identifying the interventions addressing the capabilities and areas of social participation for which the rehabilitation services offered is the most complete. (By “most complete” we mean offered by the greatest number of resources.)
• Comparing the interventions targeting capabilities and areas of social participation in three health regions in the province of Québec (one metropolitan region and two urban regions that include rural areas).
• Describing the distribution of the type of services offered in terms of evaluation, active rehabilitation, and support for interventions related to capabilities and areas of social participation.
• Comparing the distribution of the type of services offered in terms of evaluation, active rehabilitation, and support for interventions targeted towards capabilities and areas of social participation in the three health regions.
Methods
A cross-sectional postal questionnaire survey was conducted in 2004–2005 as part of a multicentre study on the rehabilitation needs of people with stroke after being discharged with a view to returning home.
Recruitment
Using lists of resources provided by health and social service agencies, a questionnaire was sent to all resources (n = 343) likely to offer rehabilitation services (evaluation, active rehabilitation, and support) to people aged 65 years and older who had suffered a stroke, in three health regions in the province of Québec. The questionnaire was addressed to the professional services department (PSD) of each resource or to the highest administrative authority. The questionnaires were filled out by the person or persons named by the PSD as having the best knowledge of the services. Two reminder phone calls were made, one at two weeks and one at one month after the questionnaire was sent. The study coordinator offered support in completing the questionnaire if needed.
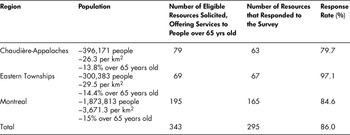
The Montréal metropolitan region and two urban regions that included rural areas – Chaudière-Appalaches and the Eastern Townships – were invited to take part in the survey. The Montreal region is representative of a metropolitan area (16.3 % of the Canadian population) as reported by the Canadian Institute for Health Promotion (2003). The two other health regions are representative of areas with a sparsely populated urban and rural mix (11.4% of the Canadian population). Table 1 shows the population of 65 years and older served in these regions and the number of resources in the territory likely to offer services to that clientele. The response rate was 295 resources (86%).
Profile of target population: number of health and community resources offering services for that population and survey response rate

Questionnaire
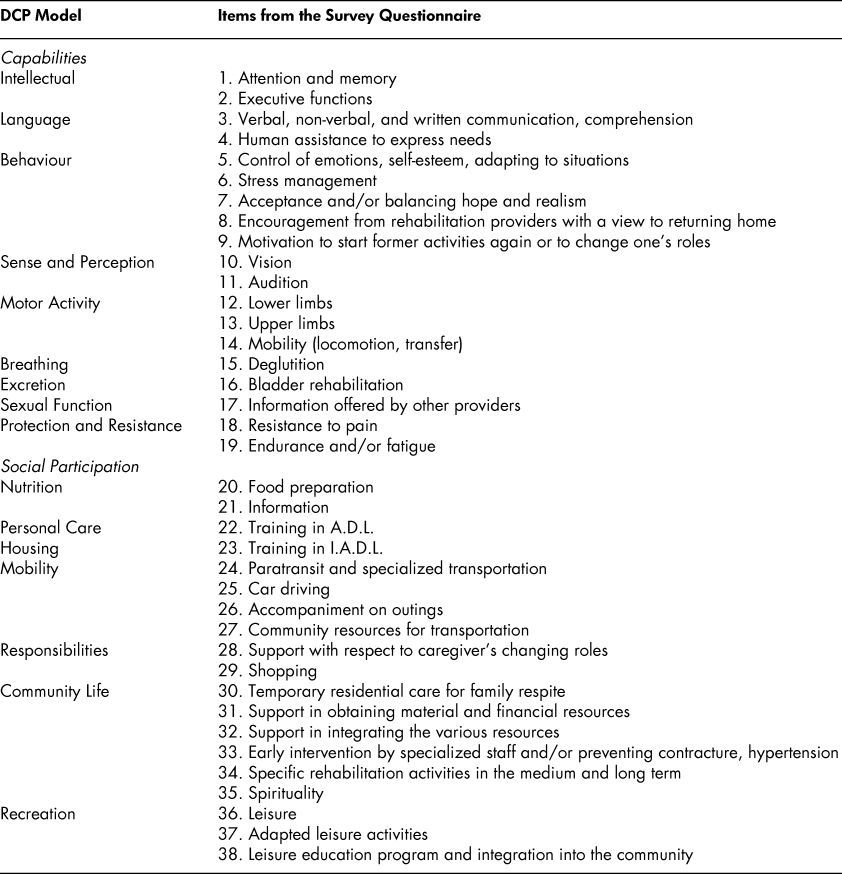
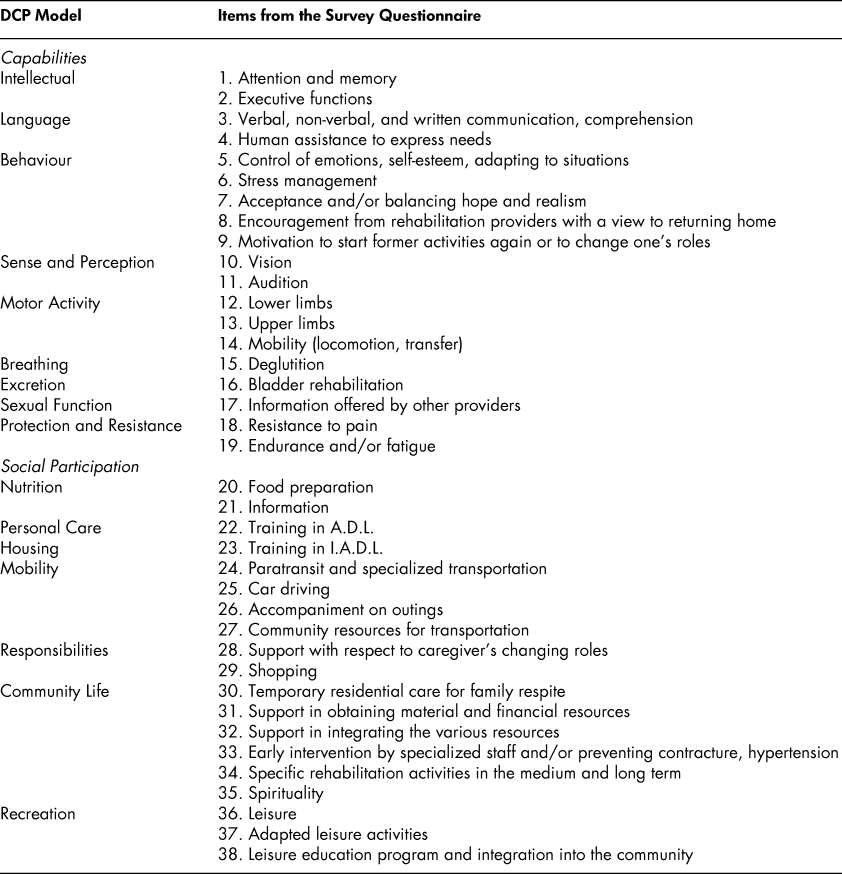
Each resource was asked to identify the interventions targeted to capabilities and areas of social participation that were offered to its clientele with stroke. When an intervention was offered, the respondent was asked to describe whether it was an intervention of evaluation, active rehabilitation, or support. The questionnaire comprised 38 items categorized according to capabilities and areas of social participation of the DCP model (see Table 2). The questionnaire was pre-tested in the Eastern Townships region, and after completion by two pre-targeted resources, only one capability (reproduction) had to be clarified (it was replaced by sexual function) for reasons of comprehension and applicability to the relevant clientele.
Items drawn from the survey questionnaire (activities that may be offered in a continuum of rehabilitation services for persons with stroke) and presented according to the classification and nomenclature of the Disability Creation Process model
Data analysis
Whenever a resource checked off one or more items related to a capability – e.g., behaviour (5 items) – the resource was registered as offering the service for that capability. Descriptive statistics (i.e., frequency, percentage) were produced for all the capabilities and all areas of social participation. Similar analyses were also carried out by region and by type of services (evaluation, rehabilitation, and support). The chi-square test was used to determine the statistical differences between the regions, the interventions, and the types of services.
Results
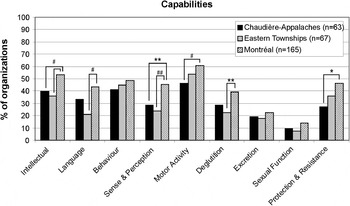
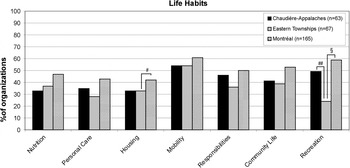
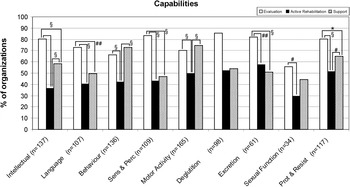
Figures 2 and 3 show the percentage of resources offering rehabilitation services by region, for each of the capabilities and areas of social participation. Considerable differences can be seen with respect to capability-related activities. Services targeted towards motor capabilities were the ones most frequently offered in the three regions (46% of resources in the Eastern Townships, 54% in Chaudière-Appalaches, and 61 % in Montreal). Capabilities related to reproduction (sexual function) and excretion were the least frequently offered. In the areas of social participation, mobility-related activities were the most often reported by respondents in all three regions (54% in the Eastern Townships and in Chaudière-Appalaches, and 61% in Montreal).
Interregional comparison of rehabilitation services related to capabilities
Note: Frequencies calculated based on all the resources offering services, by region and for each category of capability. A percentage was then established (number of resources offering services out of total number of resources having completed and returned the questionnaire).
*p = 0.01; **p = 0.02; #p = 0.05; ##p = 0.005.

Interregional comparison of rehabilitation services related to social participation
Note: See note under Figure 2 for detailed calculation.
#p = 0.05; §p = 0.001; ##p = 0.005.

Significant regional discrepancies (Figure 2) were evident for six of the nine capabilities in which services were offered for capabilities related to: (a) intellect, (b) language, (c) sense and perception, (d) motor activity, (e) deglutition, and (f) protection and resistance. Generally, the offer of services was greater in metropolitan areas. In the seven areas of social participation, the main differences between the regions were in terms of personal care and recreation (see Figure 3). The Eastern Townships region offered fewer services in personal care and recreation than the other two regions.
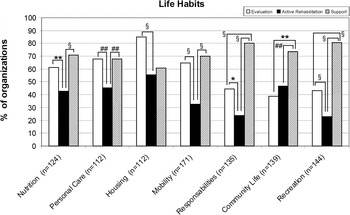
Figures 4 and 5 show the types of service offered for all capability-related activities; evaluation was offered significantly more frequently than active rehabilitation and/or support services (Figure 4). Support services were also offered significantly more often than active rehabilitation, with the exception of four capabilities where the frequency of both offers was similar: (a) intellectual, (b) behaviour, (c) motor activity, and (d) protection and resistance. For interventions related to social participation, support services were offered significantly more frequently, however, than active rehabilitation and/or evaluation services (Figure 5). Finally, support services were offered significantly more often than the active rehabilitation services for six of the seven areas of social participation assessed (Figure 5).
Comparison of types of services by capability for all three regions combined
Note: The number of resources offering specific services was calculated for each of the regions and for the categories of capabilities and areas of social participation. A percentage was then established (number of resources offering a specific services out of total number of resources offering services). One resources can be included in the calculation of all three types if that resources offers evaluation, active rehabilitation and support services.
*p = 0.01; #p = 0.05; §p = 0.001; ##p = 0.005.

Comparison of types of services by area of social participation, for all three regions combined
Note: See note under Figure 4 for detailed calculation.
#p = 0.01; **p = 0.02; §p = 0.001; ##p = 0.005.

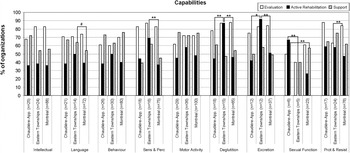
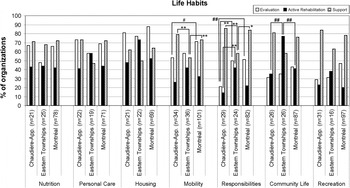
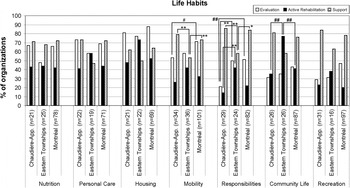
We observed more interregional discrepancy in active rehabilitation services than in support and evaluation services. Figures 6 and 7 present the types of services offered and regions where they exist. Somewhat unexpectedly, in four capability-related services and two social participation-related services (i.e., one third of all services offered), we observed that active rehabilitation services were offered more frequently in rural regions.
Comparison of types of services by capability and by region
Note: See note under Figure 4 for detailed calculation. However, this time the percentages were calculated taking into account the three regions studies.
*p = 0.01; **p = 0.02; #p = 0.05

Comparison of types of services by area of social participation and by region
Note: See note under Figure 4 for detailed calculation. However, this time the percentages were calculated taking into account the three regions studies.
*p = 0.01; **p = 0.02; #p = 0.05; ##p = 0.005.
Discussion
To our knowledge, no other study has concentrated simultaneously on the three types of services offered (evaluation, active rehabilitation, and support in the community); on the variety of rehabilitation services for persons with stroke; and on all the care structures available in three health regions in the province of Québec.
The results show greater variations in capability-related services than in social participation-related services. More especially, they show that most rehabilitation services offered to older people with stroke concern motor activity and mobility. Thus, services seem to prioritize mobility-related needs over those related to other capabilities. In this respect, our results confirm those in the literature, which highlight the importance of interventions based on motor activities (Heath & Fenton, Reference Heath and Fenton1997; Kumlien, Axelsson, Ljuunggren, & Winblad, Reference Kumlien, Axelsson, Ljunggren and Winblad1999; Lincoln et al., Reference Lincoln, Gladman, Berman, Luther and Challen1998; Mayo, Wood-Dauphinee, Ahmed, Gordon, Higgins, McEwen et al., Reference Mayo, Wood-Dauphinee, Ahmed, Gordon, Higgins and McEwen1999). The data in our study showed consistency of care priorities between services offered within care facilities (which focus intensively on motor capabilities), and services offered after discharge (which focus on mobility and locomotion) in the community. This observation also reveals that services related to mobility are somewhat prioritized. But is mobility really the most important aspect of post-stroke adaptation for older people?
From a social and economic viewpoint, helping elderly people to remain mobile reduces the heaviness of their support for the health system and for the family (Dillingham, Pezzin, & Mackenzie, Reference Dillingham, Pezzin and Mackenzie2002). Mobility is also related to quality of life (Pell, Donnan, Fowkes, & Ruckley, Reference Pell, Donnan, Fowkes and Ruckley1993); a more mobile person performs more movements, reports more energy and less pain, sleeps better, and reports more satisfaction with social relationships and emotional reactions. From the viewpoints of stroke survivors, caregivers, and health care administrators and providers, recent studies have shown that older peoples’ needs go well beyond mobility (Boter, Rinkel, & de Haan, Reference Boter, Rinkel and de Haan2004; Burton, Reference Burton2000; Garrett & Cowdell, Reference Garrett and Cowdell2005; Hare, Rogers, Lester, McManus, & Mant, Reference Hare, Rogers, Lester, McManus and Mant2006; Liu, Chan, & Chan, Reference Liu, Chan and Chan2005; Tooth & Hoffmann, Reference Tooth and Hoffmann2004; Vincent et al., Reference Vincent, Deaudelin, Robichaud, Rousseau, Viscogliosi and Talbot2007). Findings from these studies suggest that while we should continue to focus on mobility, more emphasis should be placed on other contributors to quality of life, such as communication, which is essential for social relationships.
Our study results showed significant regional discrepancies, which were more pronounced with respect to capabilities (6 on 9 capabilities) than to areas of social participation (2 on 7 life habits). In terms of capabilities, more services were offered in the metropolitan region than in the Eastern Townships (for five capabilities out of nine) and Chaudière-Appalaches (for two capabilities out of nine). These data partially confirmed that fewer services related to capabilities are offered in territories that include large rural areas (Britton & Andersson, Reference Britton and Andersson2000; Lincoln et al., Reference Lincoln, Gladman, Berman, Luther and Challen1998).
With respect to domains of social participation, however, the Chaudière-Appalaches region, which includes rural areas, consistently offers services equal to or greater than those of the metropolitan region, while the Eastern Townships region offers fewer services in two areas of social participation. These results contrast with those in the literature where services in rural areas are generally offered less frequently than in metropolitan areas (Britton & Andersson; Lincoln et al.). It is plausible that, for social participation-related services, these regions use human resource substitution (e.g, volunteers instead of professionals) more often to ensure the accessibility of certain services (Hébert & Instituts de recherche en santé du Canada, Reference Hébert2002). One example of this substitution in a continuum of rehabilitation services would be an intervention to optimize social participation carried out by a volunteer trained in a community organization, rather than by an occupational therapist at an outpatient centre. In this example, the volunteer might supervise the person carrying out civic responsibilities, such as paying household bills.
Our results indicate that for capabilities, evaluation and support services are always offered more frequently than active rehabilitation. When it comes to areas of social participation, however, support services are those most often reported as being available. To our knowledge, no study has documented this previously. It is likely that evaluations related to areas of social participation have been made upon discharge from active rehabilitation or acute care units in preparation for referring clients to the appropriate resources. This could explain the lower response rate for evaluation services in areas of social participation, in which providers often receive clients who have been referred to them and who have presumably already been evaluated. Another explanation could be that the community organizations involved in areas of social participation do not carry out formal or standardized evaluations of the clients that they serve, but simply respond to their needs while ensuring their eligibility. For example, when older people sign themselves up for an adapted recreational activity or request assistance with home-making tasks, these services may be offered without a prior evaluation being necessary.
Somewhat unexpectedly, we observed six regional disparities with respect to active rehabilitation in that the provision of rehabilitation services appeared to be greater in regions embracing rural areas than in the metropolitan region. That there were fewer resources in the metropolitan region does not equate to fewer providers, as the number of providers in the metropolitan region is often greater, given the higher population density. It is plausible, however, that in the metropolitan region, more clients are evaluated by highly specialized providers before returning to their own regions for rehabilitation or support services. This could partly have accounted for the apparently lower active rehabilitation rate that we found. It may also be that the population density in the urban areas and the resulting demands leads rehabilitation units or centres to give priority to evaluation. However, we question the value of assessment if little rehabilitation can be provided. Is this finding a function of the length of stay in the urban metropolitan center and rapid discharge and repatriation to the rural areas? Is the observation that more support is provided in the rural areas related to the time post-stroke and likelihood of further recovery? These data will help to expand the literature, which has not typically considered services as three separate entities of evaluation, active rehabilitation, and support (Grimaud, Jean, & Contandriopoulos, Reference Grimaud, Jean and Contandriopoulos2006; Ministère de la Santé et des Services sociaux, 2007).
In short, the data in our study suggest that the Québec model for budgetary resource distribution in the regions should include indicators based on the nature of the services provided (capabilities, areas of participation) in addition to the indicators showing the frequency and type of resource use by patients with stroke and the number of hours of professional services provided, such as occupational therapy and physical therapy (Comité sur la réévaluation du mode de budgétisation des centres locaux de services communautaires et des centres d´hébergement et de soins de longue durée, 2002).
Our team remains cautious about interpreting the data presented here, which were survey data gathered on services offered and not services used. The results of a study on unmet needs that was conducted at the same time in the same regions (Vincent et al., Reference Vincent, Deaudelin, Robichaud, Rousseau, Viscogliosi and Talbot2007) clearly show that several of the services described in this article, although available, could probably not be provided to clients with stroke and their close caregivers, at the right time, in the right place, or in the right way. Furthermore, although the results of this article show differences among various parameters of the services offered, they do not indicate if the available services are sufficient. An offered service could yet be insufficient in quality or quantity for the population.
This study has a number of strengths as well as certain limitations. It is the first time that a multidisciplinary team has studied the services offered in such detail, based on the international nomenclature of the Disability Creation Process model. The data from this study deal with all the services that should be offered to people with stroke, as seen from two perspectives: first, based on a person’s capabilities and social participation; and second, focusing on evaluation, active rehabilitation, and support services. Another of the study’s strengths lies in comparing services offered in different types of region. Finally, the very high response rate of this survey increases its internal validity.
The weaknesses of this study lie in its cross-sectional design, which does not allow us to affirm the reliability of the data over time. Moreover, the study’s external validity is not optimal, as the data were only collected in 3 of the 18 health regions in the province of Québec (Ministère de la Santé et des Services sociaux, 2007), thereby excluding regions located far from large urban centres, with different social, political, and economic living conditions.
Conclusions
The conclusions of this study should help future resource planning for older individuals who have suffered a stroke. For example, the results of this survey suggest that health urban regions that include rural areas) should question why fewer services for capabilities are offered than in a metropolitan region. Also, why does one health region offer fewer services for two domains of social participation than other regions do? Finally, when a distinction is made among evaluation, rehabilitation, and support services, the metropolitan region should question why fewer rehabilitation services are offered than in the urban-rural regions.
In the context of an increasing incidence of stroke, the results of this study can be used by health care managers to review which rehabilitation needs are not fully met, especially where the services offered must be prioritized. The data in this study break down the offer of services into nine types of personal capabilities and seven areas of social participation, while taking into account services that address evaluation, active rehabilitation, and support in the community. These perspectives allow us to highlight the strengths and weaknesses of the actual coverage of the services offered. Finally, the health care manager benefits from a comparison of the services offered in three distinct health regions covering metropolitan, urban, and rural contexts.