

Satisfaction with democracy is a widely used indicator of citizens’ attitudes toward democratic institutions that taps “evaluations of how the democratic regime works in practice” (Linde and Eckman 2003). Dissatisfaction with democracy undermines conventional forms of political participation (Dalton Reference Dalton2004), and it has the potential to undercut the legitimacy required for democracy to consolidate (Linz and Stepan Reference Linz and Stepan1996). A growing body of research investigates one avenue whereby democratic satisfaction is undermined and demonstrates a robust correlation between high levels of economic inequality and low satisfaction with democracy (e.g., Anderson and Singer 2008; Kang Reference Kang2015). Other research further argues that weak state capacity and poor governance can potentially result in a crisis of representation, characterized by “widespread disillusionment with and rejection of” democratic institutions (Mainwaring Reference Mainwaring2006, 16). Indeed, poor governance quality—that is, a lack of impartiality in the exercise of political authority (Rothstein and Teorell 2008)—is associated with decreased democratic satisfaction not only in Latin America (Weitz-Shapiro Reference Weitz-Shapiro2008) but in new and mature democracies more generally (Anderson and Tverdova Reference Anderson and Tverdova2003).
Scholars posit that citizens’ considerations about distributive fairness are one potential mechanism whereby inequality erodes evaluations of democratic governments (Anderson and Singer 2008, 586; Córdova and Layton 2016; Donovan and Karp 2017, 472). Nevertheless, actual inequality, perceptions of inequality, and perceptions of distributive unfairness are all distinct concepts. This study builds on this body of research by investigating how concerns about fairness and poor governance undermine satisfaction with democracy in Latin America, one of the most unequal regions in the world. Specifically, it examines how citizens’ perceptions of distributive fairness—that is, how fair they perceive the income distribution to be—are related to their evaluations of democracy, and how the context of governance quality in a country conditions this relationship.
When citizens perceive or experience distributive unfairness—for instance, when they perceive their country’s income distribution to be unfair or to objectively disadvantage large segments of society—this signals that part of the democratic process is malfunctioning. As Powers (Reference Powers2001, 203) explains, although most citizens do not evaluate democracy according to their own economic self-interests, material inequalities leave citizens “without the capacity to exercise fully the political rights of [democratic] citizenship.” Yet although distributive unfairness suggests that something in the democratic process is breaking down, when citizens are presented with alternative information that democracy is functioning properly, such as good governance and fair democratic procedures, it suggests that democracy is not to blame for the unfairness that exists in the income distribution. Thus, even in a context of high inequality, the presence of good governance should lead citizens to rely less on their judgments about distributive fairness when evaluating democracy.
This study tests these expectations in Latin America, a region with the highest objective levels of economic inequality in the world. Even in this context of high inequality, Latin America allows the analysis to leverage important variation in individuals’ fairness perceptions and evaluations of democracy within countries, as well as variation in governance quality between countries. A multilevel analysis of Latinobarometer survey data from 18 Latin American countries reveals a robust association between perceptions that income is unfairly distributed and dissatisfaction with democracy. Yet in the presence of good governance (e.g., low levels of corruption, but also electoral accountability and fair and transparent government decisionmaking procedures), the negative relationship between perceived distributive unfairness and democratic satisfaction weakens significantly. In this way, the study demonstrates an important principle of fairness theory: the presence of fair democratic procedures can help mitigate the impact of suboptimal distributive outcomes.
The Sources of Satisfaction with Democracy
Satisfaction with democracy, or support for “how the democratic regime works in practice” (Linde and Eckman 2003), is at low levels in several Latin American countries. Indeed, in the 2018 Latinobarometer survey, more than half the respondents in every county surveyed indicated they were either “dissatisfied” or “very dissatisfied” with their country’s democracy. There remains significant debate about what “satisfaction with democracy” means in terms of support for the political system (e.g., Booth and Seligson Reference Booth and Seligson2009; Canache et al. Reference Canache, Jeffrey and Seligson2001). Although low levels of satisfaction are not considered indicators of what Easton (Reference Easton1975) and others term diffuse support, such evaluations of performance are nonetheless an important object of regime support (Dalton Reference Dalton2004; Norris Reference Norris2011). As such, prolonged periods of dissatisfaction with democracy could undermine democratic legitimacy in the long run.
Research on democratic institutions posits a number of causes of low satisfaction with democracy. One explanation focuses on political institutions and the representative outcomes they produce. Citizens are generally less satisfied when their normative expectations about representation and accountability do not align with actual democratic outcomes (Singh and Carlin 2015). Moreover, democratic legitimacy suffers when citizens are on the losing side of elections (Anderson et al. Reference Anderson, Blais, Bowler, Donovan and Listhaug2005; Singer Reference Singer2018), yet this satisfaction gap between electoral winners and losers is smaller in more proportional systems than in majoritarian ones (Anderson and Guillory Reference Anderson and Guillory1997), as well as when citizens believe that the issues they care about are featured in political discourse (Merkley et al. Reference Merkley, Cutler, Quirk and Nyblade2019). Another explanation focuses on citizens’ evaluations of government performance and suggests that favorable economic outcomes explain evaluations of democracy (Booth and Seligson Reference Booth and Seligson2009; Dalton Reference Dalton2004). In particular, negative evaluations of economic performance have an especially damaging influence on citizens’ evaluations in less consolidated (Dahlberg et al. Reference Dahlberg, Jonas and Holmberg2015) and poorer (Daoust and Nadeau 2020) democracies, or when they believe that individual efforts are insufficient for overcoming their economic problems (Powers Reference Powers2001).
Granted, satisfaction with democracy is driven by evaluations of government outputs; that is, whether or not government is performing relative to people’s normative expectations (Hetherington Reference Hetherington1998). Yet judgments about the fairness of government procedures also shape citizen satisfaction (Hibbing and Theiss-Morse Reference Hibbing and Theiss-Morse2001; Van Ryzin Reference Van Ryzin2011). Citizens are less satisfied with democracy when they live in countries with high corruption (Anderson and Tverdova Reference Anderson and Tverdova2003). By contrast, citizens are more satisfied with democracy when they perceive that elections hold representatives accountable and guarantee that the voices of all voters are represented (Aarts and Thomassen 2008).
A growing body of research also shows that economic inequality is associated not only with decreased satisfaction with democracy (Anderson and Singer 2008) but also decreased support for democracy (Córdova and Seligson Reference Córdova and Seligson2010; Krieckhaus et al. Reference Krieckhaus, Son, Bellinger and Wells2014) and political trust (Córdova and Layton 2016; Zmerli and Castillo 2015). By giving wealthier individuals a disproportionate amount of political influence (Gilens Reference Gilens2012; Taylor-Robinson Reference Taylor-Robinson2010), economic inequality violates the key democratic principle of one person, one vote. In this way, objective economic inequality certainly shapes citizens’ evaluations of democratic governments.
Yet when it comes to satisfaction with democracy, I argue that citizens’ perceptions of distributive fairness—that is, how fair they perceive the income distribution to be—will have an impact above and beyond actual or perceived levels of inequality. From a conceptual standpoint, actual inequality at the country level, perceptions of income distribution, and citizens’ concerns about distributive fairness are all distinct. Past research attempts to understand the difference between actual and perceived levels of inequality and finds that individuals have a difficult time processing or understanding a highly skewed income distribution (Osberg and Smeeding 2006). Yet whereas a disjuncture between the first two concepts is a matter of objective knowledge, a gap between actual inequality and perceived distributive fairness is a matter of normative concerns, psychological reference points, and even national culture. For instance, recent experimental research finds that individuals are more likely to legitimate income differences as inequality itself increases (Trump Reference Trump2018). Moreover, as this article will argue, individuals’ own ideologies, as well as their interactions with the state, also determine the extent to which people’s perceptions of distributive unfairness undermine satisfaction with democracy.
Linking Distributive Unfairness to Satisfaction with Democracy
Inequality challenges a fundamental human motivation: the desire to live in a just world (Lerner and Miller Reference Lerner and Miller1978). Classic political economy models assume that under democracy, the poor will demand wealth redistribution, thus decreasing economic inequality (Meltzer and Richard Reference Meltzer and Richard1981). An implication of this conventional wisdom is that certain groups of people (i.e., the poor) dislike inequality, and they dislike it as a matter of resource attribution: resources are finite, economic resources are concentrated in the hands of the rich, and the poor want a larger share of these economic resources. Under a democratic system, in which the poor far outnumber the rich, one might expect the system to produce equitable outcomes that reflect the economic self-interest of the majority and that ordinary citizens perceive as fair. Nevertheless, existing research suggests that the poor do not frequently demand redistribution, perhaps because some poor citizens do not see a relationship between their microlevel economic conditions and macrolevel political forces (Powers Reference Powers2001).
Objective levels of inequality should certainly shape citizens’ satisfaction with democracy, as previous research demonstrates they do (Anderson and Singer 2008; Kang Reference Kang2015). Inequality creates opportunities for wealthier individuals to exercise disproportionate political influence (Gilens Reference Gilens2012; Taylor-Robinson Reference Taylor-Robinson2010), which, in turn, results in democratic outcomes that do not represent the substantive policy interests of the majority of citizens. Moreover, low levels of redistribution or redistributive capacity—such as are common across Latin America (Bogliaccini and Luna Reference Bogliaccini, Luna and Gustavo2019)—hinder democratic government’s ability to provide goods and services, which, in turn, leads to negative political evaluations (Bratton and Mattes 2001; Mishler and Rose 2001).
Yet when it comes to satisfaction with democracy, citizens’ perceptions of distributive (un)fairness are equally key. For example, inequality advantages certain groups in society at the expense of others. There are ample historical examples of Latin American elites’ using the political system to maintain the status quo, thereby safeguarding their social status and economic interests (O’Donnell et al. Reference O’Donnell, Schmitter and Whitehead1986). Meanwhile, the vast majority of citizens in Latin America do not stand to benefit from persistently high levels of inequality and should be primed to respond negatively to a skewed economic distribution because it does not serve their self-interest. Research on economic development and health outcomes in Latin America finds, for instance, that inequality mitigates, or in some instances completely nullifies, the positive relationship between GDP per capita and life expectancy (Biggs et al. Reference Biggs, King, Basu and Stuckler2010).
It is perhaps not controversial to expect that higher-status groups would be more likely to legitimate inequality and perceive it as fair. Nevertheless, research on social psychology and system justification suggests that low-status individuals’ normative reactions to perceiving or experiencing inequality may, at times, not reflect their objective self-interest. System justification—or the adoption of legitimizing stereotypes that justify the status quo differences between groups in society (Cassese and Holman Reference Cassese and Holman2019; Kay and Jost Reference Kay and Jost2003; Tyler Reference Tyler2006)—can take many forms, from justifying economic inequality as natural (Jost and Thompson Reference Jost and Thompson2000) to espousing the belief that economic well-being is an indicator of personal deservingness (Jost et al. Reference Jost, Pelham, Oliver and Bilian2003) and hard work (Jost and Hunyady Reference Jost and Hunyady2003).
Although advantaged groups rely on system-justifying ideologies to legitimate their privileged positions, lower-status individuals also engage in system justification (Jost and Hunyady Reference Jost and Hunyady2005). For instance, certain groups of women are consistently shown to endorse sexist ideologies (Cassese and Barnes Reference Cassese and Barnes2019; Barnes et al. Reference Barnes, Beaulieu and Saxton2020), and some members of the working class adopt conservative ideologies that are naturally antagonistic to labor rights and economic equality (Jost Reference Jost2017). And for disadvantaged groups like the poor, endorsement of system-justifying ideologies serves to reduce frustration and emotional distress (Waksalk et al. Reference Waksalk, Jost, Tyler and Chen2007), thereby enhancing the perceived legitimacy of political authorities and institutions.
Latin America provides ample evidence that the vast majority of citizens believe that government should enact firm policies to reduce inequality (Morgan and Kelly Reference Morgan and Kelly2016). The argument developed thus far suggests that inequality harms satisfaction with democracy because it challenges people’s normative expectations about the outcomes that democracy is supposed to produce, but also that people respond to the same level of inequality differently when making judgments about distributive fairness. In this sense, because certain groups engage in system justification meant to legitimate economic differences, people’s perceptions of distributive fairness, in addition to actual or perceived levels of inequality, are another important determinant of satisfaction with democracy. When people perceive distributive unfairness resulting from the inaction of democratic governments, their satisfaction with democracy is likely to suffer. They are expressing an evaluation that inequality is not benefiting them personally, or that it is counter to the interests of large segments of the population, and hence does not reflect the type of outcome that a well-functioning democratic process should produce.
An observable implication of this argument is that even in a context of high inequality, satisfaction with democracy should be lowest among those citizens who perceive high levels of distributive unfairness in society. This yields the following hypothesis:
Hypothesis 1. On average, perceived distributive unfairness will be associated with decreased satisfaction with democracy.
Perceived Distributive Unfairness in a Context of Good Governance
The foregoing argument and hypothesis posit that citizens’ evaluations of distributive unfairness are an important factor shaping their satisfaction with democracy. Yet the context in which individuals draw on perceptions of distributive outcomes also affects how much perceived distributive unfairness undermines satisfaction with democracy. Specifically, insights from social psychology suggest that good governance—for example, impartiality in the exercise of political authority (Rothstein and Teorell 2008)—affects how citizens use their judgments about distributive fairness to evaluate democracy. In addition to concerns about the fairness of outcomes, people care deeply about the procedures by which political outcomes are produced (André and Depauw 2017; Clayton et al. Reference Clayton, O’Brien and Piscopo2019; Hibbing and Theiss-Morse Reference Hibbing and Theiss-Morse2001; Magalhães Reference Magalhães2016; Van Ryzin Reference Van Ryzin2011). In particular, good governance, which some scholars have referred to as procedural fairness (Linde Reference Linde2012), should diminish the extent to which distributive unfairness erodes satisfaction with democracy, even in the face of economic inequality.
Individuals often draw on multiple sources of information when forming their evaluations of democracy (André and Depauw 2017). Indeed, past research on fairness heuristic theory suggests that citizens’ desire for government processes and procedures to match their normative expectations of what processes should be (Hibbing and Theiss-Morse Reference Hibbing and Theiss-Morse2001)—fair, transparent, honest, and equitable—may take precedence over perceptions of distributive outcomes when individuals are evaluating democracy. In this sense, concerns about distributive unfairness undermine satisfaction with democracy because they signal that democracy is not producing outcomes that benefit the majority of citizens.
Yet because citizens place a premium on procedural fairness (Van Ryzin Reference Van Ryzin2011), good governance provides stronger and alternative, albeit conflicting, signals that democracy is indeed functioning properly, thus mitigating citizens’ concerns about distributive unfairness. In this sense, citizens can still be expected to draw on multiple sources of information when evaluating how well their democracy is functioning (André and Depauw 2017; Córdova and Layton 2016), but because they place a premium on the fairness of democratic procedures, good governance should weaken the negative relationship between perceived distributive unfairness and satisfaction with democracy.
At the same time, I also expect the converse to be true. Poor governance, or the lack of fair and impartial procedures, should compound the negative influence of perceived distributive unfairness on satisfaction with democracy. In a context of poor governance, when individuals who perceive distributive unfairness receive yet another signal that democracy is not living up to their normative expectations, they should be less likely to believe that democracy is the most legitimate vehicle for addressing inequities in society, and they should be even less satisfied with the way their country’s democracy is functioning.
The above argument posits that good governance provides citizens with important information about whether or not the democratic system is functioning in line with their normative expectations. In this sense, the arguments about the moderating effect of good governance are filtered through citizens’ perceptions of good governance. There are also a number of structural benefits associated with good governance that citizens may or may not consciously perceive and that still should affect the extent to which perceived distributive unfairness undermines democratic satisfaction.
In addition to impartiality in the exercise of power (Rothstein and Teorell 2008), state capacity is another important dimension of many definitions of good governance (Kaufmann et al. Reference Kaufmann, Kraay and Mastruzzi2011). States with higher capacity are more likely to have positive interactions with citizens across a variety of policy domains (Luna and Soifer 2017), leading to enhanced satisfaction with democratic performance and distributive outcomes (Harbers Reference Harbers2015). Shepherd (Reference Shepherd2000), for instance, explains that people who are disadvantaged the most by suboptimal distributive outcomes (e.g., the poor) are the ones who stand to benefit from good governance. Not only does bolstering governance quality improve people’s access to inequality-reducing social programs and increase the efficiency of these programs, but these benefits are likely to accrue whether or not individuals are aware of the true extent of governance quality in their country. Recent work on pro-egalitarian policy reforms further suggests that good governance bolsters citizens’ confidence that democratic governments can effectively implement said policies (Barnes and Córdova Reference Barnes and Córdova2016). In this sense, citizens may certainly perceive distributive unfairness, but in a context of good governance, their concerns about distributive unfairness should be allayed as they perceive a well-functioning democracy as the most legitimate vehicle for addressing societal inequalities.
Hypothesis 2. Good governance will mitigate the negative relationship between perceived distributive unfairness and satisfaction with democracy.
Evaluating the Relationship Between Fairness Perceptions and Satisfaction with Democracy
The dependent variable in this analysis is Satisfaction with democracy. Satisfaction with democracy represents an important dimension of political support (Norris Reference Norris2011) and taps citizens’ evaluations of “how the democratic regime works in practice” (Linde and Ekman 2003). To measure satisfaction with democracy, Latinobarometer asks respondents, “In general, would you say that you are very satisfied, quite satisfied, not very satisfied, or not at all satisfied with the working of democracy in your country?” Responses in the analysis are coded “not at all satisfied” (1), “not very satisfied” (2), “quite satisfied” (3), and “very satisfied” (4). When pooling data across country-year surveys, the average response to this question is 2.4 and the modal response is 2 (“not very satisfied”), although satisfaction with democracy varies considerably across Latin American countries.
Independent Variables
Perceptions of distributive unfairness
The primary individual-level predictor of satisfaction with democracy, perceptions of distributive unfairness, is based on the Latinobarometer question, “How fair do you think the income distribution is in your country?” This survey item is ideal for the research at hand: it maps onto the core theoretical concept—that is, fairness perceptions, as opposed to assessments or evaluations of actual inequality—remarkably well. Cross-national public opinion surveys frequently ask respondents whether they think the gap between the rich and the poor is getting bigger or smaller, but just because individuals perceive inequality to be on the rise, they will not necessarily respond negatively to it (Trump Reference Trump2018). Latinobarometer is one of the few surveys that consistently asks this question about distributive fairness perceptions. Responses range from “very fair” (coded 1) to “very unfair” (4), and the mean and modal response to this question is 3 (“unfair”).
Governance quality
I also hypothesize that governance quality should ameliorate the negative influence of perceived distributive unfairness on satisfaction. The empirical analysis tests the moderating effect of governance quality in two ways. First, it relies on a series of Latinobarometer questions concerning individuals’ perceptions of governance quality. This approach is important for a number of reasons. Although several structural benefits are associated with good governance that citizens may not consciously perceive, many of the arguments presented in this article are filtered through citizens’ perceptions of governance quality in their country. To test only the argument that governance quality conditions the relationship between perceived distributive unfairness and satisfaction with democracy using a macroindicator of governance quality risks making an ecological fallacy. By also using an individuallevel indicator of governance quality, the analysis can test whether the dynamics observed at the macrolevel map onto microlevel dynamics in the way that I theorize.
Two different measures of corruption perceptions are used to capture the individual-level dynamics of the arguments. Although the macroindicator described below captures a broader conception of governance quality, corruption is a particularly salient indicator that affects judgments about procedural fairness. The first question, which was included in all three Latinobarometer waves in the analysis, asks, “How much progress do you think there has been in reducing corruption in state institutions over the past two years? A great deal (coded 1), Some (2), A little (3), or None (4).” The second question arguably better captures citizens’ perceptions of governance, as it taps a context that profoundly shapes political orientations, the neighborhood (Córdova and Layton 2016). Unfortunately, this question was asked only in the 2013 Latinobarometer survey. It asks, “How widespread do you think corruption and bribe taking are in your local/municipal government? Is hardly anyone involved (coded 1), not a lot of officials are corrupt (2), most officials are corrupt (3), or almost everyone is corrupt (4).” Responses to both questions are recoded in the analysis such that higher values indicate better perceptions of governance quality.
The second test of the moderating effect of governance quality is to operationalize the concept using several measures from the World Bank’s Worldwide Governance Indicators project (WGI, Kaufmann et al. Reference Kaufmann, Kraay and Mastruzzi2011). Specifically, it relies on measures of control of corruption, voice and accountability, rule of law, and government effectiveness. Each WGI indicator ranges approximately from –2.5 to 2.5, with higher values indicating better governance quality, and zero representing a standardized global mean.Footnote 1
Instead of testing the effects of each of these potentially imprecise proxies for governance quality separately, I use these four indicators to create an indexed measure of governance quality by averaging the separate measures for each corresponding country-year. Factor analysis demonstrates that each governance indicator loads strongly onto a common underlying dimension, and they have a high scale reliability coefficient (a = .97). Table B1 and figure B1 of the online appendix also show that the main results are robust to modeling each governance quality proxy separately.Footnote 2
Control Variables
To control for potential sources of spuriousness, the analysis includes a number of individual-level variables that existing research consistently shows to be important predictors of satisfaction and that theoretically could correlate with perceptions of distributive unfairness, particularly Support for the incumbent government and Perceptions of the national economy. Individuals who approve of the incumbent and express favorable evaluations of the economy are more likely to positively evaluate the political system (e.g., Anderson et al. Reference Anderson, Blais, Bowler, Donovan and Listhaug2005; McAllister Reference McAllister and Norris1999), and these individuals could be less likely to blame the government for unfavorable distributive outcomes.
Support for the incumbent comes from the question, “Do you approve or not of the performance of the government led by President (name)?” Responses are coded such that 0 = Disapprove and 1 = Approve. Perceptions of the national economy comes from the question, “Do you consider the country’s present economic situation to be better (coded 1), a little better (2), the same (3), a little worse (4), or much worse (5) than 12 months ago?” Responses are reverse-coded in the analysis so that higher values reflect positive evaluations. I also control for political ideology: “In politics, people normally speak of ‘left’ and ‘right.’ On a scale where 0 is left and 10 is right, where would you place yourself?” Footnote 3 To rule out the possibility that socioeconomic factors are driving both satisfaction with democracy and perceptions of distributive unfairness, I control for wealth quintile (Córdova Reference Córdova2009) and education, as well as respondent’s sex, subjective social class, age, and whether the respondent lives in a rural area.Footnote 4
In addition to individual-level covariates, I control for factors at the country level that could theoretically correlate with fairness perceptions and satisfaction, particularly aggregate levels of inequality. Although the focus here is on how fair the income distribution is perceived to be, as opposed to objective levels of inequality, there is reason to suspect that aggregate inequality could affect both perceptions of distributive unfairness (Trump Reference Trump2018) and satisfaction with democracy (Anderson and Singer 2008). To account for this possibility, the analysis includes a measure of net national-level income inequality from the Standardized World Income Inequality Database (Solt Reference Solt2020). Inequality figures represent the most recent available Gini coefficients before the survey year. Also, given that recent research has shown that the level of government involvement in the economy conditions the relationship between citizens’ economic evaluations and satisfaction with democracy (Tang and Huhe 2020), a control is included from the Fraser Institute’s Economic Freedom of the World (Vásquez and McMahon 2020) that captures the extent of the government’s economic engagement (higher values correspond to less engagement).
Earlier research has also shown that political party fragmentation could theoretically drive both perceptions of fairness and satisfaction with democracy. Voters tend to be less satisfied with democracy when there are too many parties in government (Anderson et al. Reference Anderson, Blais, Bowler, Donovan and Listhaug2005; Christmann and Torcal 2018), as this can lead to inefficiencies in policymaking and erode clarity of responsibility. To account for political party fragmentation, I control for the effective number of political parties (ENPP) in the legislature. ENPP figures come from the Democratic Electoral Systems dataset (Bormann and Golder 2013). Last, I control for age of democracy by including a measure of the number of years a country has continuously had a Polity score of 6 or greater. Previous research has shown that satisfaction with democracy is higher in older democracies (Magalhães Reference Magalhães2016) and that the age of the democracy affects how citizens respond to government outputs and procedures when evaluating democratic performance (Dahlberg et al. Reference Dahlberg, Jonas and Holmberg2015).Footnote 5
Previous research has also shown that women’s presence in government is associated with lower levels of corruption—that is, better governance (Esarey and Schwindt-Bayer Reference Esarey and Schwindt-Bayer2018)—and is associated with satisfaction with democracy (Schwindt-Bayer Reference Schwindt-Bayer2010). As such, appendix table B2 demonstrates that the results are robust when controlling for the percentage of women in the legislature. Additionally, given that the democratic context in a country could affect individuals’ evaluations of how well democracy is performing, table B2 estimates a model controlling for a country’s Freedom House political rights score.
Methodology
To test the hypotheses, a multilevel analysis was conducted of responses from three different waves of the Latinobarometer survey, covering 18 Latin American countries from 2011 to 2015.Footnote 6 Given the nested nature of the survey data, with individuals (level 1) nested within surveys (level 2) nested within countries (level 3), a multilevel model is appropriate. However, given that there are only 18 observations at the highest level, modeling country-level effects presents its own problems, such as biased confidence intervals and cross-level interaction estimates (Stegmueller Reference Stegmueller2013). Instead of a three-level model with only 18 observations at the country level, the main analysis uses a two-level model, in which individuals are nested within 54 country-waves. Also included is a random slope for the individual-level independent variable, perceived distributive unfairness, in all the models.Footnote 7 Appendix table B4 shows that the results do not hinge on this modeling choice. Appendix table B5 also demonstrates that the results are robust to modeling fixed effects for country and survey-year.
Results: Who Perceives Distributive Unfairness in Latin America?
Before discussing results of the multilevel analysis, I examine variation in the primary independent variable, perceptions of distributive unfairness. Although this analysis takes individuals’ perceptions of distributive fairness as a starting point, the aforementioned arguments suggest that people’s political ideologies, socialization, and even social standing can play an important role in determining how inequalities in society translate into fairness judgments. Recall that although inequality disadvantages the vast majority of citizens in Latin America, research on system justification theory suggests that both the rich and the poor rely on a variety of system-legitimizing narratives in responding to social inequalities they perceive or experience. While the rich engage in system legitimization to justify an economic status quo that objectively benefits them, the poor endorse similar ideologies in an effort to reduce distress and frustration.
To investigate whether aggregate levels of inequality map onto fairness perceptions differently depending on an individual’s socioeconomic standing, the study examines the relationship between inequality and perceived unfairness across country-years in the main analysis, for different self-reported social classes. Table B3 in the online appendix includes a multilevel model predicting perceived unfairness with a cross-level interaction between inequality and subjective social class. Since the interaction terms in table B3 are statistically significant, the change in the probability of saying the income distribution is “very fair” and “very unfair” when moving from the lowest to the highest level of inequality in the sample is plotted for each self-reported social class. Figure B2 includes a histogram of perceived distributive unfairness for each class group.
Figure B2 also shows that the significant interaction between class and inequality in table B3 is largely driven by upper-class individuals’ assessments. Overall, actual levels of inequality do not affect most social classes’ assessments of distributive fairness, although it is important to recall that income inequality is high by global standards in all countries in the analysis. These findings suggest that plenty of lowerstatus individuals justify large income differences, at least with regard to evaluating distributive fairness. Similarly, well-off respondents who objectively benefit from inequality can nonetheless perceive that income distribution as unfair. Given that significant numbers of individuals across social classes express this perception, the analysis next examines the relationship between perceived distributive unfairness and satisfaction with democracy.
Perceived Distributive Unfairness and Satisfaction with Democracy
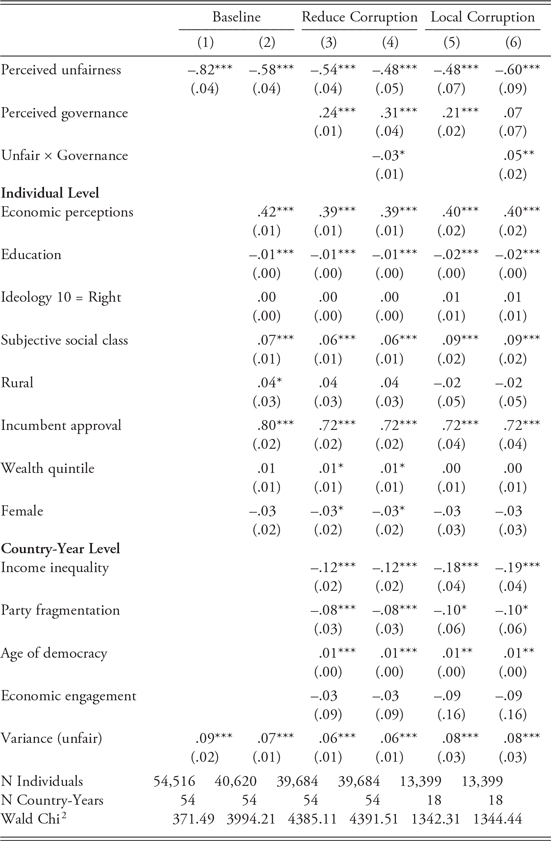
Model 1 in table 1 shows the bivariate relationship between perceived distributive unfairness and satisfaction with democracy. Model 2 presents a baseline model without any higher-order covariates or interactions.
Perceived Unfairness and Satisfaction, Governance Perceptions

*p < .10, **p < .05, ***p < .01 (standard errors), multilevel ordered logit coefficients. Estimated in Stata 15.1.
The first thing to notice in models 1 and 2 is that the variable for perceived distributive unfairness has a negative and statistically significant coefficient. Models 3 through 6 introduce the two individual-level measures of governance quality perceptions, as well as the higher-level covariates. Models 3 and 4 account for citizens’ evaluations of whether the government has reduced corruption in state institutions. Models 5 and 6 include the question about perceptions of bribery and corruption in local government. Together, the results in table 1 provide support for hypothesis 1, that perceptions of distributive unfairness are associated with dissatisfaction with democracy.
In both of the noninteractive models accounting for perceptions of governance quality, the coefficient for perceived distributive unfairness is negative and statistically significant. The coefficient of the interaction term in the Reduce Corruption model is significant at p =.07 and in the Local Corruption model at p <.05. Nevertheless, scholars remind us to exercise caution when interpreting the signs or significance levels of interaction terms and their constituent parts. Therefore, figure 1 provides a graphical interpretation of these interactions as a test of hypothesis 2, that good governance will mitigate the negative impact of perceived distributive unfairness on satisfaction with democracy.
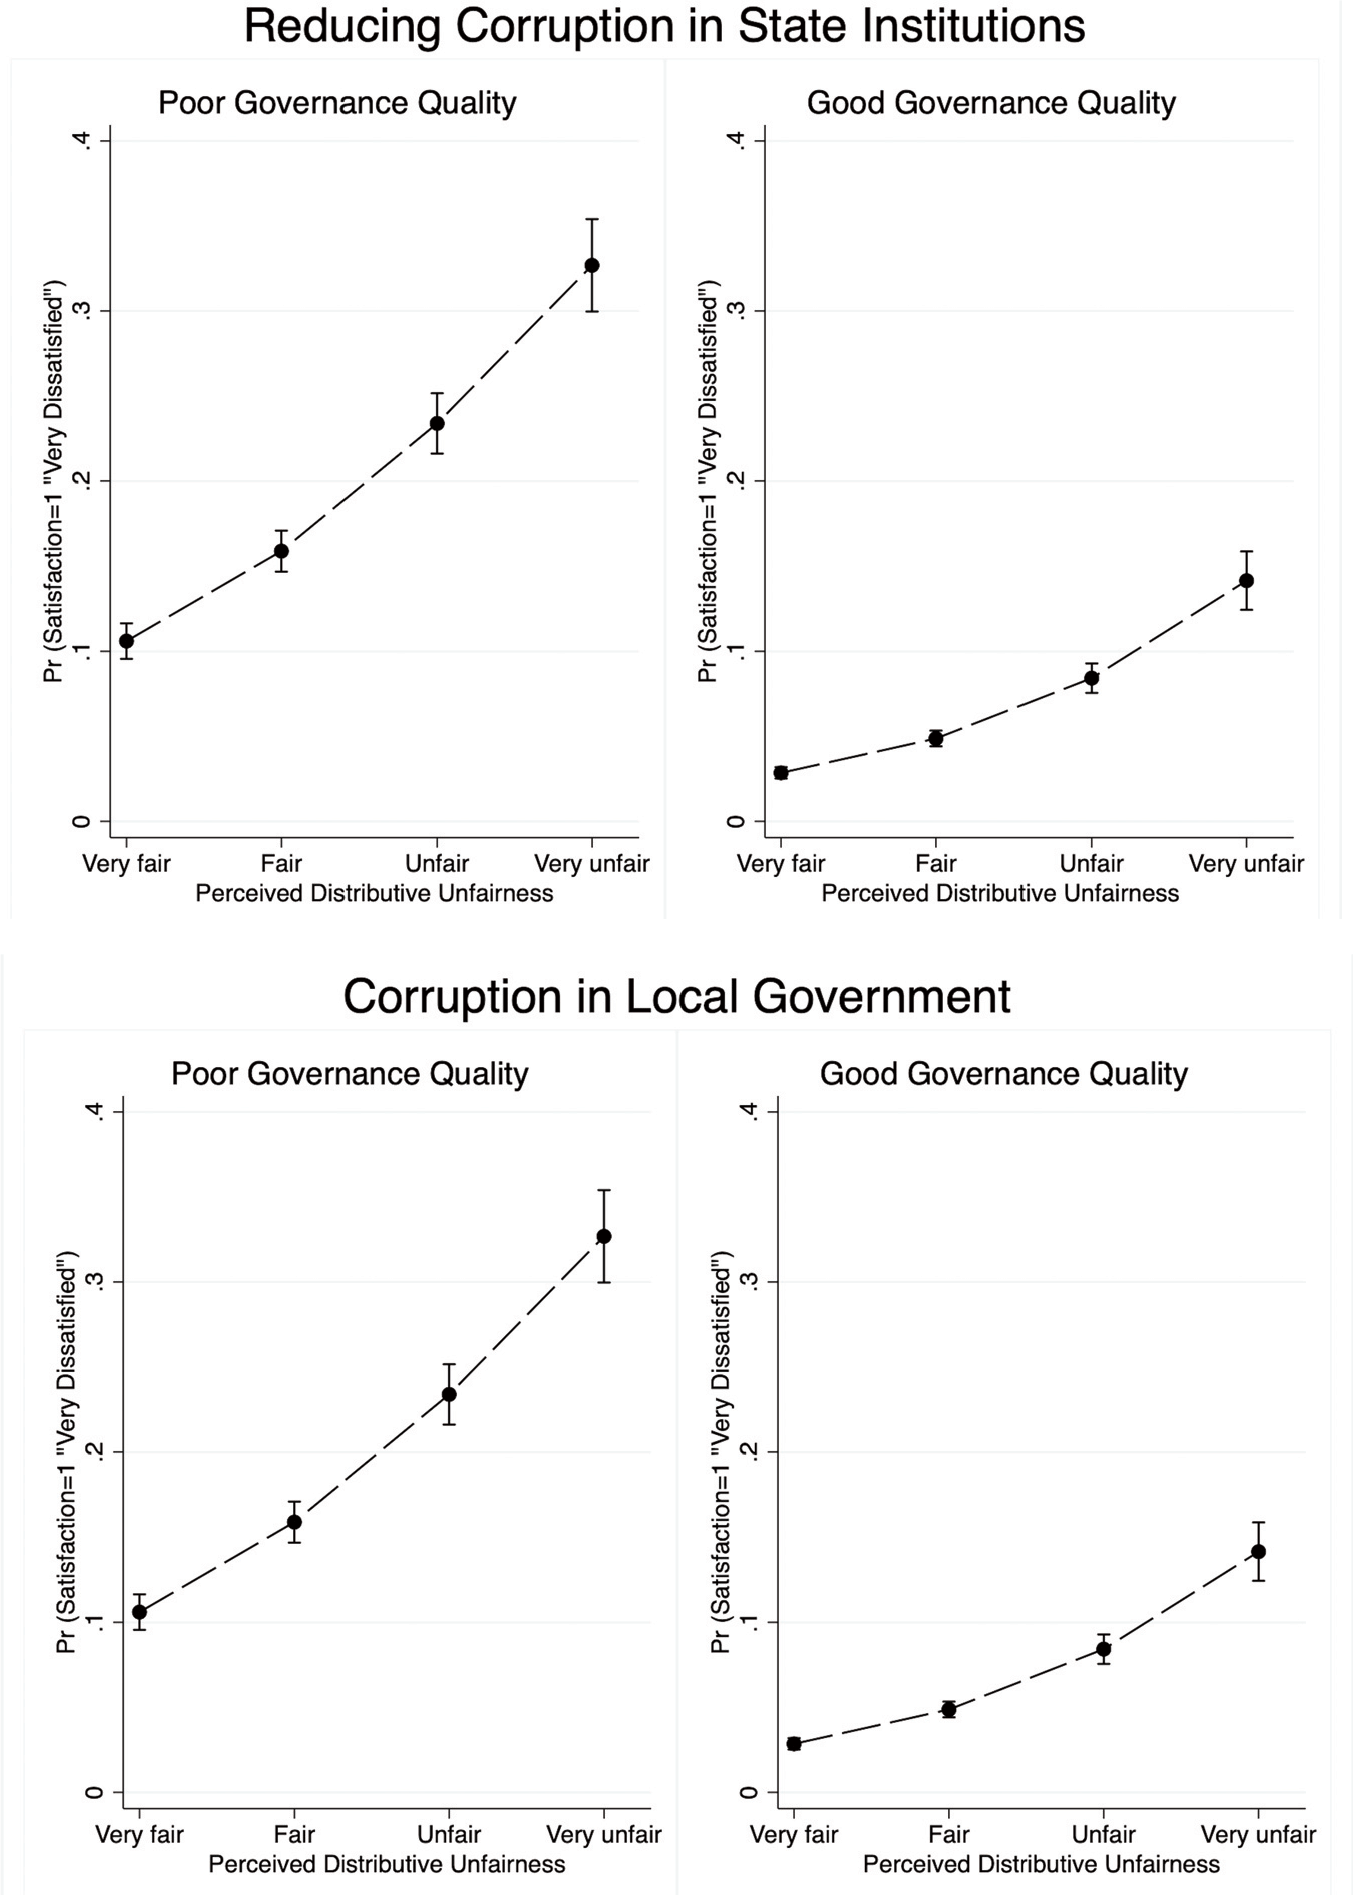
The top panel of figure 1 depicts the relationship between perceived unfairness and dissatisfaction with democracy by plotting the predicted probability that an individual will be “very dissatisfied” (outcome 1) for individuals who perceive no progress in reducing corruption (left panel) compared to “a great deal” of progress (right panel). Consistent with hypothesis 1, the top panel of figure 1 depicts an erosion of democratic satisfaction as perceived distributive unfairness increases, on average, regardless of individuals’ perceptions of governance quality. However, and consistent with hypothesis 2, this pattern is most pronounced among individuals who perceive poor governance quality. Among individuals who perceive good governance, predicted dissatisfaction increases more gradually as citizens perceive their country’s income distribution to be increasingly unfair.
Distributive Unfairness, Perceived Governance Quality, and Dissatisfaction with Democracy
Note: Predicted probability of being “very dissatisfied” with democracy among individuals who perceive poor and good governance quality. Estimates were calculated using the interactive models in table 1. Bars indicate whether predicted probabilities differ at the 95 percent confidence level.

The bottom panel in figure 1, which accounts for perceptions of corruption and bribery in local government, depicts a similar pattern. Among individuals who perceive a lot of corruption, the probability of being “very dissatisfied” increases from .10 for “very fair” perceptions to .33 for “very unfair” perceptions, or a difference of .23 (p < .01). Among individuals who perceive good governance, however, as indicated by perceiving a lack of corruption in local government, the direction of this relationship is the same, but the magnitude is only .09 (p < .01).
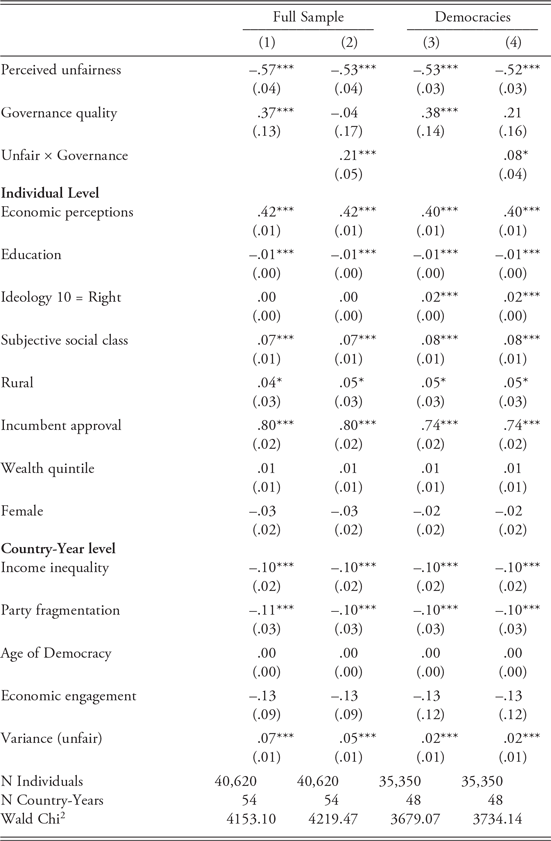
Although the arguments about governance quality’s moderating effect are largely filtered through citizens’ perceptions, recall that governance quality also has a number of structural benefits that citizens may not consciously perceive. Therefore, hypothesis 2 is tested using a macroindicator of governance quality that is measured at the country level (table 2). Models 1 and 2 include the full sample of country-years, and models 3 and 4 exclude nondemocracies from the sample.Footnote 8 Consistent with the results in table 1, the coefficient for perceived distributive unfairness is negative and significant in both of the noninteractive models. In substantive terms, when individuals perceive their country’s income distribution as “very fair,” they have about a .06 probability of being “very dissatisfied” with democracy and a .23 probability of being “very satisfied” (full sample, model 2). Conversely, individuals viewing their country’s income distribution as “very unfair” have about a .26 probability of being “very dissatisfied” with democracy and a .07 probability of being “very satisfied.”
Perceived Unfairness and Satisfaction, Macro Governance Indicator

*p < .10, **p < .05, ***p <.01 (standard errors), multilevel ordered logit coefficients. Estimated in Stata 15.1.
The interaction term in model 2 is significant (p < .01), but it is significant at p < .10 only in the model that excludes nondemocracies. This suggests the need for a more nuanced interpretation so as to not overstate governance quality’s conditioning potential. The weakening interaction effect when nondemocracies are excluded from the analysis suggests that poor governance magnifies the effect of perceived distributive unfairness moderately, but the effect becomes more magnified when democratic governance is extremely poor.
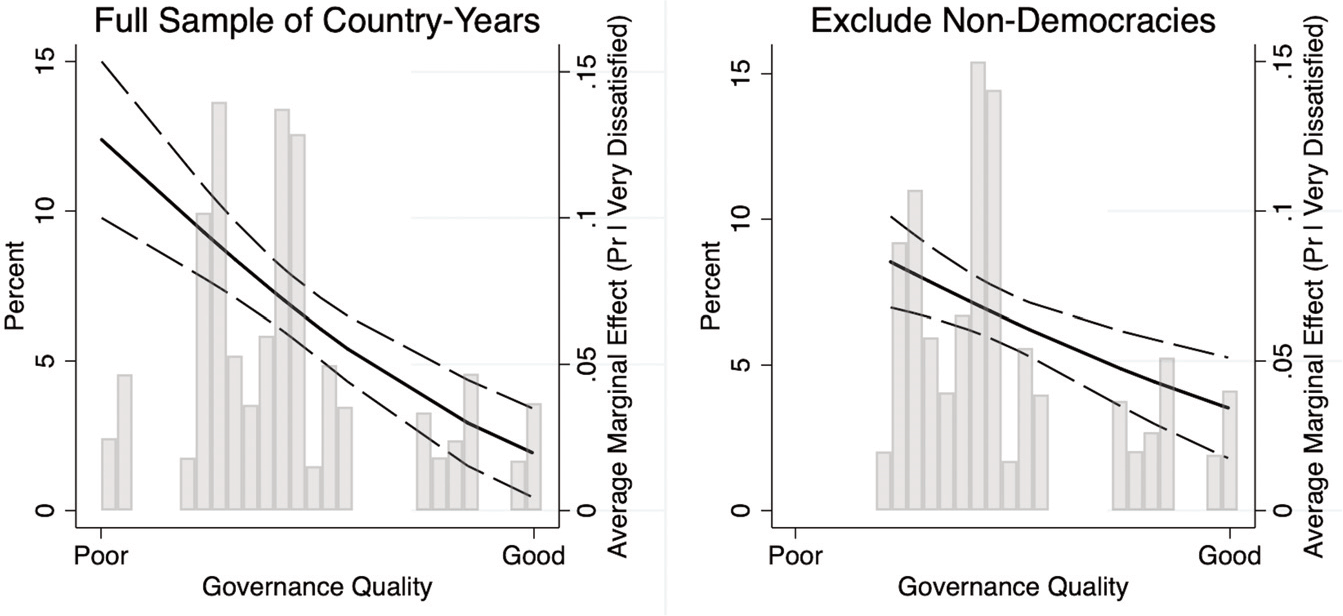
Figure 2 uses the results in models 2 and 4 of table 2 to calculate and plot the marginal effect of perceived distributive unfairness on the probability of being “very dissatisfied” (satisfaction = 1) across the range of governance quality values.Footnote 9 The marginal effect estimates are overlaid with a histogram showing the distribution of governance quality values in each respective sample. If hypothesis 2 is correct, we can expect to observe positive marginal effects estimates in general (H1—that is, more perceived unfairness is associated with more dissatisfaction), but the marginal effects estimates should become less positive as governance quality improves. Indeed, this is exactly what figure 2 shows for both the full sample of country-years (left panel) and the sample that excludes nondemocracies (right panel). Nevertheless, the magnitude of this conditional effect weakens when nondemocracies are excluded from the analysis. In the full sample, moving from the lowest to the highest governance quality values (–1.41 to 1.33) is associated with a .11 decrease in the marginal effect.
In the reduced sample that excludes nondemocracies, a similar pattern emerges, albeit less dramatically. At the lowest value of governance quality in this sample (–.85), the marginal effect of an increase in perceived distributive unfairness on the probability of being “very dissatisfied” with democracy is .08. At the highest value of governance quality (1.33), however, the marginal effect estimate weakens to .03, still positive but significantly less positive than at low levels of governance quality. This difference in the reduced sample is still statistically significant (p < .01) and consistent with hypothesis 2 but is nonetheless weaker than in the sample that includes nondemocracies. Stated differently, perceiving the income distribution as increasingly unfair is associated with an increased probability of being dissatisfied with democracy. Moreover, the context in which people use their fairness judgments to inform their political evaluations matters a great deal for whether or not perceived distributive unfairness will be associated with dissatisfaction. Yet extremely poor governance quality magnifies the relationship between perceived distributive unfairness and dissatisfaction with democracy the most.
Perceived Unfairness and Democratic Dissatisfaction in Contexts of Poor and Good Governance
Note: Average marginal effect of an increase in perceived distributive unfairness on the probability of observing the “very dissatisfied” outcome (coded 1) across the range of governance quality values in the sample. Dashed lines indicate 95 percent confidence intervals. Figures were calculated using the results in table 2, models 2 and 4.

Discussion and Conclusions
Satisfaction with democracy is at troublingly low levels and has been steadily declining during the last decade in a number of Latin American countries. This article argues that citizens become dissatisfied with democracy when their normative expectations about what democracy should produce do not align with the distributive outcomes they experience in practice. When citizens perceive distributive outcomes to be unfair, they should be less satisfied with the way democracy functions in their country. Yet previous research shows that citizens draw on multiple sources of information when evaluating democracy, including information about government performance, as well as about the fairness of democratic processes and procedures (Córdova and Layton 2016; Magalhães Reference Magalhães2016; Van Ryzin Reference Van Ryzin2011). Even in the face of inequality, when citizens observe alternative information that democracy is functioning properly, such as the presence of good governance and procedural fairness, their concerns about distributive unfairness should be allayed.
This analysis demonstrates that citizens’ perceptions that income is unfairly distributed in their country are negatively and significantly associated with democratic satisfaction. It also shows that although perceptions of distributive unfairness are associated with lower democratic satisfaction for all citizens, on average, as governance quality improves, the negative relationship between perceptions of distributive unfairness and satisfaction with democracy weakens as well. Nevertheless, this conditional relationship appears to be largely driven by countries with extremely poor democratic governance, which is arguably not fully representative of the Latin American experience. This suggests that when countries like Venezuela experienced democratic setbacks, citizens may have been generally dissatisfied, but those who perceived the economic distribution as becoming fairer under leftist leaders such as Hugo Chávez were relatively satisfied with democracy, even as democracy faltered.
Although the results presented here support my theoretical arguments and hypotheses, it is important to note that these analyses are preliminary and suggestive and not confirmatory. As with any study using an observational research design to investigate how one attitude relates to another, it is often difficult to disentangle the causal direction. Indeed, it is important to note that the interaction between perceived distributive unfairness and governance quality could be explained by alternative theoretical approaches. The arguments developed here, which are empirically supported, suggest that good governance mitigates citizens’ concerns about inequality and distributive unfairness when it comes to evaluating democracy. However, it is also possible that perceptions of distributive fairness could mitigate citizens’ concerns about governance quality. Zechmeister and Zizumbo-Colunga (2013) find, for instance, that individuals who espouse subjectively positive economic evaluations are more likely to discount corruption when it comes to presidential approval. Future research, including the use of experimental methods, could shed further light on the mechanisms that explain the empirical findings in this and other studies.
Poverty, inequality, and distributive unfairness are widespread problems that have the potential to undermine not only satisfaction with democracy, but also political engagement and participation (Solt Reference Solt2008). People care a great deal about fairness, and when they perceive patently unfair outcomes, such as an unfair distribution of wealth or income, they are less likely to be satisfied with their democratic government. On the one hand, this may be troubling for the prospects of democracy in regions such as Latin America: despite some recent declines in inequality, citizens across Latin America overwhelmingly perceive their countries’ income distributions as unfair. As this research shows, high levels of perceived distributive unfairness harm satisfaction with democracy, and thus undermine the widespread democratic “buy-in” that is crucial for democracy to consolidate (Linz and Stepan Reference Linz and Stepan1996).
Yet these findings also provide some room for optimism, and they speak to broader themes in the literature on governance quality more generally. By delivering quality governance—for instance, by combating corruption—political authorities in democracies can effectively offset the negative influence of perceived distributive unfairness on satisfaction with democracy, even in a context of high inequality.
One way to effectively combat corruption is to enhance political accountability. A study of local governments in Brazil, for instance, found significantly less corruption in municipalities where mayors were eligible for re-election (Ferraz and Finan 2011). Beyond bolstering satisfaction with democracy, low corruption signals to citizens that government is not dominated by elites, that the democratic process is functioning properly, and that policies are being made and administered via fair, impartial, and transparent procedures. In sum, democratic governments and political elites can foster accountability, transparency, and the rule of law. When fair procedures for governing are in place, citizens may still perceive unfair distributive outcomes, but they are also likely to believe that democracy is the most legitimate vehicle for addressing their country’s most pressing concerns.
Supporting Information
Additional supporting materials may be found with the online version of this article at the publisher’s website: Appendix.