





Introduction
Revenue from digital agriculture, which encompasses artificial intelligence and machine learning, was projected to reach $15.3 billion by 2025, while the global robotics market is expected to reach $16.6 billion in 2026 (Gupta and Gupta, Reference Gupta, Gupta, Priyadarshan, Jain, Penna and Al-Khayri2024). Digital agriculture uses digital technologies and data to increase agricultural productivity, improve value chain efficiency, and support decision-making. It includes tools such as geospatial data, the Internet of Things, Artificial Intelligence (AI), robotics, sensors, 3D printing, platforms dedicated to financing, advisory services, and blockchain, among others (Klerkx, Jakku and Labarthe, Reference Klerkx, Jakku and Labarthe2019). In this context, livestock monitoring and management solutions using digital tools could give farmers access to a range of data on animals and their environment, enabling farmers to optimise the management of their farms and improve decision-making (Hostiou et al., Reference Hostiou, Fagon, Chauvat, Turlot, Kling-Eveillard, Boivin and Allain2017; Veissier et al., Reference Veissier, Kling-Eveillard, Mialon, Silberberg, Roches, Terlouw, Ledoux, Meunier and Hostiou2019). The literature has taken up this subject, providing an overall view of what digital tools represent in ruminant livestock farming. Research studies have highlighted the diversity of digital tools available. RFID tags, sensors, robots, automation tools, cameras, software, and e-commerce websites are among the digital tools that have become widespread in livestock farming (Bocquier et al., Reference Bocquier, Debus, Lurette, Maton, Viudes, Moulin and Jouven2014; John et al., Reference John, Clark, Freeman, Kerrisk, Garcia and Halachmi2016; Herlin et al., Reference Herlin, Brunberg, Hultgren, Högberg, Rydberg and Skarin2021; Odintsov Vaintrub et al., Reference Odintsov Vaintrub, Levit, Chincarini, Fusaro, Giammarco and Vignola2021; Bernabucci et al., Reference Bernabucci, Evangelista, Girotti, Viola, Spina, Ronchi, Bernabucci, Basiricò, Turini, Mantino, Mele and Primi2025; Marchegiani et al., Reference Marchegiani, Gislon, Marino, Caroprese, Albenzio, Pinchak, Carstens, Ledda, Trombetta, Sandrucci, Pasquini, Deligios and Ceccobelli2025; WikiAgriTech, 2025). However, these tools differ in both their nature and function. For example, automatic milking systems automate a daily task, thereby reducing the workload and addressing the need for labour (Veysset, Wallet and Prugnard, Reference Veysset, Wallet and Prugnard2001; Martin, Reference Martin2024). GNSS (Global Navigation Satellite System) can be used in conjunction with other tools (such as geographic information systems and accelerometers) to provide farmers with information on location, movement, and behaviour to aid animal management (Guinamard et al., Reference Guinamard, Weyer, Grisot and Jouven2018; Odintsov Vaintrub et al., Reference Odintsov Vaintrub, Levit, Chincarini, Fusaro, Giammarco and Vignola2021; Aquilani et al., Reference Aquilani, Confessore, Bozzi, Sirtori and Pugliese2022).
The literature also suggests that levels of digital tool equipment vary from one system to another. For instance, dairy cow farms are more equipped than farms raising other ruminant species (Groher, Heitkämper and Umstätter, Reference Groher, Heitkämper and Umstätter2020; Allain et al., Reference Allain, Depuille, Nicolas, Martineau, Grisot, Tesnière, Fagon, Fischer, Mounaix, Lebreton, Rubin, Balvay, Blériot, Thomas, Leroux, Navarro and Saunier2025). Furthermore, the digital tools used vary depending on the production system. Lachia et al. (Reference Lachia, Pichon, Fourcaudot and Tisseyre2021) showed that management software, smartphone apps, and mobile sensors were the primary tools used in grazing systems. In contrast, Reeves et al. (Reference Reeves, Grøva, Jessiman and Dwyer2025), based on an analysis of the practices of 23 sheep farmers in Norway, found that they primarily used GNSS collars, management software, and virtual fence collars. In addition to this overview of digital tools, a second strand of research is examining the factors behind their adoption. These factors include farmers’ profiles, the structural and economic characteristics of farms, and the perceived usefulness, cost, and reliability of the tools (Groher et al., Reference Groher, Heitkämper and Umstätter2020; Dibbern, Romani and Massruhá, Reference Dibbern, Romani and Massruhá2024; Ghali et al., Reference Ghali, Ben Arfa, Justinia, Di Bianco and Saili2026). Beyond these factors, other studies have examined farmers’ perceptions of digital tools. Reeves et al. (Reference Reeves, Grøva, Jessiman and Dwyer2025) reveal that farmers report saving time and energy on daily tasks, with reductions in activities such as weighing animals or monitoring lambing. However, other farmers temper this view, pointing to the new tasks the tools create, such as installation, updating, and maintenance, which encroach on their already limited time.
Despite their richness, these approaches tend to examine digital tools individually, and indicate little about how a digital toolkit is assembled at the livestock farm level. This more comprehensive approach to digital toolkits emerged in the field crop sector (Michels, Twietmeyer and Musshoff, Reference Michels, Twietmeyer and Musshoff2026). The authors of this study grouped digital tools into five categories and showed that these categories are connected to one another, with ‘guidance and application control tools’ at the centre of the co-adoption network. Their approach highlights the importance of examining the full range of digital tools as a whole, paying attention to the relationships between them. Furthermore, some studies conducted on dairy farms have shown that automated milking systems are rarely used on their own. For example, they are typically combined with sensors and data management software (Gabriel and Gandorfer, Reference Gabriel and Gandorfer2023). The literature therefore highlights the value of studying digital toolkits.
However, in the sheep sector, these toolkits have received little attention. Yet this approach, focused on combinations of digital tools, seems particularly relevant for sheep farming. In fact, sheep farming is subject to mandatory electronic identification throughout the European Union (Official Journal of the European Union, 2004). This measure was introduced to ensure the individual monitoring and traceability of animals (Official Journal of the European Union, 2004), paving the way for data-driven animal management (Lima et al., Reference Lima, Hopkins, Gurney, Shortall, Lovatt, Davies, Williamson and Kaler2018) and, potentially, the combination of several digital tools. Electronic identification provides access to individual data (e.g., health, traceability, weight) which, thanks to Radio Frequency Identification (RFID) devices, farmers could use to carry out various operations such as batching and sorting, and to assist in decision-making (Bocquier et al., Reference Bocquier, Debus, Lurette, Maton, Viudes, Moulin and Jouven2014; Lima et al., Reference Lima, Hopkins, Gurney, Shortall, Lovatt, Davies, Williamson and Kaler2018; Odintsov Vaintrub et al., Reference Odintsov Vaintrub, Levit, Chincarini, Fusaro, Giammarco and Vignola2021; Bernabucci et al., Reference Bernabucci, Evangelista, Girotti, Viola, Spina, Ronchi, Bernabucci, Basiricò, Turini, Mantino, Mele and Primi2025). Coupled with automated devices (e.g., automatic weighing scales, sorting gates), this system could also facilitate labour-intensive operations such as sorting, feeding, and weighing animals (Bocquier et al., Reference Bocquier, Debus, Lurette, Maton, Viudes, Moulin and Jouven2014; Odintsov Vaintrub et al., Reference Odintsov Vaintrub, Levit, Chincarini, Fusaro, Giammarco and Vignola2021; Bernabucci et al., Reference Bernabucci, Evangelista, Girotti, Viola, Spina, Ronchi, Bernabucci, Basiricò, Turini, Mantino, Mele and Primi2025). Furthermore, it is assumed that the wide variety of sheep production systems (de Rancourt et al., Reference de Rancourt, Fois, Lavín, Tchakérian and Vallerand2006; Prache et al., Reference Prache, Benoit, Boutonnet, François and Sagot2013; Béchu et al., Reference Béchu, Dollé, Gac, Leclerc, Lorinquer, Manneville, Moreau, Guinot and Orlianges2014; Ruiz et al., Reference Ruiz, Grande, Nahed, Castel and Mena2022) could lead farmers to combine digital tools in highly innovative ways to meet their specific needs.
Consequently, this article examines how sheep farmers assemble their digital toolkits to address the specific challenges associated with managing their operations. It also seeks to analyse how these tools are integrated into sheep farming practices. We hypothesise that: i) sheep grazing farmers use a range of tools, both in terms of number and type, which translates into a diversity of digital toolkits; ii) this diversity of tools can be explained by the characteristics of production systems and farmers’ perceptions of digital tools; and iii) the level of use of these tools varies from one farmer to another and reflects different needs.
In the first part of this article, we present the method used to collect and analyse data obtained from surveys of sheep grazing farmers. In the second part, we present the results obtained. We begin by describing the farms surveyed to contextualise the results. We then present the range of digital tools used by farmers and their digital toolkits. Next, to explore the factors that may explain the number and type of tools identified, we analyse the links between digital tools, farm characteristics and farmers’ opinions. Lastly, we present the way in which digital tools are used on farms. In the third part, we discuss our findings to characterise the uses of digital tools in sheep farming. This discussion also focuses on the factors influencing the diversity of digital tools used, and the influence that the characteristics of our sample may have had on the results obtained.
Materials and methods
To meet the objective of this study, we implemented a methodology composed of several steps. They are described in the sections below and include compiling a list of digital tools developed for sheep farms and a database of sheep farmers’ contact details, as well as conducting surveys, processing and analysing data.
Identification of digital tools used in sheep farming
The first step in this work was to identify the digital tools that exist and are currently used on sheep grazing farms to prepare the farmer surveys. A list of tools was therefore compiled based on research on websites and interviews with digital experts in livestock farming and companies producing digital tools for sheep farms.
First, bibliographic research was carried out on Google Scholar and Google using keywords in French (‘Elevage de précision’; ‘Elevage de précision and pâturage’; ‘Outils numériques en élevage’) and in English (‘Precision livestock farming’; ‘Digital technologies and grazing systems’ and ‘Digital tools in grazing systems’). Specialised French websites and platforms were consulted to supplement this research. In particular, we used the results of the survey conducted by the French Livestock Institute (IDELE) on digital equipment in sheep farming (Allain et al., Reference Allain, Depuille, Nicolas, Martineau, Grisot, Tesnière, Fagon, Fischer, Mounaix, Lebreton, Rubin, Balvay, Blériot, Thomas, Leroux, Navarro and Saunier2025), the WikiAgriTech platform (WikiAgriTech, 2025), which lists a range of digital tools available to those working in the agricultural sector, and the study carried out by the Observatoire des Usages du Numérique en Agriculture (the French observatory of digital uses in agriculture) on grazing systems (Observatoire, 2019).
Interviews were also conducted with digital experts in livestock farming and companies producing digital tools for sheep farms to complete the list of digital tools. Seven interviews were conducted with researchers and engineers specialising in digital technology and animal production from various French technical and research institutes, including IDELE, the French National Research Institute for Agricultural Sciences (INRAE), and Institut Agro Montpellier. Fifteen interviews with companies producing and/or marketing digital tools for grazing farms were also conducted during the Sommet de l’Élevage, the third largest agricultural show in France. It is highly regarded by the livestock sector.
This first step enabled us to compile in a Microsoft Excel file a list of 30 digital tools that could be used on sheep farms. This list was then used in the questionnaire. To simplify the analysis, we grouped tools with similar functions. This is the case, for example, with social media, which includes WhatsApp, Facebook, and Instagram.
Creation of a database of sheep farmers and scope of the study
As there was no database of farmers that we could use, we decided to compile a list of farmers to survey, located in the four main sheep farming regions in France. These four regions are Occitanie, Nouvelle-Aquitaine, Auvergne-Rhône-Alpes (AURA), and Provence-Alpes-Côte d’Azur (PACA). They represent the majority of France’s breeding stock, accounting for 73% of ewes and lambs bred for meat and 94% of ewes and lambs bred for milk (IDELE and the French Livestock Confederation (CNE), 2024, according to the Statistics and Foresight Department (SSP)—2023 livestock survey). These areas were also chosen to maximise the number of responses from farmers.
Building the database took several weeks and was carried out in several stages. First, we identified channels for obtaining contact details for sheep farmers. For each of the 43 French departments in the four selected regions, online searches were conducted to identify French websites (e.g., Bienvenue à la Ferme, the official directory of organic professionals), guides listing farms in a region, their production and contact details for different years (e.g., Le Guide Bio), and organisations that could provide contact details for farmers. Using these sources, we then identified farmers who owned sheep. Where possible, the ‘search’ function in the documents was used with several keywords: ‘ovins’ (ovins); ‘mouton’ (sheep); ‘brebis’ (ewe); ‘agneau’ (lamb). Some sites also offered filters by production. In other cases, the entire documents had to be searched to identify the farmers.
Once the contacts had been identified, the farmers’ details were compiled in a Microsoft Excel spreadsheet containing a range of information such as surname, first name, French department, region, telephone number, email address and production details when these were provided. A list of approximately 1,000 farmers was compiled, and a form was then sent to them via an online survey platform, Microsoft Forms®. This allowed farmers interested in the survey to register directly and provide general information about their farms, namely the region and French department, livestock units on the farm, and whether or not they produced milk. A description of the study, including its objectives, the information we intended to gather during the interview, and the details of the survey (e.g., duration, procedure and format), was included in the online questionnaire. In addition, organisations such as chambers of agriculture (French public institutions that represent the interests of agricultural professionals and support them in various technical, administrative, and related domains), agricultural unions, technicians, and researchers in the regions concerned were asked to provide contacts for farmers or to distribute the form through their networks of farmers. The sample was also supplemented by contacts provided by the farmers surveyed and an engineer from VetAgro Sup, an agricultural engineering school in France. A total of 75 farmers responded to this form and were contacted to complete a more detailed questionnaire about their use of digital tools.
Development of the questionnaire and conduct of the surveys
Once the lists of digital tools and farmers had been drawn up, a questionnaire containing both open and closed questions was developed to collect the information needed to verify the hypotheses formulated. It was organised around the following four objectives:
-
- Characterise the farms and the respondents. The first set of questions focused on general information describing the farms surveyed (e.g., legal status, age, quality label, flock size) in order to contextualise the results obtained.
-
- Identify the digital tools used by farmers from the list of tools established in the first phase of this work. This list was expanded as the interviews progressed because farmers mentioned the use of certain digital tools, such as office software and weather apps, that had not been initially included. The questions asked were intended to document the digital equipment used by sheep farmers and to verify the hypothesis that sheep farmers use a wide range of digital tools and would therefore have equally diverse digital toolkits. A digital toolkit is the set of digital tools used by a farmer, and may consist of one or more tools. We use the term ‘configuration’ to refer to situations where several farms own the same set of digital tools.
-
- Collect information on farmers’ systems (e.g., number of lambing periods, lamb finishing methods) and farmers’ opinions regarding the digital tools used on their farms. The data collected were intended to enable an examination of whether these factors could explain the diversity observed. Farmers were surveyed about their general opinions of digital tools. They could choose from three responses: favourable, unfavourable, or mixed feelings. To better understand their opinions, we asked them to provide more details about their responses.
-
- Collect data on the level of use of digital tools (frequency of use, for what purposes) in order to understand how and why they are used.
The data to be collected were divided into three sections of the questionnaire (farm organisation, farmers’ systems, digital tools used), each contributing to one aspect of the hypotheses. The questionnaire was tested under real conditions with two farmers during a telephone call and in person. Once the questionnaire had been adapted, the survey was conducted from February to April 2025 with the help of nine students and an engineer from VetAgro Sup, either by telephone or in person on the farm. The interview lasted an average of 30 minutes.
Data processing
This study is based on 75 surveys. These were used to describe the farms and analyse the farmers’ opinions. The other analyses were carried out on farms with at least one digital tool (n = 68). One farm was excluded from the analysis of production systems due to missing data on the finishing method for lambs.
A database was created from the surveys. The 75 interviews were then compiled into a Microsoft Excel file with 480 columns, each column mainly containing the interview questions and other variables calculated (e.g., age, number of sheep). Each farmer was identified by a number from 1 to 75. Missing values were marked as ‘no response.’ Some tools were excluded due to inconsistencies and/or doubts about their digital nature (e.g., feed dispensers often combined with automatic milk feeders).
Several types of coding were used. The presence, absence, and abandonment of digital tools were coded according to the following three categories: used, never used, and abandoned. In order to describe them, digital tools were classified into five categories based on their uses, drawing inspiration from the classifications of Schnebelin (Reference Schnebelin2022), Allain et al. (Reference Allain, Depuille, Nicolas, Martineau, Grisot, Tesnière, Fagon, Fischer, Mounaix, Lebreton, Rubin, Balvay, Blériot, Thomas, Leroux, Navarro and Saunier2025), Ghali et al. (Reference Ghali, Ben Arfa, Justinia, Di Bianco and Saili2026) and the WikiAgriTech platform. The categories were:
-
- Digital management tools (DMaT). Consisting mainly of software (e.g., animal management software, plot management software), this category includes digital tools designed for the organisation and management of farms and, in some cases, decision support.
-
- Digital communication and information tools (DCIT). This category includes tools that enable farmers to obtain information, receive training, exchange ideas, and to sell animal products. It includes digital tools such as social media and websites.
-
- Digital monitoring tools (DMoT). These are tools that enable information to be collected on animals and their environment for the purpose of monitoring and tracking them in buildings. Examples include cameras and electronic ID reading sticks, which will hereafter be referred to as ‘stick readers.’
-
- Digital grazing management tools (DGMT). This category includes digital tools designed to monitor plots of land and animals grazing. These include digital tools such as weather stations and GPS collars.
-
- Automation. This category includes digital tools that automate tasks such as automatic feed dispensers and automatic weighing scales.
Two variables were used to assess the level of digital tool use: frequency of use and type of use. For the frequency variable, farmers could choose one of the following responses: daily, weekly (a few times a week), monthly (a few times a month), or annually (a few times a year). The categories were constructed inductively from the farmers’ open-ended responses, allowing the identification of the main uses associated with each digital tool.
Data analysis
The data analysis was carried out in four stages.
First, the sample was characterised using descriptive statistics, which made it possible to place the results in the context of the farms surveyed. Second, the analysis focused on describing the digital tools used by farmers. To this end, descriptive statistics were also produced in order to:
-
- Count the total number of users per digital tool. The digital tools identified are presented in graph form (see Fig. 1).
-
- Count the digital tools according to their presence (coded as 1) and absence (coded as 0) per farmer. The resulting Microsoft Excel file was used to build the farmers’ digital toolkit.
Figure 1.Number, types, and categories of digital tools identified on the 75 sheep farms.

Figure 1 Long description
Figure 1 represents the number, types and categories of digital tools identified on the 75 sheep farms. A total of 22 digital tools were identified. Eight belong to the category of digital grazing management tools, four to the category of digital monitoring tools, four to the category of digital management tools, three to the category of digital communication and information tools and three to the category of automation tools. Digital management tools were the most widely used, while automation tools were the least used category.

In a third stage, the analysis then focused on data that would allow us to explore a possible link between the diversity observed and a set of factors (production system, farmers’ opinions). Several analysis methods were used:
-
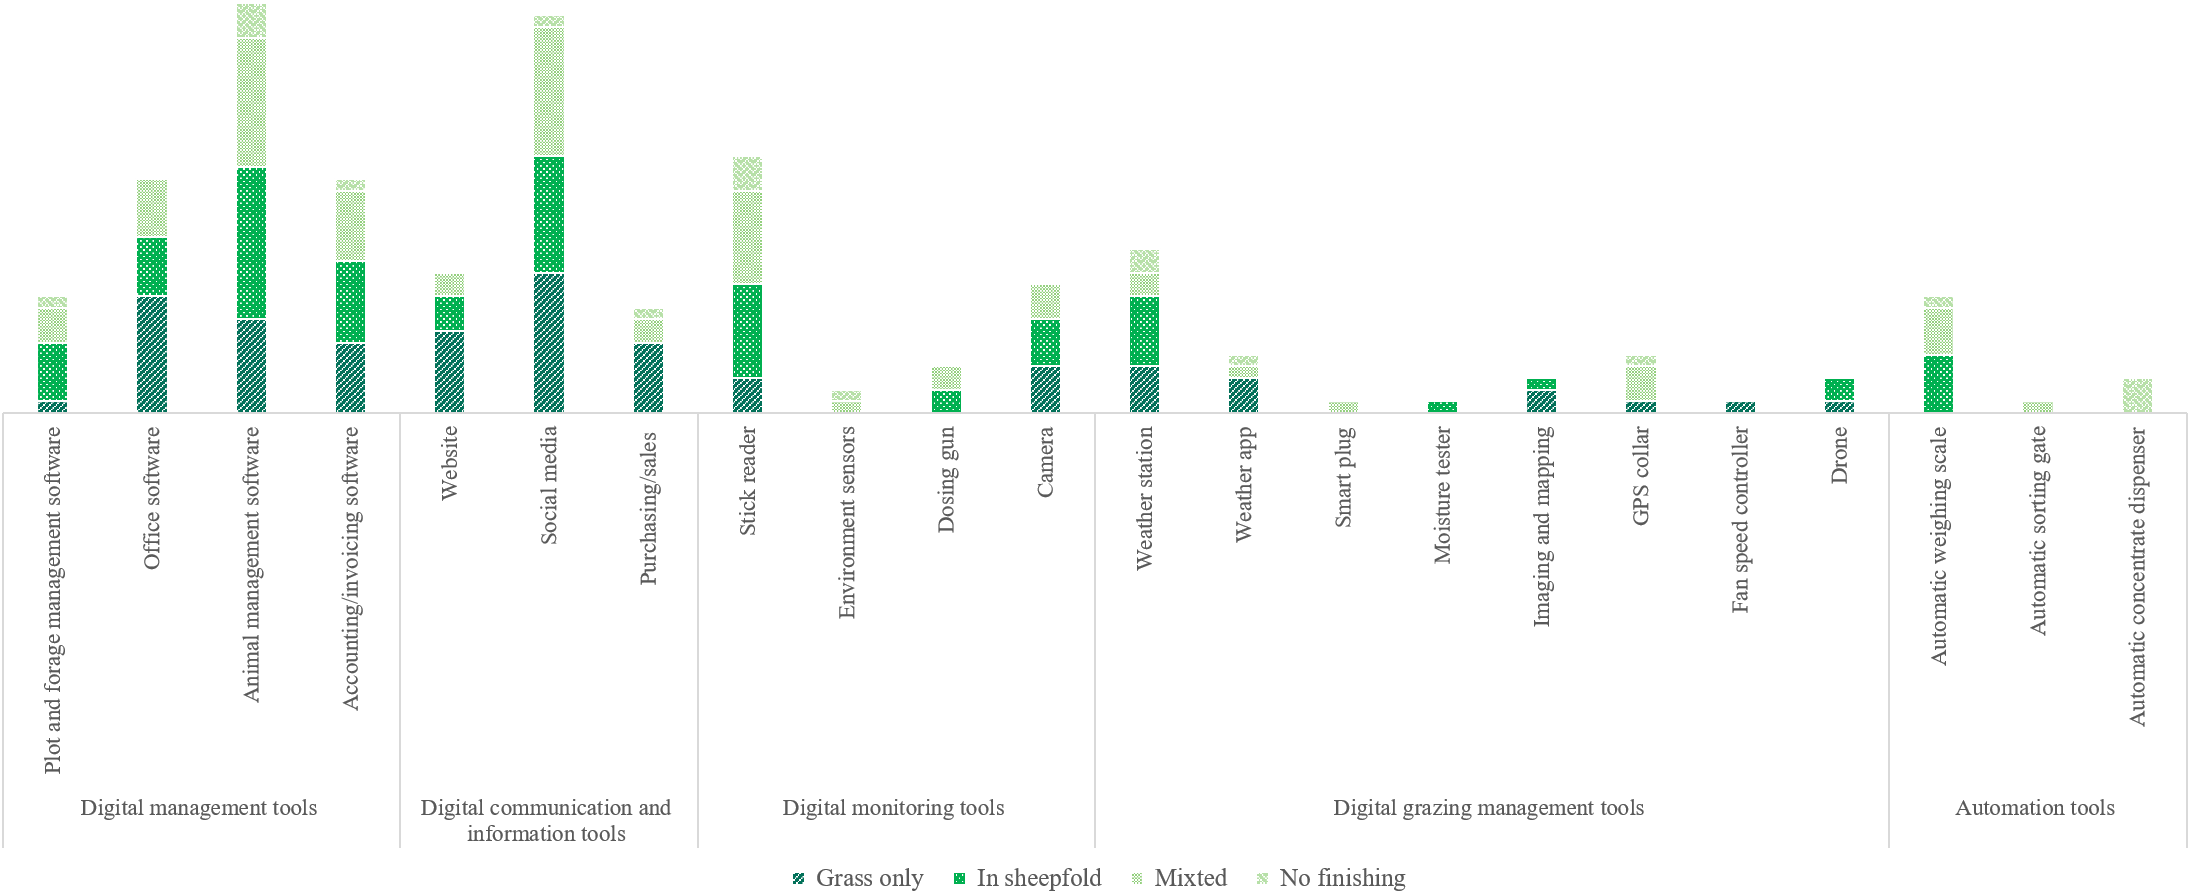
- Production systems. To simplify the analysis, production systems were grouped according to the lamb finishing methods. This grouping was used to examine whether the use of digital tools differs according to the fattening practice. The lamb finishing method refers to how farmers fatten their lambs, and includes four categories: grass only, in sheepfold, mixed (a combination of both), or no finishing (for farmers who do not fatten their lambs). The file that records the presence (1) or absence (0) of digital tools was used, and the variable ‘lamb finishing method’ was added. The final result was presented in the form of a graph created in Microsoft Excel (see Fig. 2).
-
- Farmers’ opinions. The analysis of farmers’ opinions enabled the identification of the most recurring themes addressed in this study. For each theme, the verbatim quote that best represented the idea was selected. We also used the file recording the presence or absence of digital tools to establish whether there was a link between farmers’ opinions and the number and type of tools used.
Figure 2.Distribution of digital tools according to production systems (lamb finishing methods) of the sheep farms surveyed.
Figure 2 Long description
Figure 2 represents the distribution of digital tools according to production systems (lamb finishing methods) of the sheep farms surveyed. The results show that some digital tools were present regardless of the production system, whereas others were more widely used in some systems than in others (the case of production systems combining mixed and in sheepfold lamb finishing, which use more stick readers and automatic weighing scales), or absent altogether (the case of production systems characterised by grass-based lamb finishing, which use no automation tools). These differences may reflect varying data needs and, therefore, differences in the digital tools used.

In a fourth step, a summary table was created presenting digital tools, their frequency of use, and their main types of use. Descriptive statistics were used to count the frequency of use for each tool in five categories: daily, weekly, monthly, annually, no response. The resulting Microsoft Excel file was completed with the list of farmers equipped with each digital tool. The results were presented in a table (see Table 1).
The main uses of digital tools identified and their frequency in the 75 sheep farms surveyed

Table 1. Long description
Table 1 represents the main uses of each of the 22 digital tools identified and their frequency (daily, weekly, monthly, annually, no response) in the 75 sheep farms surveyed. Two levels of digital tools are identified: digital tools integrated into the routine management of farms, which are used more frequently, and digital tools used with greater variability, reflecting targeted or periodic use.
Note: D, daily; W, weekly; M, monthly; A, annually; NR, no response.
Results
The presentation of the results is structured in such a way as to examine the hypotheses formulated. Each section contributes to verifying these hypotheses and meeting the study’s objective. First, the farms surveyed are described in order to contextualise the results. In the second part, the digital tools identified and the digital toolkits on farms are presented. This section enables us to characterise the diversity of digital tools and identify the dynamics of how these tools are combined. The third part is devoted to presenting the results relating to production systems and the opinions of farmers. These data help to understand the extent to which these factors can help explain the presumed diversity of the digital tools used. The closing section provides an understanding of how digital tools are used on farms.
Presentation of the farms surveyed
The majority of the 75 farms surveyed (76%) are located in the AURA and Occitanie regions, with 16% in Nouvelle-Aquitaine. Only 8% of farms are located in the PACA region.
While 44% of the farms are part of a Groupement Agricole d’Exploitation en Commun (GAEC, Agricultural Joint Farming Group), 43% are individually owned. The average age of farmers is 45 (SD = 9.8). Women represent 35% of the sample. In addition, 25% specialise in dairy sheep and/or meat sheep farming. In total, 87% of the farms surveyed have a quality label, 65% of which are organic, 12% have the French Label Rouge certification and 7% have at least two quality labels. Thirteen percent of the farms have no quality label.
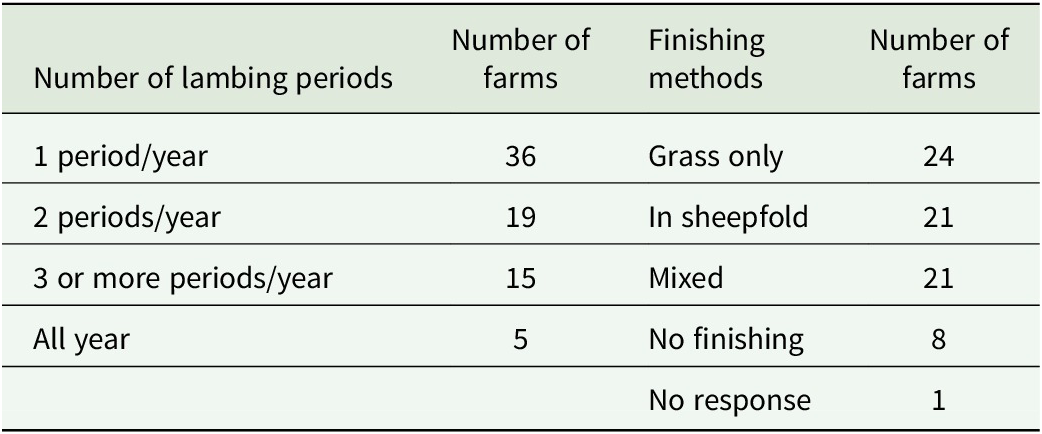
Eighty percent of farms raise suckler sheep, 16% raise dairy sheep, and 4% raise both. Our sample consists of farms with an average of 218 ewes. Farms with 50 or more ewes (n = 69 farms), which represent the majority of our sample, have an average herd size of 235 ewes, which is close to the national average for this category of farms (258 ewes) (INTERBEV, 2025 based on the SSP—November 2024 livestock survey). The average UAA is 106 ha. Table 2 shows the number of lambing periods and the different finishing methods used on farms. The majority of farms have a single lambing period. Lambs are either finished on grass, in sheepfolds or a combination of both.
Number of lambing periods and lamb finishing methods per farm

Table 2. Long description
Table 2 represents the number of lambing periods (1 period/year, 2 periods/year, 3 or more periods/year, all year) and lamb finishing methods (grass only, in sheepfold, mixed, or no finishing) per farm.
Digital tools used on sheep grazing farms
Digital management and communication tools play an important role
The results show that farms use an average of three digital tools. The number of digital tools per farm ranges from 0 (seven farmers do not own any digital tools) to nine. Among the 91% of farmers who use at least one digital tool, 50% use between two and four digital tools, and the median is three digital tools.
A variety of tools are currently used by sheep farmers. Fig. 1 presents the list of digital tools identified in this study, as well as the number of tools recorded for each. A total of 22 digital tools were identified. Eight belong to the category of digital grazing management tools (DGMT), four to the category of digital monitoring tools (DMoT), four to the category of digital management tools (DMaT), three to the category of digital communication and information tools (DCIT), and three to the category of automation tools (Fig. 1).
Our results highlight the predominance of DMaT. In fact, 85% of farmers use at least one tool in this category, and the most widely used tool is animal management software (35 users). Our study also highlights the significant use of DCIT. In fact, 65% of farmers use at least one tool in this category. This includes social media, the second most used tool by farmers (34 users). In total, 40% of farmers use at least one tool belonging to the DGMT category. This is the category with the greatest diversity of tools (eight), among which the weather station stands out with the most users (14). Among farmers who use at least one digital tool in the DMoT category (43%), 22 use a stick reader (the most widely used tool). Finally, very few farms (18%) use at least one automated system. The most widely used tool in the automation category is the automatic weighing scale, with 10 users. The three automatic concentrate dispensers identified are only used by dairy farms. The study did not identify any cases of robotic tools.
Twenty farmers have abandoned 13 digital tools. Among them, the DGMT category had the highest number of abandoned tools (four), followed by the DMoT and DMaT categories, each with three types of abandoned tools (see Appendix 1 of the Supplementary Material).
These results highlight the diversity of digital tools used by sheep farmers and reveal a high degree of heterogeneity in the adoption of these tools. However, this tool-by-tool approach does not allow us to characterise the composition of farmers’ digital toolkits or identify any possible configurations. The rest of the analysis will therefore focus on analysing these toolkits in order to identify and understand the associations between digital tools.
A diversity of digital tools for a diversity of associations
Analysis of the digital toolkits reveals a diversity of configurations among the sheep farmers surveyed. These configurations may consist from one to nine digital tools.
A total of 58 configurations were identified. Fifty-two are unique, meaning that they are only found on a single farm, which reflects significant variability between farms and the absence of standard combinations found on all farms. Only a few configurations are repeated, such as the combination of animal management software, stick reader, and social media (four occurrences), and the combination of animal management software and social media (three occurrences).
However, a more detailed analysis of farmers’ digital toolkits and the digital tools they contain reveals a second level of analysis. This approach revealed that digital toolkits consist of combinations of different types of digital tools. On the one hand, there are digital tools that can be used together. This is the case, for example, with the animal management software and the stick reader, which were found on 19 farms; to this group can be added the automatic weighing scale, present on eight farms. On the other hand, some combinations consist of digital tools that are used separately. Social media is an example of this, as it is used by some farmers to market their produce and forms a pair with animal management software, which is present on 22 farms.
In contrast, combinations of office software and other software are very rarely seen together on farms (three times for animal management software and twice for plot management software). This could be explained by the fact that some farmers use office software as a substitute for the latter two types of software. One farmer told us that he uses Microsoft Excel because it is free, and another because ‘Excel, we know how to use it and what’s in it.’
The results of this first part confirm our initial hypothesis. Sheep farmers use a variety of digital tools, both in terms of type (five categories identified) and number (22 tools identified). Analysis of the tools used by farmers and their digital toolkits reveals that each farmer seems to build his or her own customised set of tools, even if some combinations stand out from the rest. In order to understand why this diversity exists, the factors that may contribute to it are explored in the next section.
Characteristics of production systems and farmers’ perceptions of digital tools to explain the use of digital tools
Links between digital tools and sheep production systems
The survey results show that, depending on the production system, farmers adopt different equipment strategies, reflecting equipment choices specific to each farm. Fig. 2 represents the total number of digital tools used according to production systems, characterised in this article by lamb finishing methods.
We observe that certain tools are more prevalent regardless of the system. This is the case for animal management software, social media and the stick reader, although the proportion of farmers who are equipped varies between systems.
Nonetheless, certain trends stand out. Compared to other systems, the sheep farming system characterised by grass-based lamb finishing makes greater use of office software, websites, and purchasing/sales tools, with 50%, 58% and 67% of farmers respectively belonging to this category. Similarly, farmers with a production system combining mixed finishing and in sheepfold lamb finishing account for the majority of users of the stick reader (73%) and the automatic weighing scale (90%). In addition, the automatic concentrate dispenser is only used by farmers who do not finish their lambs. Finally, no farmer practising grass-based lamb finishing owns automation tools.
These differences observed between production systems could be explained by different information and management needs, depending on the production system and farmers’ objectives. These needs could influence the type of digital tools used. For example, issues related to product traceability may require different digital tools for farm management. Similarly, the way in which products are sold may also play a role. A farmer who is a member of a cooperative that sets average weight targets for lambs, which requires weight monitoring, does not necessarily use the same tools as a farmer focused on direct sales, who faces fewer lamb weight requirements.
However, the presence of tools common to certain systems and the variability observed within each system suggest that the production system alone is not sufficient to explain the diversity of tools used. We hypothesised that farmers’ perceptions of digital tools may also explain this variability.
Sheep farmers’ opinions of digital tools
The results reveal that farmers’ opinions on digital technology are far from unanimous. While 51% of the farmers surveyed said they were in favour of digital tools, 25% were against them, and 24% had mixed feelings. However, this distribution masks a far more varied reality.
Among the farmers interviewed, some consider digital tools to be a real asset in their daily work, helping them to make decisions and take action by improving their working conditions (e.g., saving time, increasing comfort), facilitating the organisation of their work (e.g., recording and centralising data, sharing data) and increasing performance (e.g., better monitoring of animals, increased efficiency). These points are summarised by these two farmers:
Farmer 1: ‘It makes work much easier, it means fewer mistakes, particularly when reading ear tags, and it means everything is recorded on one tool… we waste less paper and lose less data.’
Farmer 2: ‘It changes everything: it saves time, helps monitor productivity, and supports animal management.’
This positive view of digital tools is also shared by farmers with unfavourable and mixed feelings, who recognise the advantages of digital tools, particularly for improving working conditions and increasing performance. However, this positive outlook is tempered by these farmers and is accompanied by criticism, issues to watch out for, and concerns.
In addition to certain identified limitations (e.g., network access, cost, time required to use digital tools), some farmers express a degree of mistrust towards these tools, particularly because of their lack of reliability: ‘When it works, it’s great; when it doesn’t, it’s absolute hell.’ Another farmer adds that malfunctions can even further increase the workload. These testimonies highlight the difficulties that can arise when digital tools break down, leading some farmers not to rely on them entirely ‘(…) Everything is done by eye, the old-fashioned way. That doesn’t break down.’
Moreover, some farmers mention the conflict caused by using these tools with certain fundamentals of the profession. While some farmers stress the need not to lose sight of observation, others also see a risk of losing their autonomy, a means for the administration to monitor them, and the development of dependence on these digital tools. The fear of losing their farming know-how and their relationship with their animals is also mentioned. The legitimacy of these tools in relation to the farmer’s know-how and experience is also questioned by this farmer: ‘I don’t see what digital tools can offer that farming know-how can’t.’
Another recurring theme is the criticism of the agricultural model promoted by these tools. Farmers often associate these tools with large-scale farming and the productivism, standardisation and industrialisation of livestock farming: ‘Small-scale farms don’t need digital technology.’ It is this image of digital technology that undoubtedly leads some livestock farmers to question the role of digital tools in improving animal welfare. The issue of the environmental impact of digital tools is also being raised by other sheep farmers.
Our results also show that farmers’ perceptions of digital tools seem to influence their equipment choices. On the one hand, farmers expressing a favourable opinion are on average more equipped (3.9 digital tools) than farmers with mixed opinions (2.4 digital tools) or unfavourable opinions (1.9 digital tools). On the other hand, some categories of digital tools are underrepresented among farmers with mixed or unfavourable feelings. For example, only one farmer in these categories uses a digital tool belonging to the automation category. Some farmers also criticise the use of certain digital tools such as drones or cameras, while others consider that their usefulness depends on flock size: ‘If I had 400 ewes, I would probably have an automatic weighing scale and a stick reader.’ Other ‘simpler’ tools, such as smartphones or office software, seem to be more accepted.
Finally, among the 20 farmers who have stopped using digital tools, 13 were in favour, 5 had mixed feelings and 2 were against.
‘A tool is both a remedy and a poison.’ This comment from a farmer sums up and highlights the diversity of opinions on the issue of digital technology. Two key findings emerge from this analysis: while the use of these tools offers advantages, it also comes with constraints. In all cases, they must remain a support and not replace the skills, knowledge, and ‘flair’ of farmers and the relationship they have with their animals.
The results suggest that the diversity of digital tools observed on sheep farms could be explained by a combination of these two factors. On the one hand, the analysis highlights equipment strategies that vary from one system to another. These findings suggest that the specific characteristics and needs of each system could influence the number and type of digital tools. On the other hand, different perceptions of digital tools may also influence equipment choices, meaning that, depending on whether the tool is seen as an opportunity or a threat, it may be adopted to a greater or lesser extent.
In the last part of this section, we attempt to understand how digital tools are integrated into sheep farms.
Varying levels of digital tool use
The frequency of use of a digital tool seems closely linked to the nature of its use within sheep farms. Table 1 presents the main uses of digital tools as well as their frequency. In 61% of cases, digital tools are used daily or weekly, which demonstrates frequent use of digital tools.
Digital tools integrated into the routine management of farms are used more frequently. This is particularly true for DMaT, which makes it possible to record, access, and centralise data relating to animals, fields, and the farm economy. These tools also facilitate administrative and compliance requirements (e.g., animal movements, manure management plan). Similarly, most DGMTs are used daily as they enable farmers to manage their land and animals on pasture. These include weather stations used by farmers to consult and monitor meteorological data, including forecasts and historical data. Some farmers use this information to make decisions about their animals and the management of their land and fodder. Other tools, such as GPS collars and drones, are used to monitor, locate, and manage animals on pasture.
Conversely, other digital tools have a more varied frequency of use, reflecting targeted or periodic uses. This is the case for cameras, whose frequency ranges from annual to daily use. This heterogeneity could be explained by their greater need during lambing: most farmers report using them during this period. Similarly, although farmers indicated that they use the automatic weighing scale weekly, its use is mainly oriented toward weighing lambs, which also suggests more intensive use during lambing. The stick reader, for its part, has diversified uses: it is used to identify animals and record various operations such as mating and ultrasound scans. It is also used for sorting and batching animals, as well as for certain administrative tasks, such as conducting inventories. Finally, DCITs have frequencies of use that vary depending on the tool: farmers mainly use them to stay informed, exchange ideas with their peers, for training and serve as a platform for commercial and communication activities.
All of these findings show that digital tools are not used in the same way. This diversity contributes to the uneven spread of digital technology within these systems, shaped by the specific needs and objectives of each farmer.
Discussion
Our analysis of the range of digital tools available and the ways in which digital tools are used highlights the role that digital technology can play in supporting livestock farmers. These results are discussed in the first section. In the second section, we seek to identify factors that may help explain the diversity observed in this study. Our sample is largely composed of farms participating in official quality schemes. The final section considers how this characteristic may have influenced the results obtained.
Diversity uses of digital tools in sheep farming
Our study shows that although the number of digital tools per farm is relatively low (3 on average), farmers have access to a wide variety of tools (22 in total). Sheep farms use a variety of digital tools, mainly management software, information tools and stick readers, whereas automation tools are less common, unlike in dairy cattle farming.
The milking robot used in dairy cattle farming illustrates a reverse logic of using a central tool that creates an obligatory passage point for each cow, from which several tasks can be carried out (e.g., milking, feeding, animal care) and numerous data can be collected on animals (e.g., monitoring and management of milking, health, welfare) (Veysset et al., Reference Veysset, Wallet and Prugnard2001; Butler, Holloway and Bear, Reference Butler, Holloway and Bear2012; Tse et al., Reference Tse, Barkema, DeVries, Rushen and Pajor2018; Martin, Reference Martin2024). The absence of structuring tools in sheep farming suggests that farmers compensate for this lack by combining several digital tools to build a tailor-made information system that meets their needs. These results suggest that sheep farmers use digital tools that can easily be integrated into their daily practices. They are primarily used to collect, centralise and analyse data relevant to traceability, regulatory and compliance obligations and flock management, rather than to automate tasks. Our findings therefore offer a more nuanced view of precision livestock farming by bringing to light tools that are often overlooked. This is particularly the case with office software (Excel), which appears to be a low-cost alternative to management software. In addition, the frequency of use of digital tools, which is predominantly daily or weekly, reflects their integration into sheep farm management, although this varies according to the type of digital tool considered.
Our results showed a total of 58 configurations, 52 of which are unique. The analysis of farmers’ digital toolkits reveals that sheep farmers combine several digital tools to build their farm information systems, with no standard configuration emerging. This diversity raises questions about the management of such complex information systems and the new skills this requires. Indeed, each digital tool generates information that differs in both nature and volume. Farmers must therefore manage and combine these different sources of information (in addition to those provided by other sector actors, such as cooperatives or technicians) in order to support farm management. This task runs up against one of the obstacles identified in the literature, interoperability (Dibbern et al., Reference Dibbern, Romani and Massruhá2024), which can limit the centralisation of information within a single information system. Consequently, farmers themselves ensure the coordination between heterogeneous data sources, which could increase their workload. The literature also highlights that using digital tools can lead to the emergence of new tasks, such as monitoring, management and data analysis, and handling of alerts, which can affect farmers’ mental workload (Schewe and Stuart, Reference Schewe and Stuart2015; Hostiou et al., Reference Hostiou, Fagon, Chauvat, Turlot, Kling-Eveillard, Boivin and Allain2017; Goller, Caruso and Harteis, Reference Goller, Caruso and Harteis2021; Hostiou et al., Reference Hostiou, Jeanneaux, Duval, Lebrun and Nowak2023).
Factors influencing the diversity of digital tools used
Our results demonstrate the diversity of digital tools and digital toolkits used on sheep farms. We sought to explain this diversity through two factors: production systems and farmers’ perceptions of digital technology.
Our results have shown that some digital tools were present regardless of the production system, whereas others were more widely used in some systems than in others (the case of production systems combining mixed and in-sheepfold lamb finishing, which use more stick readers and automatic weighing scales), or absent altogether (the case of production systems characterised by grass-based lamb finishing, which use no automation tools). Our findings are consistent with those of Tedeschi, Greenwood and Halachmi (Reference Tedeschi, Greenwood and Halachmi2021), who showed that the need for digital tools can vary depending on the production system. Our results also show that feelings about digital tools are heterogeneous, and that farmers’ perceptions of digital tools may influence equipment choices. Lima et al. (Reference Lima, Hopkins, Gurney, Shortall, Lovatt, Davies, Williamson and Kaler2018) show that sheep farmers who perceive electronic identification as useful and practical are more likely to adopt it or consider adopting it.
However, other factors could also help explain the diversity observed. The availability of digital tools for sheep farms with grazing systems could also be a factor helping to understand the diversity. Indeed, previous studies have highlighted that digital technology appears to be underdeveloped in economically marginal sectors, such as sheep farming (Gautier et al., Reference Gautier, Morgan Davies, Keady, Bohan, Lagriffoul, Ocak, Beltrán De Heredia, Carta, Gavojdian, Rivallant, François and Depuille2020). Other studies suggest that the low number of tools dedicated to pasture management could be due to the recent, limited, and unstable nature of the range of products currently available (Lachia et al., Reference Lachia, Pichon, Fourcaudot and Tisseyre2021). Thus, in response to this offer, sheep farmers assemble their digital toolkits based on their needs, but also on the tools available, thereby contributing to the creation of diverse digital toolkits.
Further studies have also highlighted factors that could explain the heterogeneity observed in this study. For example, Schnebelin’s (Reference Schnebelin2022) study on organic farming indicates that some uses of digital tools could be influenced by socio-economic factors such as the networks in which farmers are embedded. The author explains that some actors (advisory, commercialisation, professional networks) may encourage or even impose the use of digital tools. Other factors, such as region, herd size, farming system, economic resources, work intensity, membership in a quality label scheme, age, education level, and gender, may also influence the adoption of digital tools (Groher et al., Reference Groher, Heitkämper and Umstätter2020; Ghali et al., Reference Ghali, Ben Arfa, Justinia, Di Bianco and Saili2026). For example, Ghali et al. (Reference Ghali, Ben Arfa, Justinia, Di Bianco and Saili2026) reveal that women adopt more decision-support tools, while men adopt more monitoring tools and automation tools. Our study was unable to draw any conclusions regarding the effect of gender, as our sample had not been designed for that purpose. However, this effect of gender could be investigated in greater detail in future research.
These different studies reveal that the adoption of digital tools depends on a diversity of factors linked to farmers’ profiles, the structural and economic characteristics of their farms, their professional trajectories, and their environment. If we add to the factors a digital-tool offering that is still limited and heterogeneous, variable production systems, and farmers with varied opinions, it is easy to understand why this heterogeneity, both in type and in number, was identified in this study.
A sample distinguished by farms with official quality labels
Our results reveal that 87% of the farms surveyed have a quality label, 65% of which are organic. This characteristic could have influenced the results obtained. According to Schnebelin (Reference Schnebelin2022), organic farms do not have the same expectations, needs, or uses for digital tools as so-called ‘conventional’ farms. The author also shows that organic farms use fewer digital production technologies than conventional or mixed farms (farms with both conventional and organic production). Furthermore, Ghali et al. (Reference Ghali, Ben Arfa, Justinia, Di Bianco and Saili2026) indicate in their analysis that organic farms had the lowest level of adoption of digital tools, with the exception of decision support tools.
Farms with quality labels must comply with certain specifications which, in some cases, limit the appeal or use of certain digital tools. This is the case with the Comté PDO, which prohibits the use of milking robots (Martin, Reference Martin2024). Yet on another note, Ghali et al. (Reference Ghali, Ben Arfa, Justinia, Di Bianco and Saili2026) show that farms involved in certification processes, particularly for the French ‘Label Rouge’ label, are subject to specifications that recommend, and sometimes even require, the use of digital decision-making and monitoring tools. The farmers surveyed in this study did not mention any specific difficulties related to quality labels and the use of their digital tools. However, it might be relevant to extend this study to ‘conventional’ systems in order to verify whether the trends observed in this study are confirmed.
Conclusion
This study highlighted the diversity, both in number and type, of digital tools used on pasture-based sheep farms. A total of 22 digital tools were identified. On average, farms use three digital tools, with a predominance of management software, information tools, and stick readers. Few farms use automation tools. These results suggest that digital technology in sheep farming seems to be structured around tools designed to support farmers in their daily work (e.g., traceability, regulatory and compliance obligations, flock management, data collection, and centralisation). This is a particularly interesting finding, as it highlights tools that are often overlooked in precision livestock farming, such as office and management software and social media.
Our results also show that the diversity observed may be explained by production systems (lamb finishing methods) and by farmers’ perceptions of the tools they use. Other factors, linked to the farmer’s profile and the farm’s structural and economic characteristics, professional trajectory, and environment, could also help explain the diversity observed. These indicators reveal different equipment strategies and needs in terms of digital tools.
The distinctive feature of this study is that it considered the entire range of digital tools used by farmers, rather than analysing individual digital tools in isolation. The results also reveal that there is no ‘standard’ configuration. Instead, each farmer puts together a set of digital tools to create a customised information system tailored to their circumstances, objectives and the availability of tools, in order to address the unique challenges of their farm.
Farmers are embracing digital technology in different ways. Two types of digital tools stand out: those that are frequently used as part of a farm’s management routine, and those that are used less frequently for targeted or periodic tasks.
Lastly, the surveys show that farmers look favourably upon digital tools but also take a critical stance. In their view, digital technology must remain a support and should not replace farmers’ know-how.
This work has provided insight into how these tools are integrated into sheep farms. It paves the way for more detailed research, this time focusing on the data actually used by farmers and the objectives they pursue (e.g., system optimisation, traceability), their role in the decision-making process, and the changes (or lack thereof) in animal management and farmers’ work. Attention should also be paid to how farmers acquire this information (e.g., networks, digital tools). Such insights would ultimately contribute to the development of digital tools that are better aligned with farmers’ practices and needs.
Supplementary material
The supplementary material for this article can be found at http://doi.org/10.1017/S1742170526100623.
Data availability statement
The data that support the findings of this study are not publicly available due to confidentiality constraints related to the study participants and data protection requirements.
Acknowledgments
This work received assistance from a group of nine third-year A2E/PA students as part of a module aimed at identifying an issue, constructing an analytical framework, and discussing the results from January to February 2025. The authors would like to thank them, as well as Audrey Michaud and Christophe Troquier. The authors would also like to thank Grace Delobel (DipTrans MCIL CL) for translating the article.
Author contributions
Data collection was carried out by nine third-year A2E/PA students, Christophe Troquier and Nouria Compaoré. The data were annotated and analyzed by Nouria Compaoré. All authors contributed to the design and implementation of the work, provided their expertise, and approved the final version of the article.
Funding statement
This work received government funding managed by the French National Research Agency under France2030, reference number ANR-22-PEAE-0002.
Competing interests
The authors declare no competing interests.
Ethical standards
Verbal or written consent was obtained prior to the interview. The authors also confirm that all participants gave their consent to participate in the study.




 Open access

