





Adolescence is defined as the beginning of biological maturation (i.e., puberty), which typically starts in late childhood and lasts for more than 10 years (Sawyer et al., Reference Sawyer, Azzopardi, Wickremarathne and Patton2018). The transition to adolescence involves a dramatic social reorientation, during which youth seek autonomy from family and orient increasingly toward their peers (Nelson et al., Reference Nelson, Leibenluft, McClure and Pine2005, Reference Nelson, Jarcho and Guyer2016). Compared to younger children, adolescents spend less time with their family, replacing this instead by time alone and with friends (Lam et al., Reference Lam, McHale and Crouter2014; Larson & Richards, Reference Larson and Richards1991; Larson et al., Reference Larson, Moneta, Richards, Holmbeck and Duckett1996). Because adolescents also report heightened sensitivity to peer evaluation, and often link peer acceptance and rejection to self-worth (Andrews et al., Reference Andrews, Foulkes, Bone and Blakemore2020; Blakemore & Mills, Reference Blakemore and Mills2014; Lee et al., Reference Lee, Jamieson, Reis, Beevers, Josephs, Mullarkey, O’Brien and Yeager2020; O’Brien & Bierman, Reference O’Brien and Bierman1988; Tang et al., Reference Tang, Lahat, Crowley, Wu and Schmidt2019), this social transition also involves heightened exposure to interpersonal stressors, such as peer rejection (Scholte & Aken, Reference Scholte and Aken2007), peer conflict (Noakes & Rinaldi, Reference Noakes and Rinaldi2006), and bullying (Cho et al., Reference Cho, Zatto and Hoglund2022; Espelage & Holt, Reference Espelage and Holt2001; Mitsopoulou & Giovazolias, Reference Mitsopoulou and Giovazolias2015; Rey et al., Reference Rey, Espino, Ojeda and Mora-Merchán2022; Wang et al., Reference Wang, Iannotti and Nansel2009). Mild and infrequent stressors can be beneficial for psychosocial development (Johnson & Johnson, Reference Johnson and Johnson1996; Scholte & Aken, Reference Scholte and Aken2007). However, when stress exposure is chronic, it can result in increased signs and symptoms of psychopathology, including depressive disorders, anxiety disorders, and substance use disorders (Copeland et al., Reference Copeland, Wolke, Angold and Costello2013; Costello et al., Reference Costello, Copeland and Angold2011; La Greca & Harrison, Reference La Greca and Harrison2005; LeMoult et al., Reference LeMoult, Humphreys, Tracy, Hoffmeister, Ip and Gotlib2020; Mullan et al., Reference Mullan, Golm, Juhl, Sajid and Brandt2023; Rapee et al., Reference Rapee, Oar, Johnco, Forbes, Fardouly, Magson and Richardson2019; Roberts et al., Reference Roberts, Attkisson and Rosenblatt1998).
Emerging research suggests that one possible mechanism by which peer stress exposure increases the risk for psychopathology in adolescence is through altered positive valence systems (PVS) functioning (Kujawa et al., Reference Kujawa, Klein, Pegg and Weinberg2020). The PVS is a domain of the NIMH Research Domain Criteria (RDoC), encompassing positive emotionality, and neurophysiological and behavioral processes related to anticipating, obtaining, and responding to positive or rewarding stimuli (National Institute of Mental Health, 2019). PVS function can be measured via multiple units of analysis, including self-report, behavior, and neural responses (National Institute of Mental Health, 2019). Reduced activation of PVS has been found in individuals with current psychopathology, including depression (Baskin-Sommers & Foti, Reference Baskin-Sommers and Foti2015; Epstein et al., Reference Epstein, Pan, Kocsis, Yang, Butler, Chusid, Hochberg, Murrough, Strohmayer, Stern and Silbersweig2006; Halahakoon et al., Reference Halahakoon, Kieslich, O’Driscoll, Nair, Lewis and Roiser2020; Hill et al., Reference Hill, Dickey, Pegg, Dao, Arfer and Kujawa2023; Robinson et al., Reference Robinson, Cools, Carlisi, Sahakian and Drevets2012). Research using functional magnetic resonance imaging (fMRI) and event-related potential (ERP) methodologies also suggests that reduced PVS activation may be a vulnerability marker for future depression in currently euthymic individuals (Keren et al., Reference Keren, O’Callaghan, Vidal-Ribas, Buzzell, Brotman, Leibenluft, Pan, Meffert, Kaiser, Wolke, Pine and Stringaris2018; Kujawa & Burkhouse, Reference Kujawa and Burkhouse2017; Proudfit et al., Reference Proudfit, Bress, Foti, Kujawa and Klein2015; Sharp et al., Reference Sharp, Kim, Herman, Pane, Reuter and Strathearn2014).
Critically, stress exposure has been associated with blunted functioning of the PVS, and particularly neural and behavioral measures of reward sensitivity (for a review, see, e.g., Kujawa et al., Reference Kujawa, Klein, Pegg and Weinberg2020). Both laboratory-induced and naturalistic stress exposure have been associated with reduced activation of the PVS (Burani et al., Reference Burani, Gallyer, Ryan, Jordan, Joiner and Hajcak2021, Reference Burani, Brush, Shields, Klein, Nelson, Slavich and Hajcak2022; Ethridge et al., Reference Ethridge, Sandre, Dirks and Weinberg2018, Reference Ethridge, Ali, Racine, Pruessner and Weinberg2020; Freeman et al., Reference Freeman, Carpentier and Weinberg2023; Hanson et al., Reference Hanson, Hariri and Williamson2015, Reference Hanson, Albert, Iselin, Carré, Dodge and Hariri2016; Hill et al., Reference Hill, Dickey, Pegg, Dao, Arfer and Kujawa2023; Lincoln et al., Reference Lincoln, Pisoni, Bondy, Kumar, Singleton, Hajcak, Pizzagalli and Auerbach2019; Pegg & Kujawa, Reference Pegg and Kujawa2024). In particular, reduced PVS activation has been repeatedly associated with interpersonal stress exposure. Cross-sectional studies in adolescents and emerging adults have found that blunted reward responsiveness was associated with greater peer stress exposure (Ethridge et al., Reference Ethridge, Sandre, Dirks and Weinberg2018; Panier et al., Reference Panier, Ethridge, Farrell-Reeves, Punturieri, Kujawa, Dirks and Weinberg2022; Rappaport et al., Reference Rappaport, Hennefield, Kujawa, Arfer, Kelly, Kappenman, Luby and Barch2019). Longitudinal research using fMRI has also found that peer victimization in early adolescence prospectively predicted decreased response to rewards in the medial prefrontal cortex later into adolescence (Casement et al., Reference Casement, Guyer, Hipwell, McAloon, Hoffmann, Keenan and Forbes2014). Thus, PVS functioning, and perhaps more specifically the PVS subconstruct of reward functioning, is a promising candidate for a mechanism of the effect of peer stress exposure on the emergence of depression.
However, not every adolescent exposed to peer stress develops psychopathology or shows altered PVS functioning (Anderson et al., Reference Anderson, Sladek and Doane2020; Dennison et al., Reference Dennison, Sheridan, Busso, Jenness, Peverill, Rosen and McLaughlin2016; Hazel et al., Reference Hazel, Oppenheimer, Technow, Young and Hankin2014; Herman-Stahl & Petersen, Reference Herman-Stahl and Petersen1996; Rudolph et al., Reference Rudolph, Monti, Modi, Sze and Troop-Gordon2020), suggesting it is also important to identify factors that buffer against the adverse effects of stress exposure. A high-quality parent–child relationship (PCR) may be one such buffer (Gunnar, Reference Gunnar2017; Hazel et al., Reference Hazel, Oppenheimer, Technow, Young and Hankin2014; Lila et al., Reference Lila, Aken, Musitu and Buelga2007; Rudolph et al., Reference Rudolph, Monti, Modi, Sze and Troop-Gordon2020; Scholte & Aken, Reference Scholte and Aken2007). Both cross-sectional (Barrera & Garrison-Jones, Reference Barrera and Garrison-Jones1992; Steinberg, Reference Steinberg2001) and longitudinal (Ge et al., Reference Ge, Natsuaki, Neiderhiser and Reiss2009; for a review, see, e.g., Shore et al., Reference Shore, Toumbourou, Lewis and Kremer2018) data from children and adolescents indicate that high-quality PCRs are associated with lower levels of depression. Similarly, positive parenting behaviors (e.g., warmth, closeness) have been associated with more adaptive reward functioning in adolescents and adults (Griffith et al., Reference Griffith, Wears, McDonald, Silk, Price and Woody2025; Morgan et al., Reference Morgan, Shaw and Forbes2014; Schneider et al., Reference Schneider, Brassen, Bromberg, Banaschewski, Conrod, Flor, Gallinat, Garavan, Heinz, Martinot, Nees, Rietschel, Smolka, Ströhle, Struve, Schumann and Büchel2012), suggesting PCRs can shape PVS functioning. In addition, there is evidence from child samples that parental support can reduce the negative outcomes of stressors (Gunnar, Reference Gunnar2017). This has been demonstrated using both laboratory (Hostinar et al., Reference Hostinar, Johnson and Gunnar2015; Seltzer et al., Reference Seltzer, Ziegler and Pollak2010) and real-world stressors (Nystad et al., Reference Nystad, Drugli, Lydersen, Lekhal and Buøen2021; Patterson et al., Reference Patterson, Cohn and Kao1989), and has been measured across multiple units of analysis, including cortisol reactivity (Hostinar et al., Reference Hostinar, Johnson and Gunnar2015; Nystad et al., Reference Nystad, Drugli, Lydersen, Lekhal and Buøen2021; Seltzer et al., Reference Seltzer, Ziegler and Pollak2010) and behavioral problems (Patterson et al., Reference Patterson, Cohn and Kao1989).
Despite this, it is not clear whether a high-quality PCR continues to buffer against exposure to peer stress in adolescence, during which time adolescents often seek more social support from friends and peers than from family (Furman & Buhrmester, Reference Furman and Buhrmester1992; del Valle et al., Reference del Valle, Bravo and López2010). The results of some studies suggest that parental buffering effects are reduced or diminished in adolescents (Burton et al., Reference Burton, Stice and Seeley2004; Hostinar et al., Reference Hostinar, Johnson and Gunnar2015; Yeung Thompson & Leadbeater, Reference Yeung Thompson and Leadbeater2013). It is possible that as peers become more involved in adolescents’ lives, peer support outweighs parental support in protecting against stressful events (Burton et al., Reference Burton, Stice and Seeley2004). Yet other research has suggested a continued parental buffering effect into adolescence (Ge et al., Reference Ge, Natsuaki, Neiderhiser and Reiss2009), including studies that have investigated parental buffering of peer stress specifically (Conners-Burrow et al., Reference Conners-Burrow, Johnson, Whiteside-Mansell, McKelvey and Gargus2009; Davidson & Demaray, Reference Davidson and Demaray2007; Hazel et al., Reference Hazel, Oppenheimer, Technow, Young and Hankin2014; Rudolph et al., Reference Rudolph, Monti, Modi, Sze and Troop-Gordon2020; Tanigawa et al., Reference Tanigawa, Furlong, Felix and Sharkey2011; Wenz-Gross et al., Reference Wenz-Gross, Siperstein, Untch and Widaman1997). However, these studies have tended to focus on symptoms of psychopathology as outcomes (e.g., Conners-Burrow et al., Reference Conners-Burrow, Johnson, Whiteside-Mansell, McKelvey and Gargus2009; Hazel et al., Reference Hazel, Oppenheimer, Technow, Young and Hankin2014; Rudolph et al., Reference Rudolph, Monti, Modi, Sze and Troop-Gordon2020; Tanigawa et al., Reference Tanigawa, Furlong, Felix and Sharkey2011; Wenz-Gross et al., Reference Wenz-Gross, Siperstein, Untch and Widaman1997). Although emerging research has shown that low PCR quality (e.g., conflict) moderates the association between depressive symptoms and reduced reward functioning (Hill et al., Reference Hill, Dickey, Pegg, Dao, Arfer and Kujawa2023), less is known about potential protective effects of parental buffering on PVS function.
Additionally, parents are not the only sources of stress-buffering for adolescents. Other family members, such as siblings (Fry et al., Reference Fry, Telzer and Rogers2021; Gass et al., Reference Gass, Jenkins and Dunn2007; Milevsky & Levitt, Reference Milevsky and Levitt2005), and grandparents (Attar-Schwartz & Buchana, Reference Attar-Schwartz and Buchana2019; Lila et al., Reference Lila, Aken, Musitu and Buelga2007; Milevsky & Levitt, Reference Milevsky and Levitt2005; Oliva & Arranz, Reference Oliva and Arranz2005) are also important sources of support. Further, there is evidence that support from other family members has an incremental positive effect on adolescents’ adjustment, over and above parental support (Fry et al., Reference Fry, Telzer and Rogers2021; Levetan & Wild, Reference Levetan and Wild2016; Lila et al., Reference Lila, Aken, Musitu and Buelga2007; Van Heerden & Wild, Reference Van Heerden and Wild2018). Thus, in addition to investigating the buffering role of high-quality PCRs, the current study also considered the quality of relationships with other family members (e.g., siblings, grandparents, and parents’ marital status) as a protective factor against the adverse effects of peer stress exposure on PVS functioning in adolescence.
To achieve this, we used multiple measures of PVS functioning, focusing primarily on reward-related processes as a subcomponent of PVS. Past research showed that different measures of PVS often do not correlate strongly with each other (De Los Reyes et al., Reference De Los Reyes, Drabick, Makol and Jakubovic2020; Park et al., Reference Park, Banica and Weinberg2023; Patrick & Hajcak, Reference Patrick and Hajcak2016), suggesting that each unit of analysis may be tapping into a slightly different aspect of the construct, and that they combine to influence functioning (De Los Reyes et al., Reference De Los Reyes, Drabick, Makol and Jakubovic2020). By employing multiple units of analysis, the current study aims to provide a more holistic understanding of our research question. To that end, we included a self-report measure, a behavioral measure, and three neurophysiological measures of reward sensitivity. For our self-report measure, we used the PVS Scale (Khazanov et al., Reference Khazanov, Ruscio and Forbes2020), which measures participants’ perception of their PVS functioning, including reward sensitivity. For our behavioral measure, we employed a well-validated reward learning paradigm (Pizzagalli et al., Reference Pizzagalli, Jahn and O’Shea2005), which captures participants’ ability to learn from rewards and modulate behaviors accordingly.
Finally, at the neurophysiological level, we measured the reward positivity (RewP). The RewP occurs approximately 250–350 ms following the onset of reward feedback and is more positive in amplitude following reward feedback relative to loss or no-reward feedback (Holroyd et al., Reference Holroyd, Pakzad-Vaezi and Krigolson2008; Proudfit, Reference Proudfit2015). Converging evidence suggests that the RewP may be generated by the anterior cingulate cortex (ACC) and the striatum and reflect reward signaling from the midbrain dopamine system (Becker et al., Reference Becker, Nitsch, Miltner and Straube2014; Holroyd & Coles, Reference Holroyd and Coles2002; Holroyd & Umemoto, Reference Holroyd and Umemoto2016; Santesso et al., Reference Santesso, Dillon, Birk, Holmes, Goetz, Bogdan and Pizzagalli2008). The RewP can be elicited with feedback signaling receipt of multiple types of reward, but there are only modest associations between the components elicited across tasks and incentives (Banica et al., Reference Banica, Schell, Racine and Weinberg2022, Reference Banica, Allison, Racine, Foti and Weinberg2023; Beatty et al., Reference Beatty, Gair, Anatala, Klein, Hajcak and Nelson2024; Distefano et al., Reference Distefano, Jackson, Levinson, Infantolino, Jarcho and Nelson2018; Ethridge et al., Reference Ethridge, Kujawa, Dirks, Arfer, Kessel, Klein and Weinberg2017; Freeman et al., Reference Freeman, Carpentier and Weinberg2023), suggesting that different incentive types capture distinct variance in reward sensitivity and there is utility in assessing domain-specific responding. The current study therefore examined the RewP in tasks delivering monetary, social, and food rewards.
Taken together, the current study investigated whether high-quality relationships with parents or other family members could buffer against the effects of real-world peer stress on multiple measures of reward functioning and broader PVS functioning among pre-adolescents and early-to-mid adolescents (ages 9–16 years old). Building upon extant literature suggesting the protective role of parental support in buffering against the adverse effects of stress exposure (Ge et al., Reference Ge, Natsuaki, Neiderhiser and Reiss2009; Hazel et al., Reference Hazel, Oppenheimer, Technow, Young and Hankin2014; Rudolph et al., Reference Rudolph, Monti, Modi, Sze and Troop-Gordon2020; Wenz-Gross et al., Reference Wenz-Gross, Siperstein, Untch and Widaman1997), we hypothesized that a high-quality PCR would continue to buffer against the effects of peer stress during adolescence. Specifically, we predicted that greater peer stress would be associated with reduced PVS activity across units of measurement. We further predicted that this effect would be qualified by an interaction with PCR, such that, when the relationship with parents was of higher quality, the association between peer stress and measures of PVS function would be weaker. We also explored this same question with family relationships (excluding parental relationships) as a buffer.
Method
Participants
Participants were adolescents recruited from Montreal and the surrounding area using online and print advertisements. Adolescents were eligible if they were between the ages of 9 and 16 years old, fluent in either English or French and had not experienced a head trauma resulting in loss of consciousness for 10 minutes or longer in the previous five years. Based on the results of the screening process, 174 adolescents were eligible to participate.
From this sample, four participants were excluded from the present analyses due to poor quality EEG recordings for the Doors task, including fewer than six artifact-free trials at the electrode site of interest (Ethridge & Weinberg, Reference Ethridge and Weinberg2018) and data with extensive artifacts that could not be adequately interpolated, and two were excluded because of technological difficulties with EEG equipment. Additionally, three participants were excluded due to missing self-report data. Therefore, the final sample consisted of 165 participants between the ages of 9 and 16 years old (M age = 11.93, SD = 1.71), 49.09% of whom were female. Regression models were run on all available cases for each dependent variable, as a result, sample sizes differ slightly across analyses. Three additional participants were excluded from food RewP analyses due to poor EEG quality (N = 162), six participants were excluded from social RewP due to poor EEG quality (N = 159), and nine participants were excluded from the behavioral task due to missingness (i.e., did not complete the task) (N = 156). In the full sample, adolescents were 78.18% White, 9.70% Asian/Pacific Islander, 6.67% Biracial, 1.21% Black, 1.21% Hispanic, 1.82% a different race or ethnicity, and 1.21% preferred not to disclose their race or ethnicity. The median annual household income of the sample was C$100,000 - C$149,999 (range = $10,000–$19,999 to greater than $250,000). Parents of ten participants (6.06%) declined to disclose their annual family income. Among the adolescents, 77.58% were living with both parents in the same home, 10.91% were living with both parents part-time (i.e., shared custody), 8.48% were living with mother full-time, 1.21% were living with father full-time, 1.21% were living full-time with mother with father living at home part-time, and 0.61% chose not to provide this information.
Procedure
Eligible adolescents provided assent, and their parents completed informed consent. Participants then completed a battery of questionnaires using Qualtrics online survey software (SAP America Inc.). Once in the laboratory, parents and adolescents completed informed consent for the remaining study procedures. Adolescents completed a series of computer tasks while EEG was recorded. Within two weeks of the laboratory visit (either before or after), adolescents completed a diagnostic interview, the UCLA life stress interview (UCLA-LSI; Hammen, Reference Hammen1991), and three online behavioral games through Inquisit Web (Millisecond Software LLC, Seattle) on their personal devices. Clinical psychology graduate students or post-baccalaureate research coordinators conducted interviews in either English or French, and training and supervision of interviews was provided by a clinical psychology faculty member (AW) at monthly review meetings. Data were collected from April 2021 to November 2023. Due to COVID-19 restrictions on in-person data collection, the online portion (questionnaires and interviews) were conducted 1–10 months (M = 4.63, SD = 2.03, N = 157) prior to the in-person visit. Participants recruited after October 2023 (N = 8) completed the online portion within two weeks of the in-person visit.
In addition to completing the monetary, social, and food reward tasks, adolescents also completed two other EEG tasks. The order of the computer tasks was counterbalanced across participants. Each family received C$25/hour per participant for their participation in the laboratory visit and C$112.5 for the online part of the study. All procedures were approved by McGill University’s Research Ethics Board.
Measures
Interview
The UCLA Life Stress Interview for Adolescents (UCLA-LSI; Hammen, Reference Hammen1991) was used to assess chronic and ongoing stress exposure in major role domains in the past two years (i.e., academic, peer, romantic relationship, family, health, finance, and disappointment). Interviewers rated domains of participant reported chronic stress on a scale from 1 (e.g., for peer support, absence of peer support, frequent peer rejection, and conflict) to 5 (e.g., absence of peer conflict, getting along well with others). For analyses, the ratings were reverse-coded, so that a higher rating indicates greater stress and lower quality relationships, and a lower rating indicates lower stress and higher-quality relationships. Peer stress is the rating of general social life (e.g., high stress/low quality – total isolation from peers or frequent peer conflicts and rejection; low stress/high quality – very popular, engages in frequent social activities, and gets along well with others). PCR quality assesses the average of the relationship with both parents (e.g., low quality – poor quality relationship with parents, no other family members for support; high quality – exceptional quality relationship with parents), and family relationship quality includes the relationship with other family members excluding parents as well as the marital relationship between parents (e.g., low quality – poor quality relationships with relatives, significant tension between parents, has no other family members for support; high quality – exceptional quality relationship with other family members and minimal conflicts between parents). Ratings were made during or immediately after the interview. To ensure reliability, the interview team and the supervisor (AW) held monthly meetings where a subset of ratings from each interviewer was re-rated collectively. If discrepancies between the interviewer and the team ratings appeared, interview details were revisited and discussed until consensus was achieved. For analyses, the consensus ratings were used. This approach aligns with methods from previous studies on chronic stress in adolescents (Mackin et al., Reference Mackin, Kotov, Perlman, Nelson, Goldstein, Hajcak and Klein2019; Sandre et al., Reference Sandre, Park, Freeman, Banica, Ethridge and Weinberg2023; Snyder et al., Reference Snyder, Young and Hankin2019), and research indicates that consensus ratings are significantly more valid than individual interviewer ratings (Pulakos et al., Reference Pulakos, Schmitt, Whitney and Smith1996).
Self-report questionnaire
Participants completed the Positive Valence Systems Scale, 21 items (PVSS-21; Khazanov et al., Reference Khazanov, Ruscio and Forbes2020). The PVSS-21 is a 21-item self-report measure of the RDoC PVS domain. Items assess reward sensitivity over the past two weeks, and participants make their responses using a 9-point Likert scale ranging from 1 (extremely untrue of me) to 9 (extremely true of me). The PVSS-21 has demonstrated good internal consistency, test–retest reliability, and factorial validity across three diverse samples (Khazanov et al., Reference Khazanov, Ruscio and Forbes2020). The present investigation focused on the composite score calculated by averaging the 21 items. Any missing item was replaced with the average of the other two items of the same subscale for each participant (range = 2.14-9; alpha = 0.92). The scale was also distributed in English and French.
Tasks and materials
Probabilistic reward task
Outside of the lab, participants completed an online Probabilistic Reward Task (PRT; Pizzagalli et al., Reference Pizzagalli, Jahn and O’Shea2005) on their personal devices using Inquisit Web (Millisecond Software LLC, Seattle). The PRT is designed to provide a quantitative measure of reward responsiveness and reward learning by examining response bias for more- versus less-frequently rewarded stimuli (Pizzagalli et al., Reference Pizzagalli, Jahn and O’Shea2005). For more details on this task, see the supplement. Response bias, which measures the systematic preference for the response associated with the more frequent reward, was computed as:
 \begin{align}\log b={1 \over 2}\log \left( {\textit{Frequent}_{\textit{correct}}*\textit{Infrequent}_{\textit{incorrect}} \over \textit{Frequent}_{\textit{incorrect}}*\textit{Infrequent}_{\textit{correct}}}\right)\end{align}
A higher log b value indicates a higher response bias toward the more frequently rewarded stimulus.
To elicit the RewP to monetary, social, and food rewards, participants completed the Doors task (Hajcak et al., Reference Hajcak, Holroyd, Moser and Simons2005), the Island Getaway Task (IG; Kujawa et al., Reference Kujawa, Arfer, Klein and Proudfit2014), and the Plates task (Banica et al., Reference Banica, Schell, Racine and Weinberg2022; for details on all EEG tasks, please see the supplement). All tasks were completed on an Intel Core i7 computer using Presentation (Neurobehavioral Systems, Inc.; Albany, CA) or PsychoPy (Peirce et al., Reference Peirce, Gray, Simpson, MacAskill, Höchenberger, Sogo, Kastman and Lindeløv2019) software. All stimuli were displayed on a 19-in. (48.3 cm) computer monitor.
Electroencephalogram recording and data processing
During the Doors, IG, and Plates tasks, we recorded continuous EEG with a 32-electrode cap based on the standard 10/20 layout using a BrainVision actiCHamp system (Brain Products, Munich, Germany) with a ground electrode at site FPz. We recorded data at a sampling rate of 1,000 Hz. Offline analyses were done with BrainVision Analyzer software 2.2 (Brain Products, Munich, Germany). Unsegmented data were band-pass filtered with low and high cutoffs of 0.1 and 30 Hz, respectively, with a Butterworth zero-phase filter with a 24 db/octave roll-off.
For each trial in the Doors, IG, and Plates tasks, the EEG was segmented into 2,500 ms windows starting 1,000 ms before feedback onset and continuing for 1,500 ms post-feedback. In all tasks, data were then referenced to the average of the left (TP9) and right (TP10) mastoids. Ocular corrections were done using FT9 for horizontal eye movements and FP1 for vertical eye movements (Pegg et al., Reference Pegg, Dao, Venanzi, Hill and Kujawa2024) based on Gratton and Coles’ (Gratton et al., Reference Gratton, Coles and Donchin1983) method. We then conducted artifact rejection using an automatic procedure where individual channels were removed from a trial if they had a voltage difference of more than 150 μV within 200 ms intervals, a voltage difference of less than 0.5 μV within 100 ms intervals, and a voltage step of more than 30 μV between sample points. Each trial of the Doors, IG, and Plates tasks were re-segmented separately into 1,200 ms, 1,500 ms, and 1,200 ms segments, respectively, and separate averages for positive and negative feedback trials were then created. The mean voltage in the time window from −200 to 0 ms (Doors and Plates) or −200 to 0 ms (IG) pre-feedback served as a baseline and was subtracted from each data point.
In the Doors and Plates task, we quantified the RewP as the average activity from 250 to 350 ms following gain feedback at electrode site Cz, guided by previous research (Banica et al., Reference Banica, Schell, Racine and Weinberg2022; Ethridge & Weinberg, Reference Ethridge and Weinberg2018; Proudfit, Reference Proudfit2015) and visual inspection of the grand averaged waveforms. For the IG task, previous research has demonstrated that while the RewP is still maximal at site Cz, the optimal time window for scoring is typically later than in Doors or Plates (Ethridge et al., Reference Ethridge, Kujawa, Dirks, Arfer, Kessel, Klein and Weinberg2017; Rappaport et al., Reference Rappaport, Hennefield, Kujawa, Arfer, Kelly, Kappenman, Luby and Barch2019). Based on visual inspection of the grand averaged waveforms and topography, we quantified the social RewP as the average activity from 300 to 400 ms following acceptance feedback at site Cz.
We calculated the split-half reliability of the ERPs based on averages of odd and even trials. For the Doors task, the Spearman-Brown coefficient was r = .69 for gain-related neural activity and r = .59 for loss-related neural activity. For the IG task, the Spearman-Brown coefficient was r = .79 for acceptance-related neural activity and r = .66 for rejection-related neural activity. For the Plates task, the Spearman-Brown coefficient was r = .68 for gain-related neural activity and r = .65 for loss-related neural activity.
Unstandardized residual RewP scores (Meyer et al., Reference Meyer, Lerner, De Los Reyes, Laird and Hajcak2017; RewPresid) were calculated separately for neural activity elicited during the Doors, IG, and Plates tasks (Banica et al., Reference Banica, Schell, Racine and Weinberg2022; Ethridge & Weinberg, Reference Ethridge and Weinberg2018). Specifically, participants’ ERPs to loss or rejection were modeled as the predictor, and ERPs to gain or acceptance served as the dependent variable in a regression analysis. Unstandardized residual scores from each regression analysis were saved and used as the monetary RewPresid, the social RewPresid, or the food RewPresid.
Data analysis
Statistical analyses were performed using RStudio software version 4.3.1 (R Core Team, 2023). We used multiple regressions with robust standard errors to examine whether the interaction of peer stress and PCR quality predicts various measures of PVS functioning (i.e., monetary RewPresid, social RewPresid, food RewPresid, PVSS averaged reward sensitivity, and response bias log b). The same set of analyses were then conducted with peer stress and relationship quality with other family members. All analyses were adjusted for adolescents’ age, given its expected associations with reward function (Burani et al., Reference Burani, Mulligan, Klawohn, Luking, Nelson and Hajcak2019; Melo et al., Reference Melo, Schreuder, Groen, Sarsembayeva and Hartman2023), PCR (Furman & Buhrmester, Reference Furman and Buhrmester1992; Larson et al., Reference Larson, Moneta, Richards, Holmbeck and Duckett1996), and peer stress exposure (Cho et al., Reference Cho, Zatto and Hoglund2022; Noakes & Rinaldi, Reference Noakes and Rinaldi2006). Due to the presence of 36 pairs of siblings, adjustments were made for family clusters (i.e., robust standard errors). All variables were examined with Grubb’s test for outliers (Grubbs, Reference Grubbs1969), and any univariate outlier was winsorized by replacing it with the nearest non-outlying value.
Results
Reward-related neural activity
Figure 1 displays ERP waveforms of all participants’ average neural response to reward/acceptance, loss/rejection, the residual score (e.g., gain regressed onto loss), and the topographic maps showing the difference activity (e.g., gain minus loss) for monetary, social, and food reward.
ERP average waveforms and topographic maps following monetary, social, and food reward. Note. The first column displays waveforms following gain, loss, and the residuals (gain regressed onto loss) wave, at electrode site Cz for a) monetary, b) social, and c) food reward. The second column displays topographic maps that show the average difference between gain and loss responses from d) and f) 250 ms to 350 ms post-feedback onset for monetary and food reward, and from e) 300 ms to 400 ms post-feedback onset for social reward.
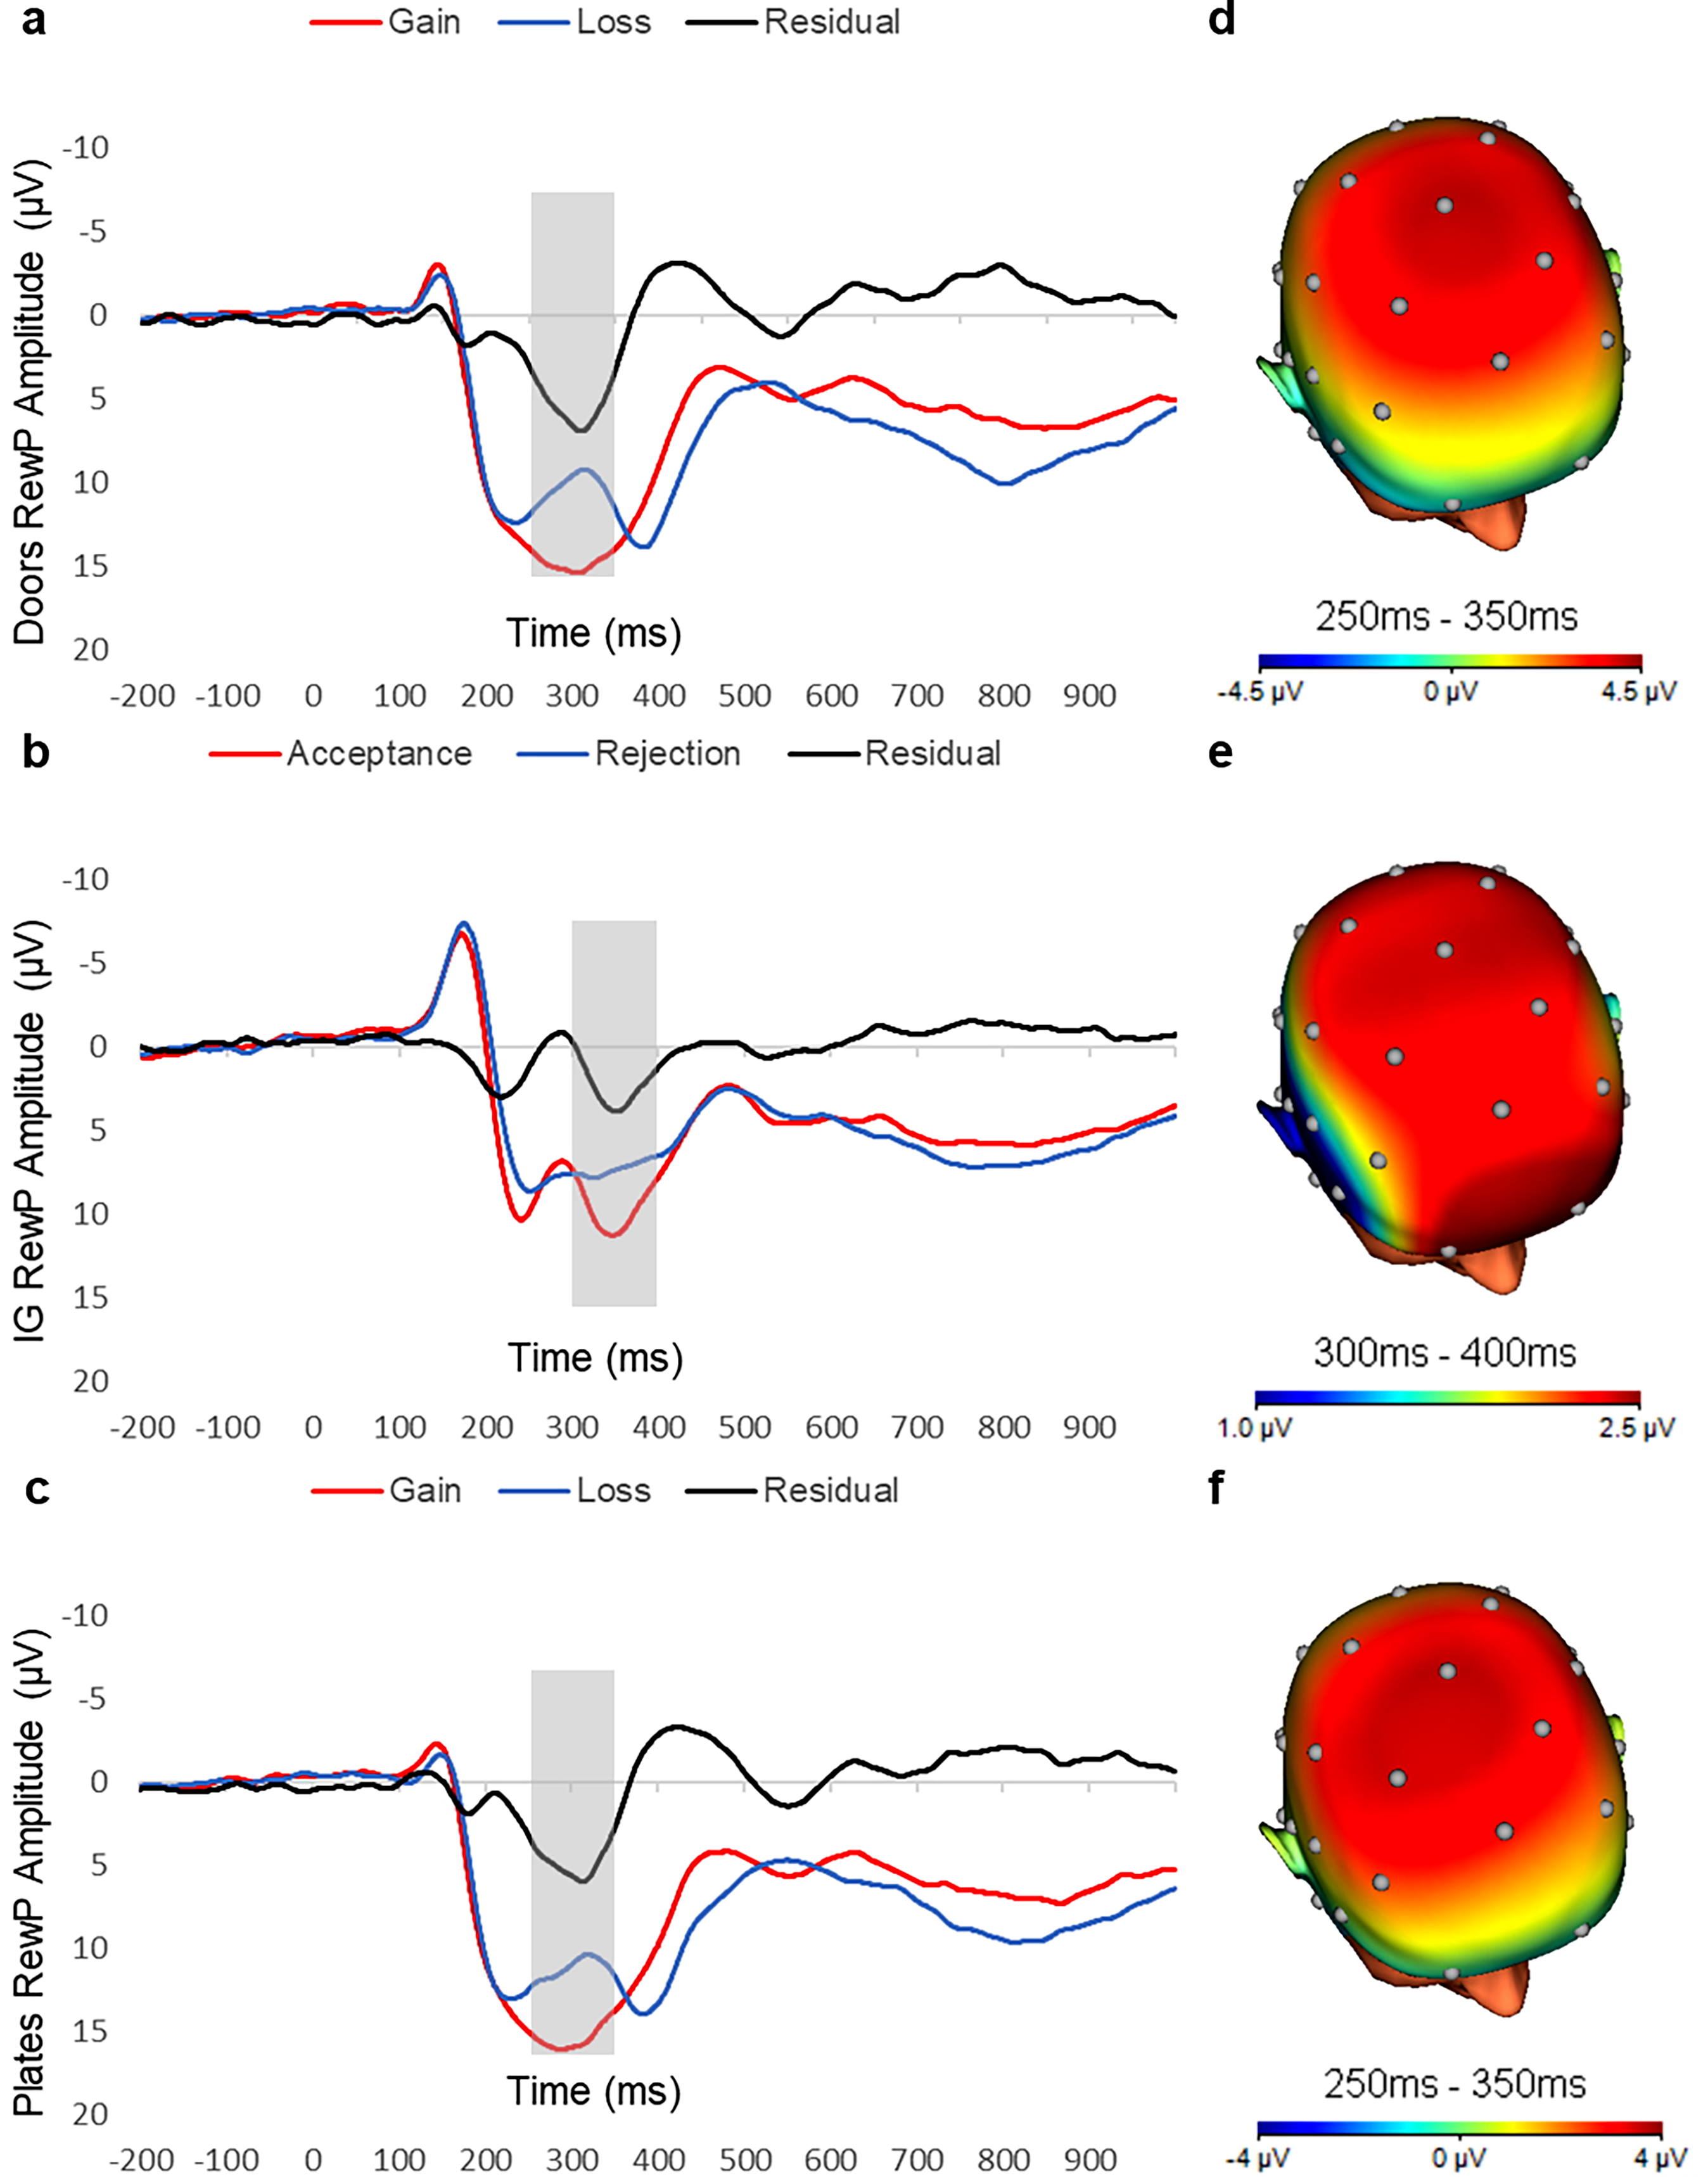
Figure 1. Long description
Panel A: A line graph displays ERP average waveforms following monetary reward. The x-axis represents time in milliseconds, ranging from -200 to 900 milliseconds, and the y-axis represents Doors RewP Amplitude in microvolts, ranging from -10 to 20 microvolts. The graph includes three lines: red for Gain, blue for Loss, and black for Residual. Panel B: A line graph shows ERP average waveforms following social reward. The x-axis represents time in milliseconds, ranging from -200 to 900 milliseconds, and the y-axis represents IG RewP Amplitude in microvolts, ranging from -10 to 20 microvolts. The graph includes three lines: red for Acceptance, blue for Rejection, and black for Residual. Panel C: A line graph depicts ERP average waveforms following food reward. The x-axis represents time in milliseconds, ranging from -200 to 900 milliseconds, and the y-axis represents Plates RewP Amplitude in microvolts, ranging from -10 to 20 microvolts. The graph includes three lines: red for Gain, blue for Loss, and black for Residual. Panel D: A topographic map shows the average difference between gain and loss responses for monetary reward from 250 to 350 milliseconds post-feedback onset. The color scale ranges from -4.5 to 4.5 microvolts. Panel E: A topographic map displays the average difference between gain and loss responses for social reward from 300 to 400 milliseconds post-feedback onset. The color scale ranges from 1.0 to 2.5 microvolts. Panel F: A topographic map shows the average difference between gain and loss responses for food reward from 250 to 350 milliseconds post-feedback onset. The color scale ranges from -4 to 4 microvolts.
Results of the Student’s paired t-tests indicated statistically significant condition effects on neural activity at electrode site Cz for monetary reward (mean difference = 4.77; t(164) = 9.89, p < .01), social reward (mean difference = 2.57; t(158) = 5.00, p < .01), and food reward (mean difference = 4.41; t(160) = 8.66, p < .01), such that neural responses to positive feedback were significantly more positive than neural responses following negative feedback. Additionally, we ran a 2 (Condition: gain, loss) x 3 (Task: monetary, social, food) repeated-measures ANOVA to examine condition and task effects, and results were reported in the Supplement.
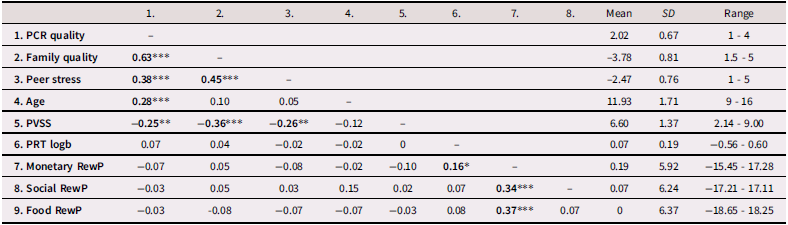
Table 1 shows the descriptive statistics for PCR quality, family relationship quality, chronic peer stress, age, self-reported reward sensitivity, behavioral response bias, and the RewPresid to monetary, social, and food reward. Table 1 also presents bivariate correlations among these variables. As indicated, PCR quality and family relationship quality are positively correlated, and both were positively associated with peer stress (note that a higher score indicates a lower quality relationship). Lower quality parent–child and family relationships and higher levels of peer stress were associated with lower self-reported PVS functioning. Among the different indicators of PVS functioning, there were generally small and non-significant associations, particularly across methods, with the following exceptions: there was a small positive correlation between the monetary RewP and behavioral measures of reward sensitivity. Additionally, the monetary RewP was positively correlated with both the social and food RewPs, which were not significantly correlated with one another.
Descriptive statistics and bivariate correlations between parent–child and family relationship quality, peer stress, self-report, behavioral, and neural measures of reward sensitivity
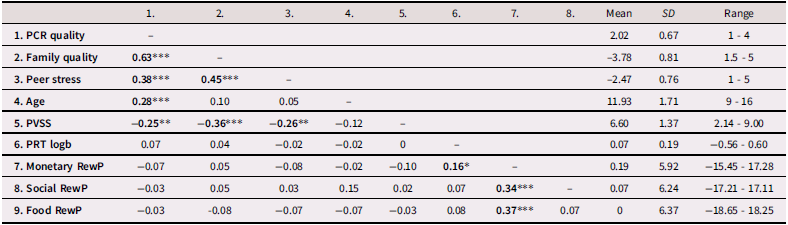
Table 1. Long description
The table presents descriptive statistics and bivariate correlations for several variables. It includes 9 rows and 10 columns. The rows are labeled as follows: PCR quality, Family quality, Peer stress, Age, PVSS, PRT logb, Monetary RewP, Social RewP, and Food RewP. The columns are labeled as follows: 1, 2, 3, 4, 5, 6, 7, 8, Mean, SD, and Range. Each cell contains a value representing the correlation or descriptive statistic for the corresponding row and column. Notable trends include positive correlations between PCR quality and Family quality, and between Family quality and Peer stress. Lower quality parent-child and family relationships and higher levels of peer stress are associated with lower self-reported PVS functioning. There are small and non-significant associations among different indicators of PVS functioning, with exceptions such as a positive correlation between the monetary RewP and behavioral measures of reward sensitivity.
Note: *** p < .001; ** p < .01; * p < .05. Parent–Child Relationship Quality (PCR Quality), Family Relationship Quality (Family Quality; excluding parents), and Peer Stress were collected from UCLA-LSI with 1 being the least stressful (high-quality relationship) and 5 being the most stressful (low quality relationship), such that higher scores reflect lower quality relationships and greater stress exposure. PVSS = reward sensitivity measured by PVSS. PRT logb = behavioral response bias calculated from PRT task. Monetary RewP = monetary RewPresid amplitude (μV) elicited from the Doors task. Social RewP = social RewPresid amplitude (μV) elicited from the IG task. Food RewP = food RewPresid amplitude (μV) elicited from the Plates task. Data from 165 participants were available on Parent–Child Relationship Quality, Peer Stress, Age, PVSS, and Monetary RewP. Family Relationship Quality had 155 data points, PRT logb had 156 data points, Social RewP had 159 data points, and Food RewP had 162 data points.
Parental stress-buffering
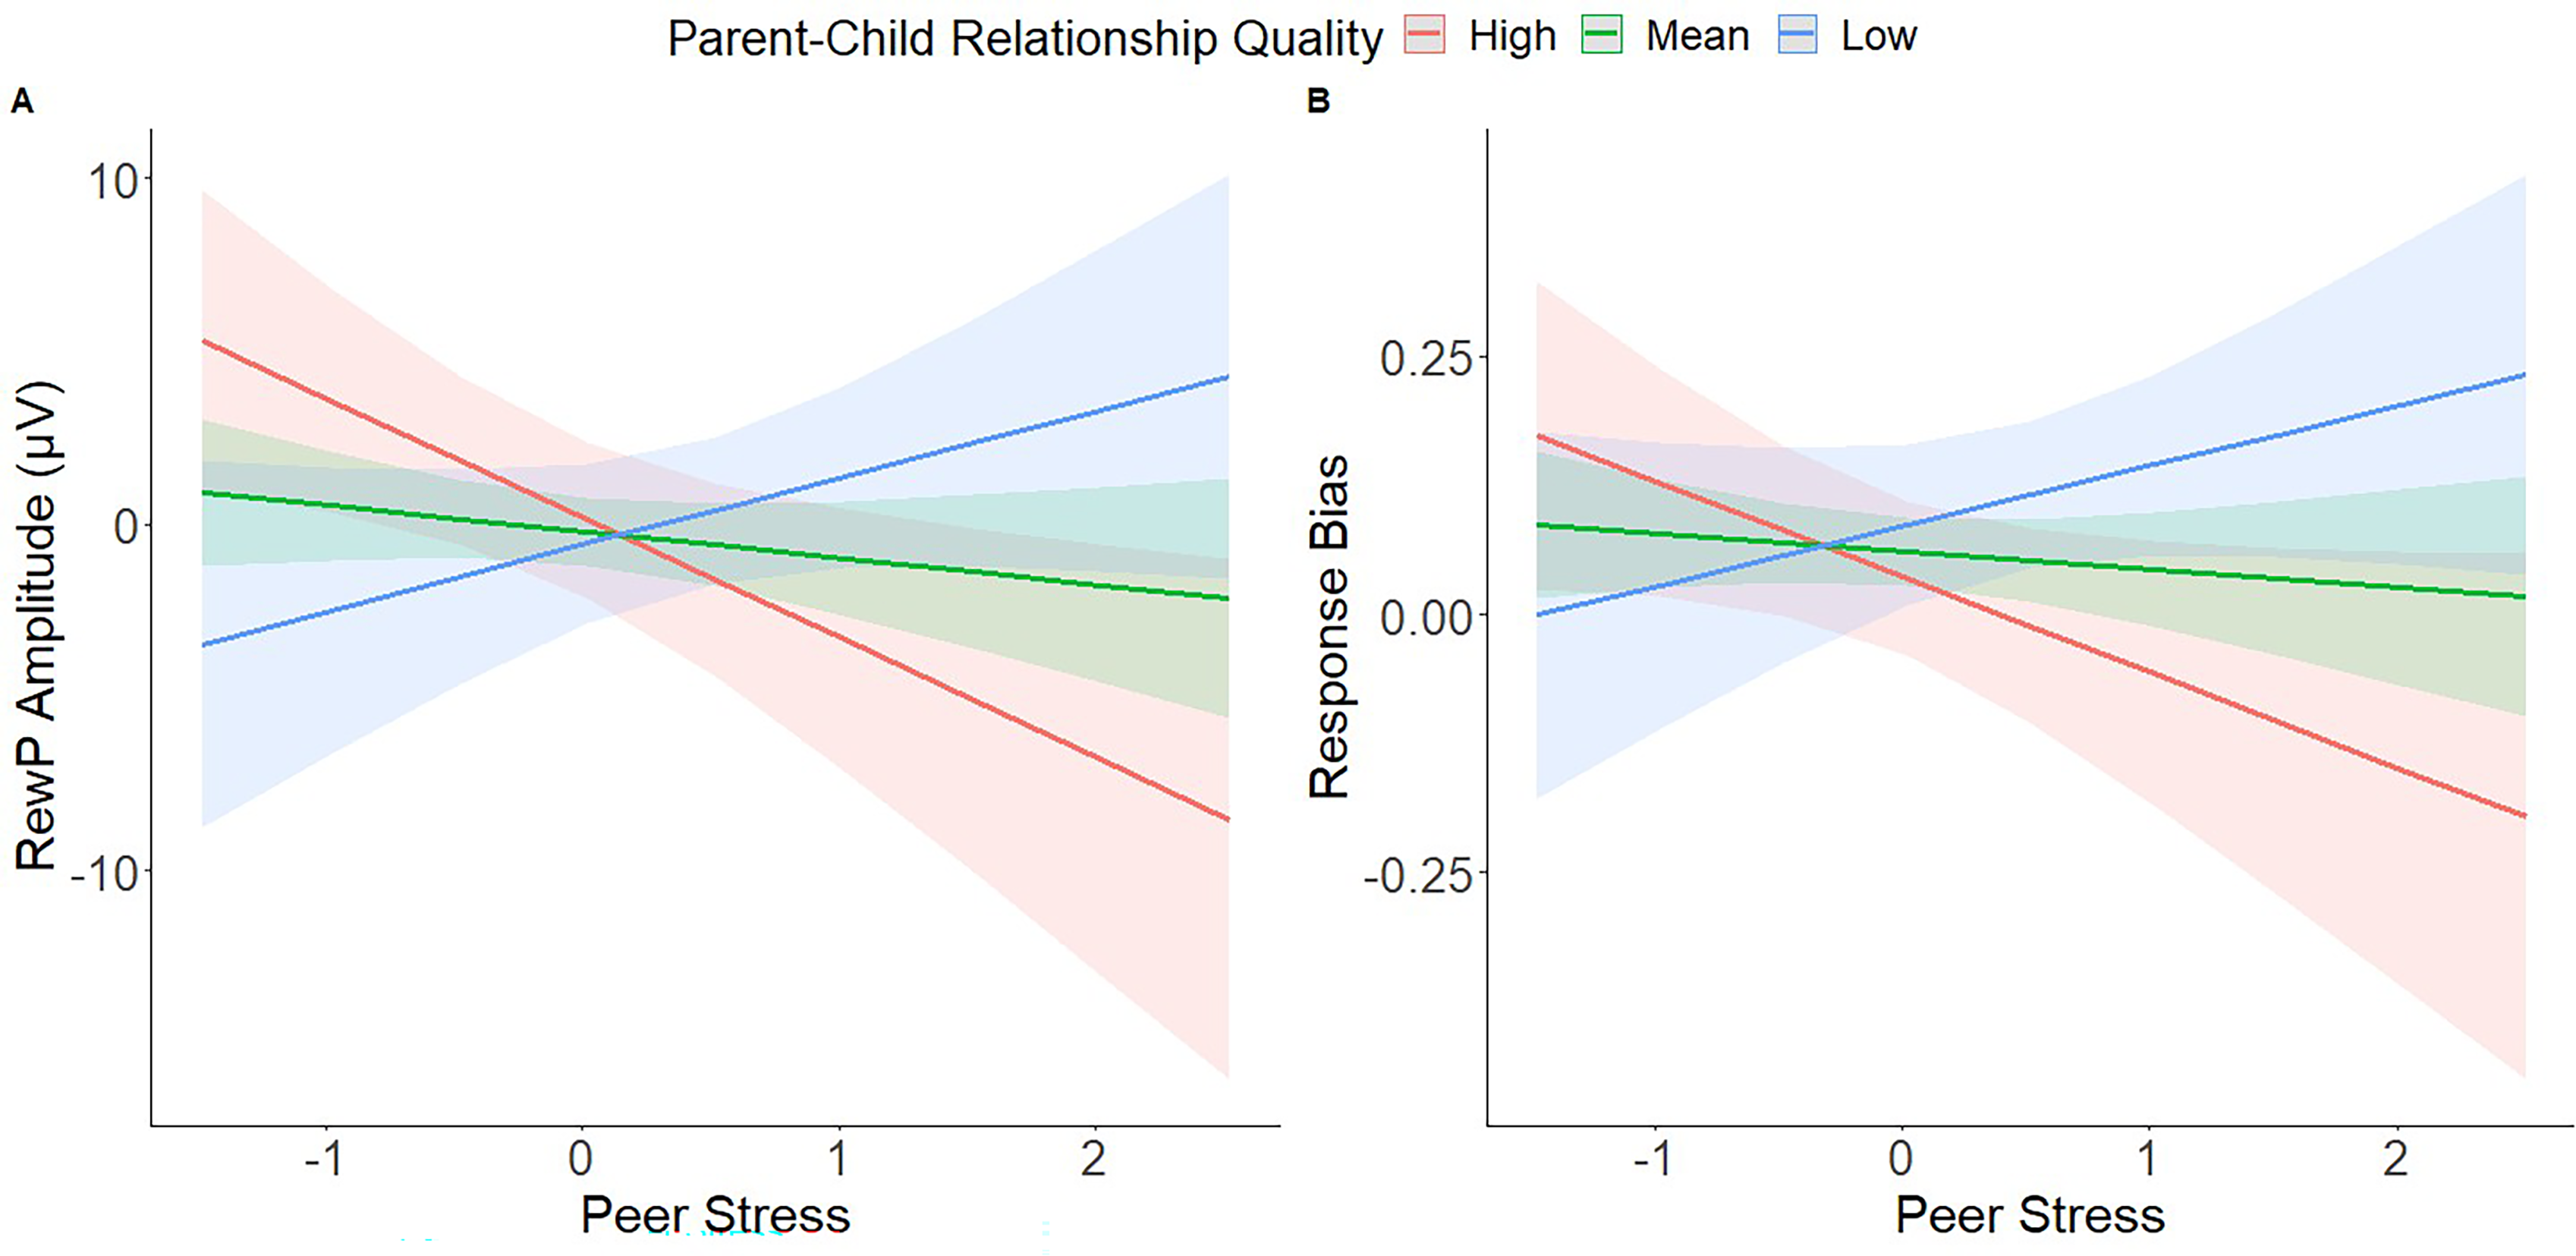
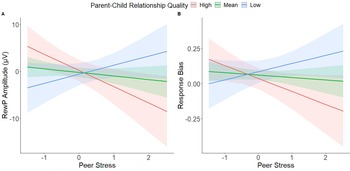
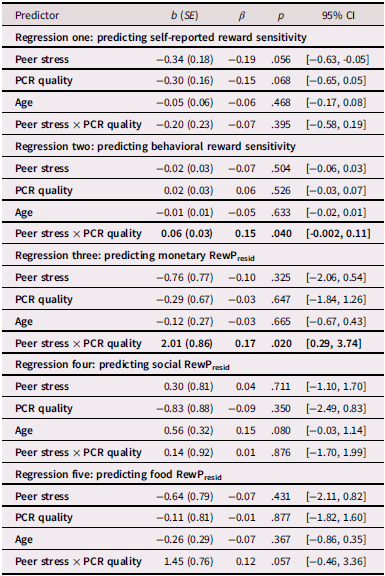
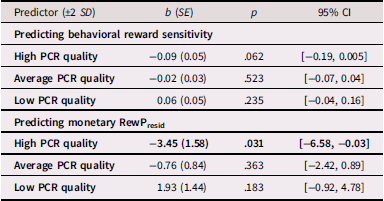
Results of multiple regressions with robust standard errors are displayed in Table 2. The results showed that peer stress and PCR quality interacted to predict both the monetary RewPresid (β = 0.17, p = .020; Figure 2A) and behavioral reward sensitivity (β = 0.15, p = .040; Figure 2B). Specifically, greater peer stress was significantly associated with reduced reward sensitivity, but only in the context of greater PCR quality (less parental stress). Simple slope analyses (Table 3) revealed that, for the monetary RewPresid, the slope of peer stress predicting the RewP was significant when the quality of PCR was high (low parental stress). When predicting behavioral reward sensitivity, though the three slopes differed significantly from one another, none were significant. The effect of the interaction between peer stress and PCR quality predicting food RewPresid (β = 0.12, p = .057) was of a similar magnitude and in the same direction as the interaction predicting the monetary RewP as the outcome, but was not significant. No significant interaction was observed when predicting self-reported reward sensitivity (β = −0.07, p = .395) or social RewPresid (β = 0.01, p = .876) as the outcomes. Sensitivity analyses adjusting for different covariates are reported in the Supplement, including adolescent gender, the time between virtual and in-person lab visit, and adolescent depressive symptoms. The results reported here did not substantively change after inclusion of these covariates.
Interaction plots moderated by different levels of parent–child relationship quality. Note. Plots of simple slopes that depict the effect of chronic peer stress exposure on A) the amplitude of the monetary RewPresid and B) the degree of response bias (i.e., behavioral reward sensitivity) at high (-2 SD), average, and low (+2 SD) levels of parent–child relationship quality, adjusting for age and family clusters.
Results of five separate robust-standard error multiple regression analyses investigating the effects of the interaction between peer stress and parent–child relationship quality on self-reported, behavioral, and neurophysiological measures of PVS functioning
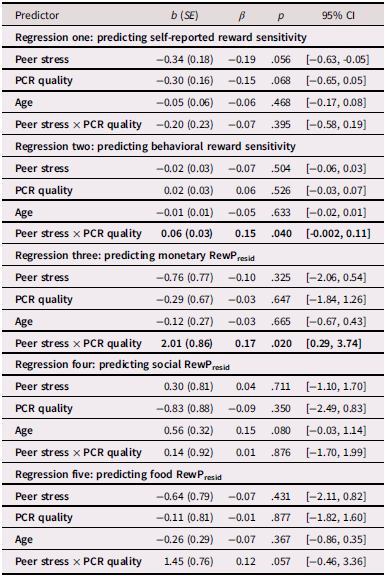
Table 2. Long description
The table presents results of five separate robust-standard error multiple regression analyses. It investigates the effects of the interaction between peer stress and parent-child relationship quality on self-reported, behavioral, and neurophysiological measures of PVS functioning. The table has 21 rows and 6 columns. The columns are labeled Predictor, b (SE), β, p, and 95% CI. The rows are grouped into five regressions: predicting self-reported reward sensitivity, predicting behavioral reward sensitivity, predicting monetary RewPresid, predicting social RewPresid, and predicting food RewPresid. Each regression includes predictors such as Peer stress, PCR quality, Age, and Peer stress x PCR quality. The table lists the values for b (SE), β, p, and 95% CI for each predictor in the respective regressions.
Note. Statistically significant values (p < .05) are bolded. A higher score on PCR Quality scale indicates a lower quality relationship.
Simple slope analyses for associations between peer stress and behavioral reward sensitivity and monetary RewP at different levels of parent child relationship (PCR) quality
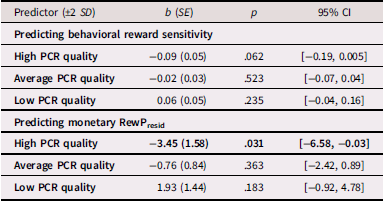
Table 3. Long description
A table with four rows and three columns displaying regression results. The columns are labeled Predictor, b (SE), p, and 95% CI. The table is divided into two sections: Predicting behavioral reward sensitivity and Predicting monetary RewP. Each section contains three rows for High PCR quality, Average PCR quality, and Low PCR quality. The values in the table include coefficients (b), standard errors (SE), p-values, and 95% confidence intervals (CI). Notable trends include significant p-values for High PCR quality in both sections, indicating stronger predictive power in these conditions.
Note. Statistically significant values (p < .05) are bolded.
Exploratory analyses: other family stress-buffering
Results of multiple regressions revealed that no significant interaction between peer stress and family relationship quality (i.e., excluding parents) was found when predicting self-reported reward sensitivity, behavioral reward sensitivity, and neurophysiological measures of reward sensitivity as the outcomes (ps > .136). Detailed results are reported in the supplement.
Discussion
The present study examined whether a high-quality PCR buffers the association between peer stress exposure and measures of reward and broader PVS functioning in adolescents. We observed significant moderation for some, but not all, PVS measures, and the direction was contrary to our hypothesis. PCR quality moderated the association between peer stress exposure and both the monetary RewP and behavioral response bias but did not significantly moderate effects on self-report measures or on the social and food RewPs. Where moderation emerged, higher-quality PCRs were associated with less reward activation under conditions of elevated peer stress. These findings suggest that the buffering role of PCRs is more complex than previously assumed and may operate differently across PVS measures.
Drawing on existing work on parental stress-buffering (Conners-Burrow et al., Reference Conners-Burrow, Johnson, Whiteside-Mansell, McKelvey and Gargus2009; Davidson & Demaray, Reference Davidson and Demaray2007; Hazel et al., Reference Hazel, Oppenheimer, Technow, Young and Hankin2014; Rudolph et al., Reference Rudolph, Monti, Modi, Sze and Troop-Gordon2020; Sejourne et al., Reference Sejourne, Freeman, Sandre, Dirks, Malcolm, Ethridge and Weinberg2025; Tanigawa et al., Reference Tanigawa, Furlong, Felix and Sharkey2011; Wenz-Gross et al., Reference Wenz-Gross, Siperstein, Untch and Widaman1997), we hypothesized a weaker association between exposure to peer stress and measures of PVS function in adolescents with a higher-quality relationship with their parents. Instead, the negative association between peer stress and the monetary RewP and behavioral measures of reward learning was significant only at high levels of PCR quality. These results are partially consistent with evidence that parental support is often a less reliable stress buffer in adolescence than in childhood (Burke et al., Reference Burke, Sticca and Perren2017; Burton et al., Reference Burton, Stice and Seeley2004; Hostinar et al., Reference Hostinar, Johnson and Gunnar2015; Martínez et al., Reference Martínez, Damme, Vargas, Yang, Rompilla, Stephens, Qu, Mittal and Haase2024; Yeung Thompson & Leadbeater, Reference Yeung Thompson and Leadbeater2013). Adolescents, compared to younger children, have a stronger natural interest in interacting with peers (Forbes & Dahl, Reference Forbes and Dahl2010; Nelson et al., Reference Nelson, Leibenluft, McClure and Pine2005, Reference Nelson, Jarcho and Guyer2016) and spend less time overall with their parents and more time with peers (Lam et al., Reference Lam, McHale and Crouter2014; Larson & Richards, Reference Larson and Richards1991; Larson et al., Reference Larson, Moneta, Richards, Holmbeck and Duckett1996). Additionally, social environments outside of family, including support from friends, classmates, and teachers, are critical for an adolescent’s psychosocial development (Bronfenbrenner, Reference Bronfenbrenner2005; Chu et al., Reference Chu, Saucier and Hafner2010; Hombrados-Mendieta et al., Reference Hombrados-Mendieta, Gomez-Jacinto, Dominguez-Fuentes, Garcia-Leiva and Castro-Travé2012). During this period of social reorientation, support from parents may play a different role in an adolescent’s social support network than we anticipated, and other sources (e.g., close friends or romantic partners; Cooley et al., Reference Cooley, Fite, Rubens and Tunno2015; Cuadros & Berger, Reference Cuadros and Berger2016) may more effectively buffer against the effects of peer stress. This moderation pattern may also help explain some inconsistent findings in prior work examining associations between peer stress and reward functioning, such that studies that did not account for PCR quality may have averaged across youths at high and low levels of PCR quality, potentially obscuring the effects.
Additionally, prior work has also found evidence of a “reverse buffering” effect of close parental relationships on the association between peer stress exposure and an array of PVS-relevant outcomes. For instance, in a meta-analysis examining social support and depression in youth, Rueger and colleagues (Reference Rueger, Malecki, Pyun, Aycock and Coyle2016) found that under certain stressful conditions (e.g., shared stressors between youth and source of support), youth may not be able to benefit fully from social support. Consistent with this, Chen and Kühner (Reference Chen and Kühner2025) found that family support exacerbated the association between pandemic stress exposure and negative affect and unhappiness among children and adolescents. Furthermore, Desjardins and Leadbeater (Reference Desjardins and Leadbeater2011) found that peer victimization longitudinally predicted increased depressive symptoms only among adolescents with high maternal emotional support. Interestingly, they also found that paternal support buffered the association, again pointing to the complex role social support from different figures may play in buffering against the effects of stress exposure.
Multiple mechanisms have been proposed to explain this reverse buffering effect (Rueger et al., Reference Rueger, Malecki, Pyun, Aycock and Coyle2016), including two related constructs, co-rumination and enmeshment (Ames-Sikora et al., Reference Ames-Sikora, Donohue and Tully2017; Waller & Rose, Reference Waller and Rose2010). Co-rumination refers to the excessive discussion of problems, especially focusing on rehashing negative events and dwelling on negative affect (Rose, Reference Rose2002, Reference Rose2021), and has been positively associated with PCR quality (Ames-Sikora et al., Reference Ames-Sikora, Donohue and Tully2017; Bastin et al., Reference Bastin, Mezulis, Aldrich, Bosmans, Nelis, Raes and Bijttebier2021; Waller & Rose, Reference Waller and Rose2010). However, it is also linked to enmeshment in PCRs (Waller & Rose, Reference Waller and Rose2010), which can limit children’s autonomy and independence, making them more susceptible to the effects of stress (Kivisto et al., Reference Kivisto, Welsh, Darling and Culpepper2015; Marusak et al., Reference Marusak, Thomason, Sala-Hamrick, Crespo and Rabinak2018). Further, co-rumination with parents has been found to predict internalizing symptoms in adolescents in both cross-sectional (Miller-Slough & Dunsmore, Reference Miller-Slough and Dunsmore2021; Waller & Rose, Reference Waller and Rose2010) and longitudinal (Ioffe et al., Reference Ioffe, Pittman, Kochanova and Pabis2020) research designs. In the context of high peer stress, adolescents with high-quality, and highly enmeshed, PCRs may engage in more co-rumination that inadvertently amplifies the adverse effects of stress exposure by prolonging the focus on peer-related problems. Enmeshment that limits autonomy may also contribute to PVS dysfunction, given that reward functioning has been associated with autonomy-related behaviors, such as environmental exploration (Freeman et al., Reference Freeman, Dirks and Weinberg2020; Van Leijenhorst et al., Reference Van Leijenhorst, Moor, Op de Macks, Rombouts, Westenberg and Crone2010). However, there is also evidence that high-quality PCR is often characterized by autonomy support, rather than autonomy constraint (Jameel et al., Reference Jameel, Ma, Li, Hussain, Asif and Wang2024; Jiao, Reference Jiao2020), and our study did not assess these aspects of the relationship. Future studies should further explore this question by including measures of co-rumination, enmeshment, and autonomy support during periods of stress exposure to better understand when, and for whom, a high-quality PCR effectively buffers against peer stress.
Another possible explanation for our findings is that adolescents with the combination of elevated peer stress and blunted reward activation (e.g., a smaller RewP) elicit greater parental involvement. For example, youth with blunted reward activation may exhibit more anhedonic and depressive symptoms (Baskin-Sommers & Foti, Reference Baskin-Sommers and Foti2015; Ellis et al., Reference Ellis, Salgari, Miklowitz and Loo2019; Epstein et al., Reference Epstein, Pan, Kocsis, Yang, Butler, Chusid, Hochberg, Murrough, Strohmayer, Stern and Silbersweig2006; Halahakoon et al., Reference Halahakoon, Kieslich, O’Driscoll, Nair, Lewis and Roiser2020; Thompson et al., Reference Thompson, Santopetro, Brush, Foti and Hajcak2023), especially when they are chronically exposed to stressors (Dennison et al., Reference Dennison, Sheridan, Busso, Jenness, Peverill, Rosen and McLaughlin2016; Goldstein et al., Reference Goldstein, Kessel, Kujawa, Finsaas, Davila, Hajcak and Klein2020). Additionally, research suggests that blunted reward functioning may itself generate future stress exposure through a stress generation pathway (Mackin et al., Reference Mackin, Kotov, Perlman, Nelson, Goldstein, Hajcak and Klein2019), such that adolescents with blunted reward functioning may be prone to experience more interpersonal stressors over time, and in turn experience more depressive symptoms. Through both pathways, parents may increase their involvement in response to their child’s distress (Van der Giessen et al., Reference Van der Giessen, Branje and Meeus2014; Werner et al., Reference Werner, der Graaff, Meeus and Branje2016). Future longitudinal studies are needed to explore the directionality of these associations.
Finally, the reverse buffering effects observed here might also reflect the effects of a “healthy context paradox” (Salmivalli, Reference Salmivalli2018; Yun & Juvonen, Reference Yun and Juvonen2020), which refers to the phenomenon where the effect of victimization is worse in healthier contexts. Although this concept has been primarily examined in classroom settings, it is possible that adolescents who grow up in high-quality PCRs may experience peer stress as more salient and distressing. This interpretation remains speculative and future research is needed to directly test this possibility.
Outside of the parental relationship, our results also demonstrated that the quality of the relationship with other family members (e.g., siblings, grandparents, other extended family members) did not have a significant buffering role, which is contrary to findings suggesting an incremental value of family support (Levetan & Wild, Reference Levetan and Wild2016; Lila et al., Reference Lila, Aken, Musitu and Buelga2007; Van Heerden & Wild, Reference Van Heerden and Wild2018). Although we hypothesized that adolescents would benefit from support from their broader family network, it is possible that adolescents are overall less likely to seek support from family members other than their parents regarding peer-related stressors (Nickerson & Nagle, Reference Nickerson and Nagle2005). Therefore, this form of support may be less relevant or effective in buffering the effects of peer stress on reward processing during this developmental period. Moreover, our measure of family relationship aggregates multiple types of relationships, including siblings, grandparents, other extended relatives, and the relationship between the parents. While some studies suggest that siblings and grandparents can play a protective role in the face of peer stress (Attar-Schwartz & Buchana, Reference Attar-Schwartz and Buchana2019; Fry et al., Reference Fry, Telzer and Rogers2021; Lockwood et al., Reference Lockwood, Gaylord, Kitzmann and Cohen2002), our design did not allow us to isolate whether a high-quality family relationship reflects sibling support, grandparent support, support from other extended family members, or all of them. As such, future research could investigate the buffering role of each type of relationship separately.
In addition to reverse stress-buffering effects, the current findings also suggest differential effects for different PVS measures across units of analysis, including a self-report questionnaire of PVS functioning, a behavioral monetary reward learning task, and RewPs elicited from monetary, food, and social rewards. In the current study, those measures were at most only modestly correlated with one another, which is consistent with the extant literature indicating that different measures of PVS are often not strongly associated (De Los Reyes et al., Reference De Los Reyes, Drabick, Makol and Jakubovic2020; Park et al., Reference Park, Banica and Weinberg2023; Patrick & Hajcak, Reference Patrick and Hajcak2016). This lack of strong convergence suggests that each unit of analysis is tapping a slightly different aspect of the construct. For instance, RewP is contingent on rewarding feedback and captures unobservable, internal processes related to rewarding experiences (De Los Reyes et al., Reference De Los Reyes, Drabick, Makol and Jakubovic2020). In contrast, behavioral indices of reward sensitivity reflect more observable, external processes, such as learning in response to rewards (De Los Reyes et al., Reference De Los Reyes, Drabick, Makol and Jakubovic2020). Furthermore, the modest correlations among the RewPs may, at least in part, reflect some task-specific influences, such as task design (Lawhead et al., Reference Lawhead, Kujawa, Klein and Nelson2024), as has been observed in studies of other ERP components (Riesel et al., Reference Riesel, Weinberg, Endrass, Meyer and Hajcak2013). Although prior work has found associations between interpersonal stress exposure and neural responses to both monetary (Ethridge et al., Reference Ethridge, Sandre, Dirks and Weinberg2018) and social rewards (Panier et al., Reference Panier, Ethridge, Farrell-Reeves, Punturieri, Kujawa, Dirks and Weinberg2022; Rappaport et al., Reference Rappaport, Hennefield, Kujawa, Arfer, Kelly, Kappenman, Luby and Barch2019; Sejourne et al., Reference Sejourne, Freeman, Sandre, Dirks, Malcolm, Ethridge and Weinberg2025) across development (Pegg & Kujawa, Reference Pegg and Kujawa2024), we only observed significant effects of peer stress exposure on the monetary RewP. The reasons for this discrepancy are unclear, but may reflect methodological differences across studies, including variability in the type and chronicity of peer stress assessed and the developmental stage of participants, which warrant future research. These distinct but overlapping aspects of PVS likely combine to influence functioning, emphasizing the importance of a multi-method approach to fully capture the construct.
Limitations of the present study suggest directions for future research. First, high-quality PCRs may differentially moderate the association between peer stress and PVS functioning across stages of adolescence and for adolescents of different sex or gender. Doom and colleagues (Reference Doom, Hostinar, VanZomeren-Dohm and Gunnar2015) found that the stress-buffering role of parental support diminishes with adolescent pubertal development, partially due to hormonal changes during puberty. Additionally, a longitudinal study found that maternal support buffered against the impact of victimization only for early adolescent girls, whereas father support showed a significant buffering effect only among older adolescent boys (Yeung Thompson & Leadbeater, Reference Yeung Thompson and Leadbeater2013). Future research with a larger sample size should explore how PCR interacts with peer stress across developmental stages, including transitions from early to late adolescence, as well as the impact of sex and gender differences. Second, the current sample is predominantly White and middle class, which limits the generalizability of the findings. Cultural norms may influence parenting practices and their impact on youth functioning (Lansford, Reference Lansford2022; Louie et al., Reference Louie, Oh and Lau2013; Mousavi et al., Reference Mousavi, Low and Hashim2016). Future research should therefore explore a more diverse sample.
In summary, the current study found that among adolescents experiencing higher peer stress, those with a higher-quality relationship with parents exhibited reduced neurophysiological and behavioral reward sensitivity, contrary to the expected buffering role of high-quality PCRs. These results suggest important directions for future research. Additionally, we found differential associations for different measures of PVS functioning, suggesting the importance of a multi-method approach for understanding reward processing in adolescence. This study thereby contributes to the literature on adolescent development by further exploring the interaction of peer stress, PCR, and reward processing, which can ultimately inform prevention and intervention strategies to promote adaptive family and peer relationships.
Supplementary material
The supplementary material for this article can be found at https://doi.org/10.1017/S0954579426101862.
Data availability statement
The data and R code associated with this manuscript as well as the code and stimuli for the EEG tasks can be found at: https://osf.io/h6p5d/.
Acknowledgments
N/A.
Funding statement
This work was supported by a grant to A.W., from Canadian Institutes of Health Research (grant number: 427055).
Competing interests
The authors declare none.
Pre-registration statement
This work was not pre-registered.



 Open access

