1. Introduction
The ice masses of the Svalbard archipelago, in the Norwegian Arctic, are thought to be contributing a positive increment to sea-level rise. Measurements of winter accumulation and summer melting at several valley glaciers on the island of Spitsbergen have shown a net loss almost every year since observations began in 1950 (Hagen and Liestøl, 1990). Much mass is also lost through iceberg production, from the numerous tidewater glaciers making up over 1000 km of Svalbard’s coastline. This increment to the total mass balance is very poorly constrained. A suitable method is needed of measuring glacial near-terminus velocity. Used in conjunction with existing ice thickness information (Dowdeswell, 1986), such a data set would allow calculation of the archipelago-wide mass loss associated with calving. In addition, a means of efficiently monitoring changing velocity fields would facilitate study of Svalbard’s variable dynamic regimes. These include fast-moving ice streams whose time-variant activity is of particular significance to the stability of their parent ice cap (Dowdeswell and Collin, 1990), and numerous glaciers in various stages of build-up to surge activity (Dowdeswell and others, 1991). Nordaustlandet, in eastern Svalbard, contains ice caps covering an area of 11 150 km2. This is one of the largest glaciated areas outside of Greenland and Antarctica. If the complete topography and velocity fields of the caps were to be characterised, this data would provide input for glaciological modelling studies in the region.
The new technique of satellite radar interferometry (SRI) may provide a means of extracting accurate, high-resolution height and velocity information in Svalbard. Large quantities of 3d repeat synthetic aperture radar (SAR) data were acquired over the archipelago during ERS-1’s First and Second Ice Phases in 1992 and 1994, and the 1995–96 tandem ERS-1/ERS-2 mission is similarly set to obtain a significant number of 1 d repeat scenes. The region is well known in glaciological terms, providing useful validation for interferometrically derived data sets.
The use of SAR interferometry for topographic mapping was first demonstrated by Zebker and Goldstein (1986). A good description of the theory, including a treatment of errors, may be found in Rodriguez and Martin (1992). The processing steps necessary to transform interferometric phase difference into useful topographic information are detailed in Zebker and others (1994). Sources of incoherence between repeat-pass SAR images are discussed by Zebker and Villasenor (1992).
Over the past 3 years, the SRI technique has been extended to allow synoptic visualisations of surface displacement. Following Massonnet and others’ (1993) visualisation of the Landers earthquake displacement, there has been a rapid application of the technique to glacier flow. Goldstein and others (1993) imaged the line- of-site velocity field of the Rutford Ice Stream, and Joughin and others (1995) produced the first detailed regional view of ice motion near Greenland’s western margin. Kwok and Fahnestock (1996) described how the separation of mixed topographic and displacement components of interferometric phase may be achieved through the differencing of successive interferograms.
In this paper, we apply SRI to investigate the topography and dynamics of Austfonna, an ice cap on Nordaustlandet. Our initial investigations had three purposes: to determine whether the coherence and velocity characteristics of the region permitted interferometric study; to produce a digital elevation model (DEM) and determine the accuracy of the derived elevations; and to assess the possibility of investigating time-variant flow of the more dynamic ice bodies using differential interferometry. In section 2 we
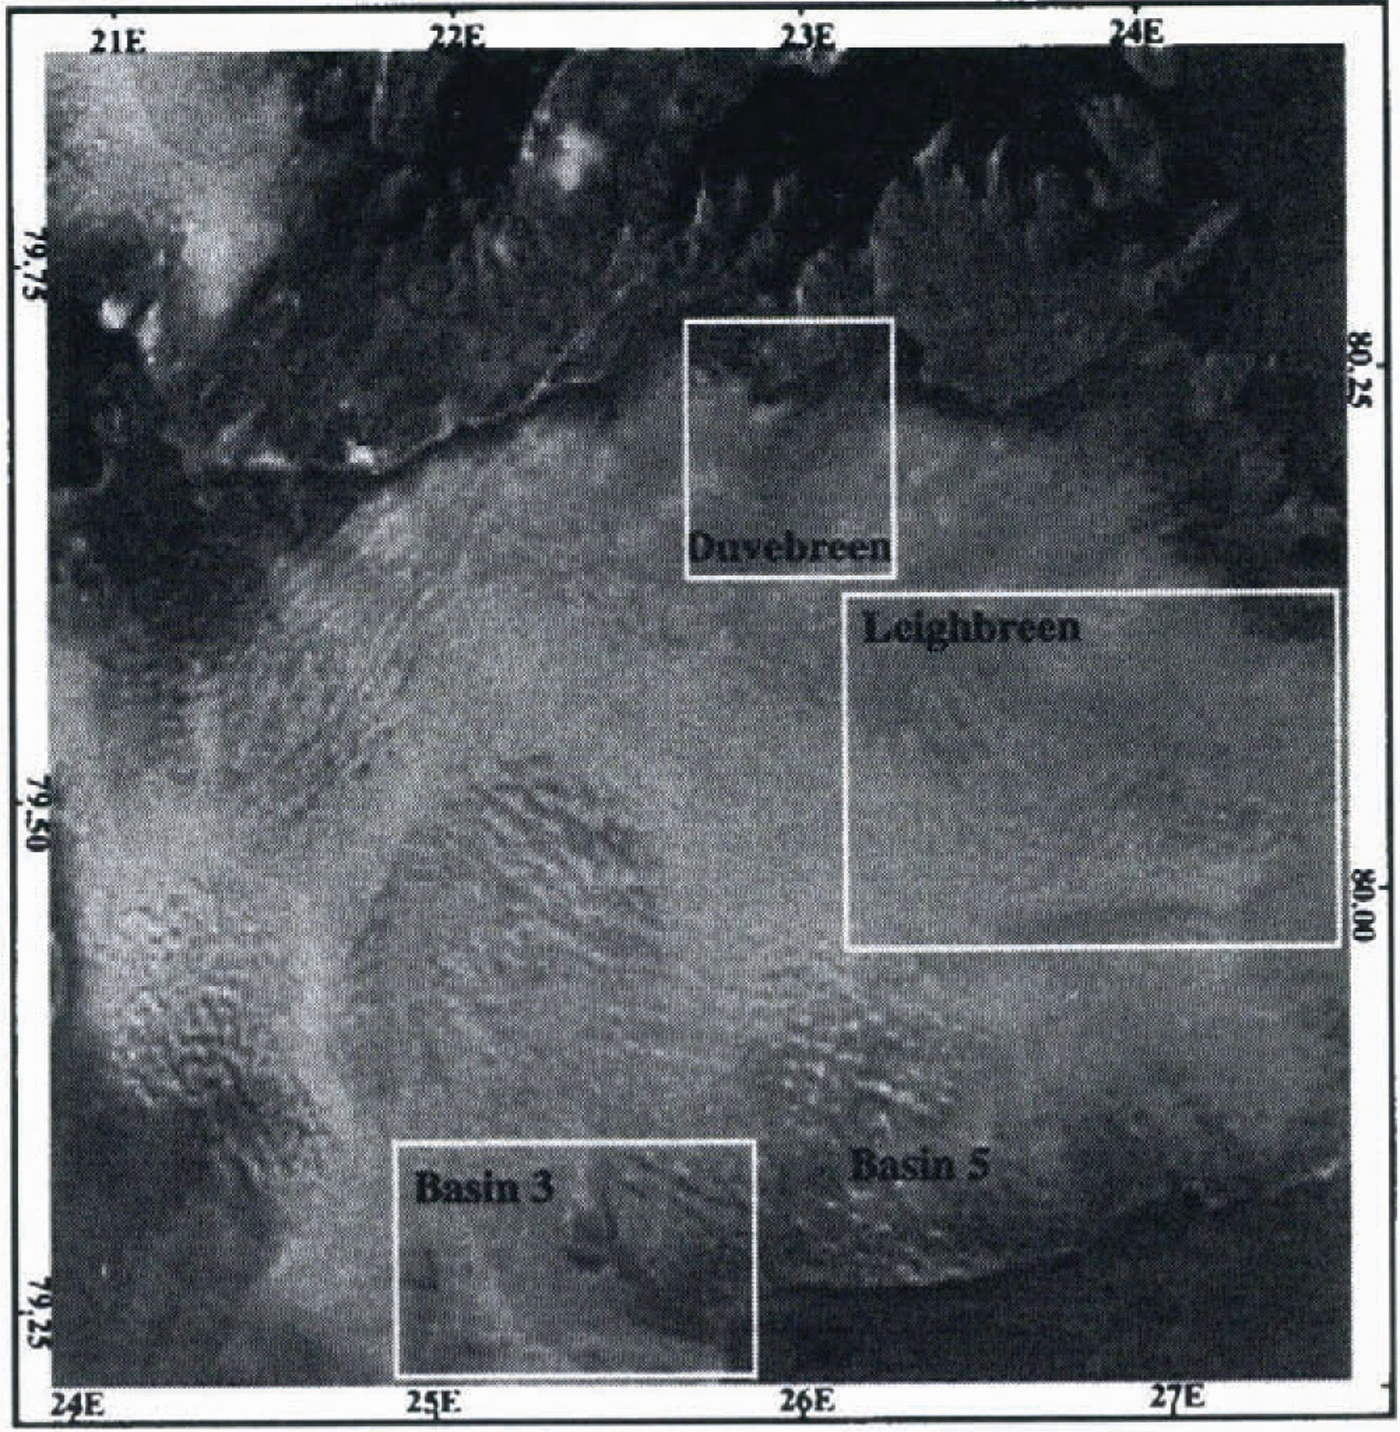
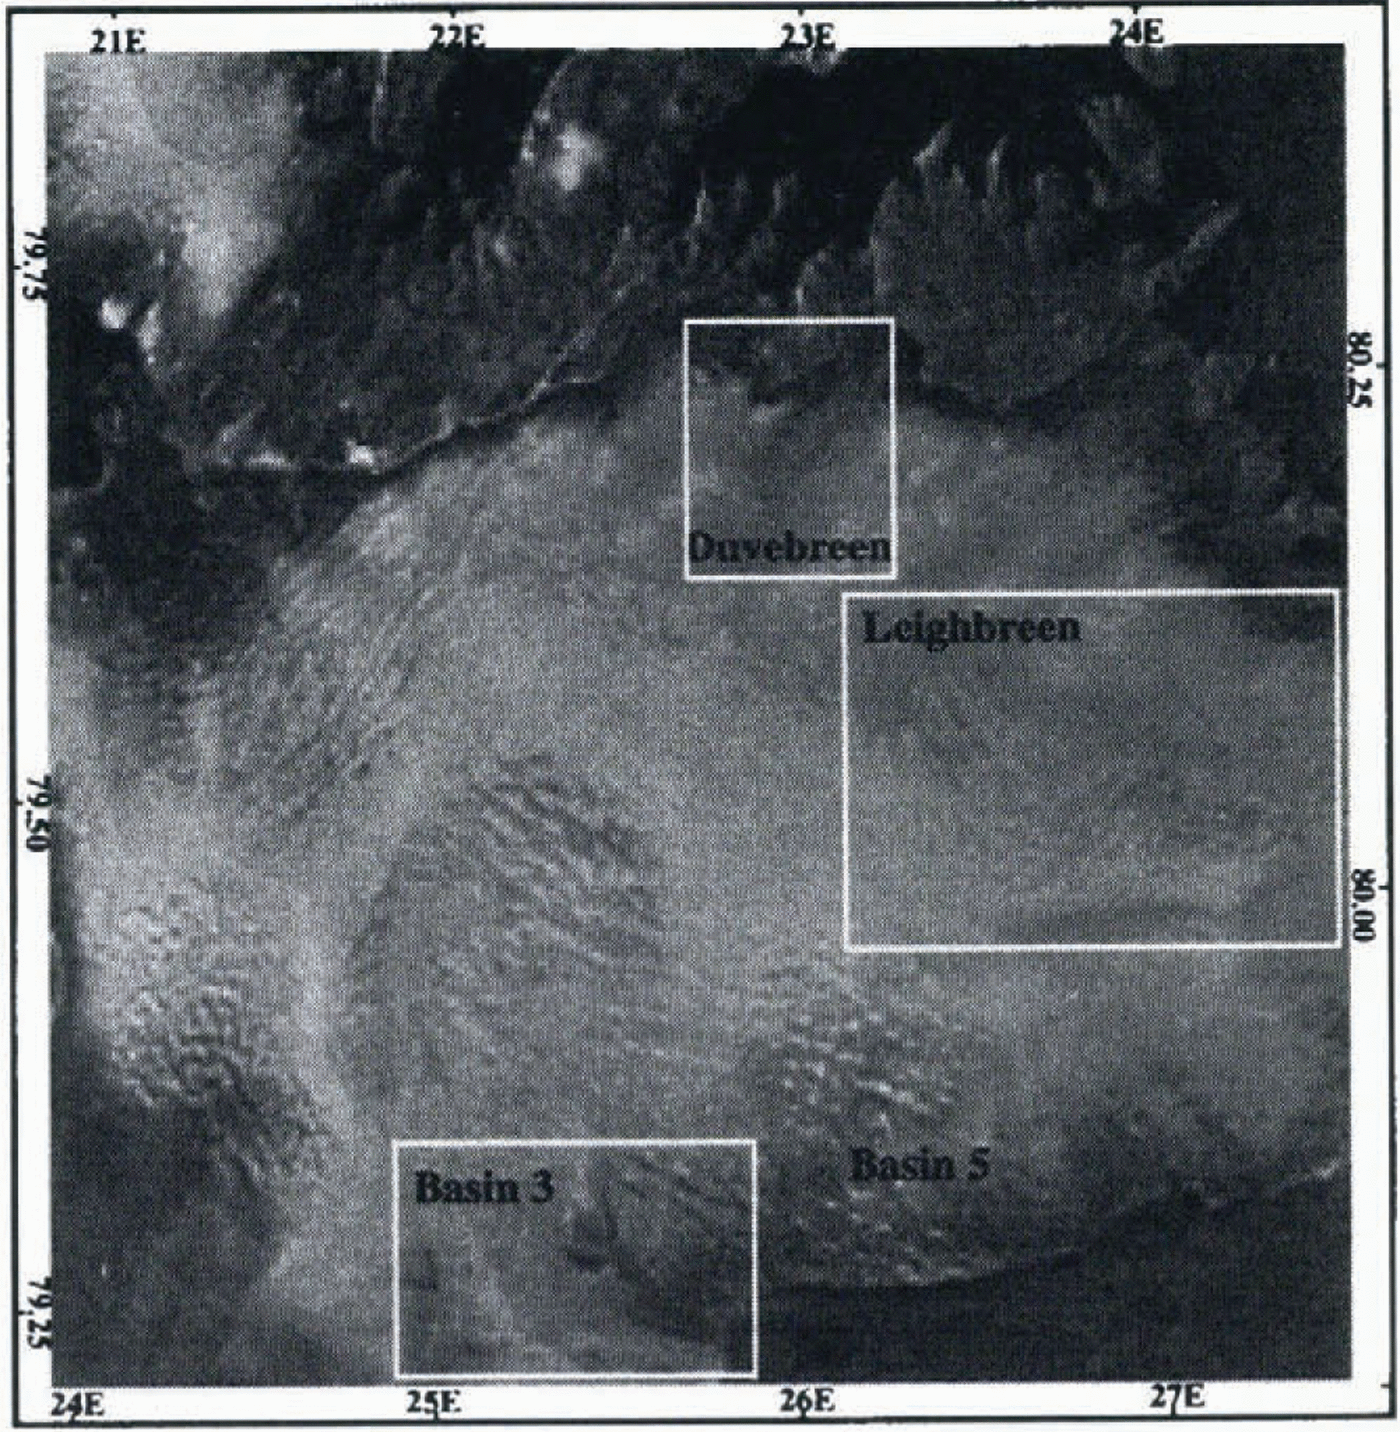
SAR amplitude image of Austfonna. Orbit 3077, frame 1629, dale 16 February 1992. Image size 100 km x 100 km. The ice cap terminates at an ice cliff bordering marine waters to the south, and at bedrock to the north. The positions of some of Austfonna’s drainage basins are marked. These will be referred to later in the text.
describe the selection of a suitable sequence of SAR images for use in an interferometric investigation of Austfonna. In section 3 we present single-pair interferograms containing phase components due to both topography and ice velocity. Section 4 describes how we isolated the topographic phase.
Section 5 discusses the computation of a DEM and its accuracy relative to an external data set. In section 6 we present velocity visualisations of three of Austfonna’s drainage basins. We draw our conclusions in section 7.
2 Sar Data Selection
Our investigations focused on frame 1629 of ERS-l’s 3d repeat track 13. This 100 km x 100 km image covers virtually the whole of Austfonna. We obtained 16 First Ice Phase repeats of this scene, dated between 1 February and 29 March 1992. The images were in single-look complex form, having been processed at the German Processing and Archiving Facility (DPAF). Figure 1 shows the SAR amplitude image from 16 February 1992.
Two pairs of coherent repeat-pass SAR scenes, forming two interferograms, are needed to separate interferometric phase difference into its topographic and displacement components (Kwok and Fahnestock, 1996). The coherence of each pair was investigated, in order to identify scenes suitable for full interferometric processing. Small portions of each pair were approximately registered, to the nearest pixel, by first manually matching features, and then iterating to maximise correlation. Interferograms and coherence images were formed. We found that image pairs acquired between 13 and 19 February achieved high coherence across the whole scene and hence yielded high-quality fringes. Most of the other pairs did not match this quality, displaying low coherence over part or all of the scene. Local temperature data, obtained from the Norwegian Meteorological Institute, indicate that melting could not be the cause of this coherence loss. It is therefore assumed that precipitation, in the form of snow, has destroyed the correlation.
Three coherent images, forming two mutually coherent 3 d repeat pairs, were selected for further study. The images were acquired on 13, 16 and 19 February 1992, from orbits 3034, 3077 and 3120, respectively. The scenes will henceforth be referred to by the numbers 1–3. At scene centre, the baseline for image pair 1–2 is 61 m, and for pair 2–3 it is 186 m.
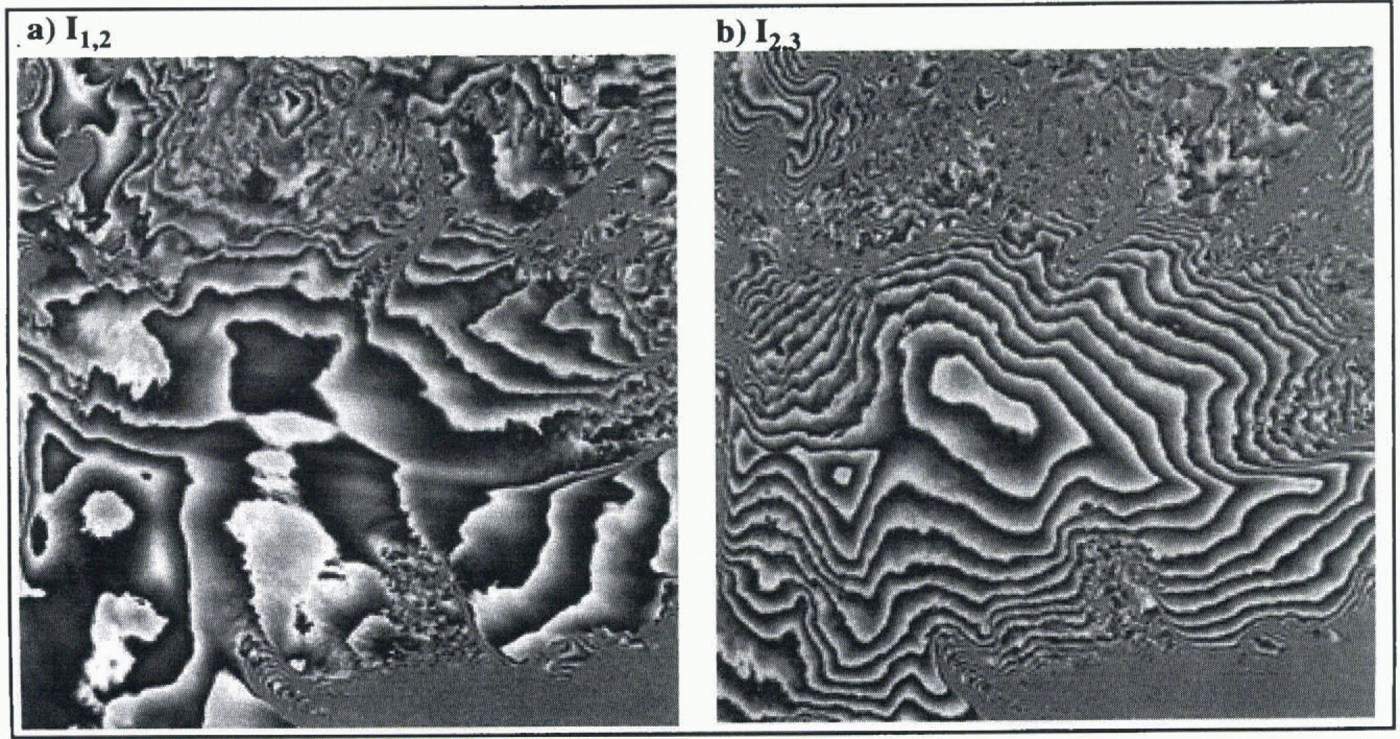
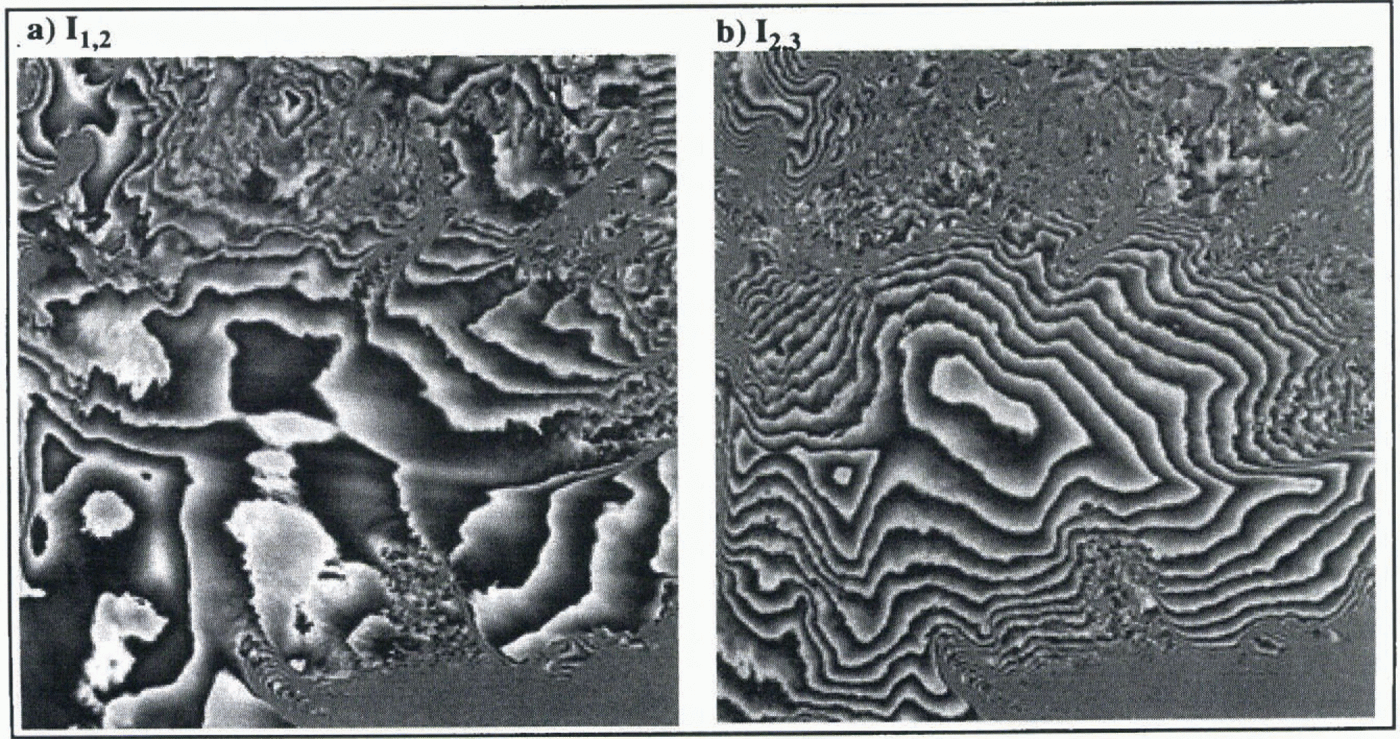
Mixed motion/topography interferograms formed from (a) SAR images 1 and 2 (I1, 2), and (b) SAR images 2 and 3 (I2, 3). One fringe cycle from black to white represents a phase change from 0 to 2π. The size of each interferogram is 100 km x 100 km. The longer baseline of I2, 3 results in its greater sensitivity to topography relative to I1, 2,. Enhanced flow regions are apparent at the three drainage basins delineated in Figure 1. The complexity in Basin 5 corresponds to an area of surface roughness and its corresponding velocity field. Fringes occur over regions of water where fast ice is present.
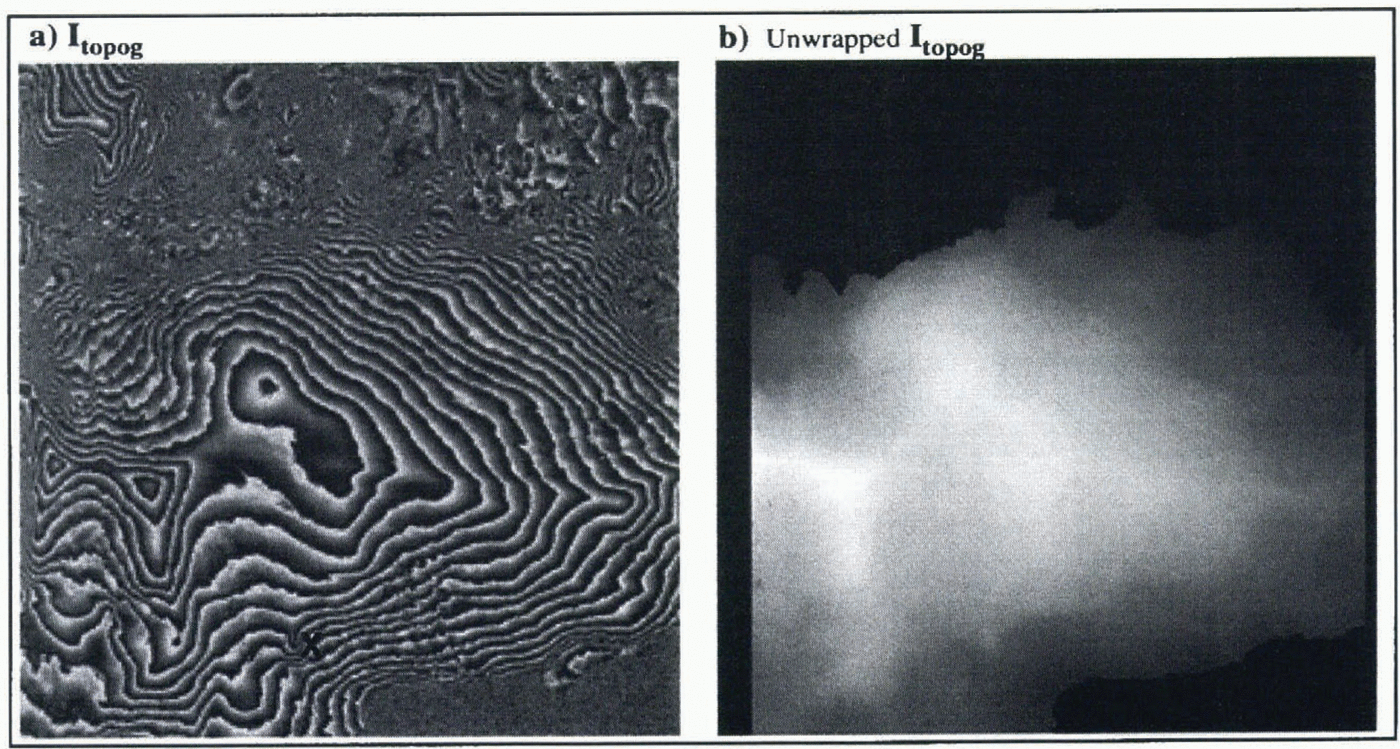
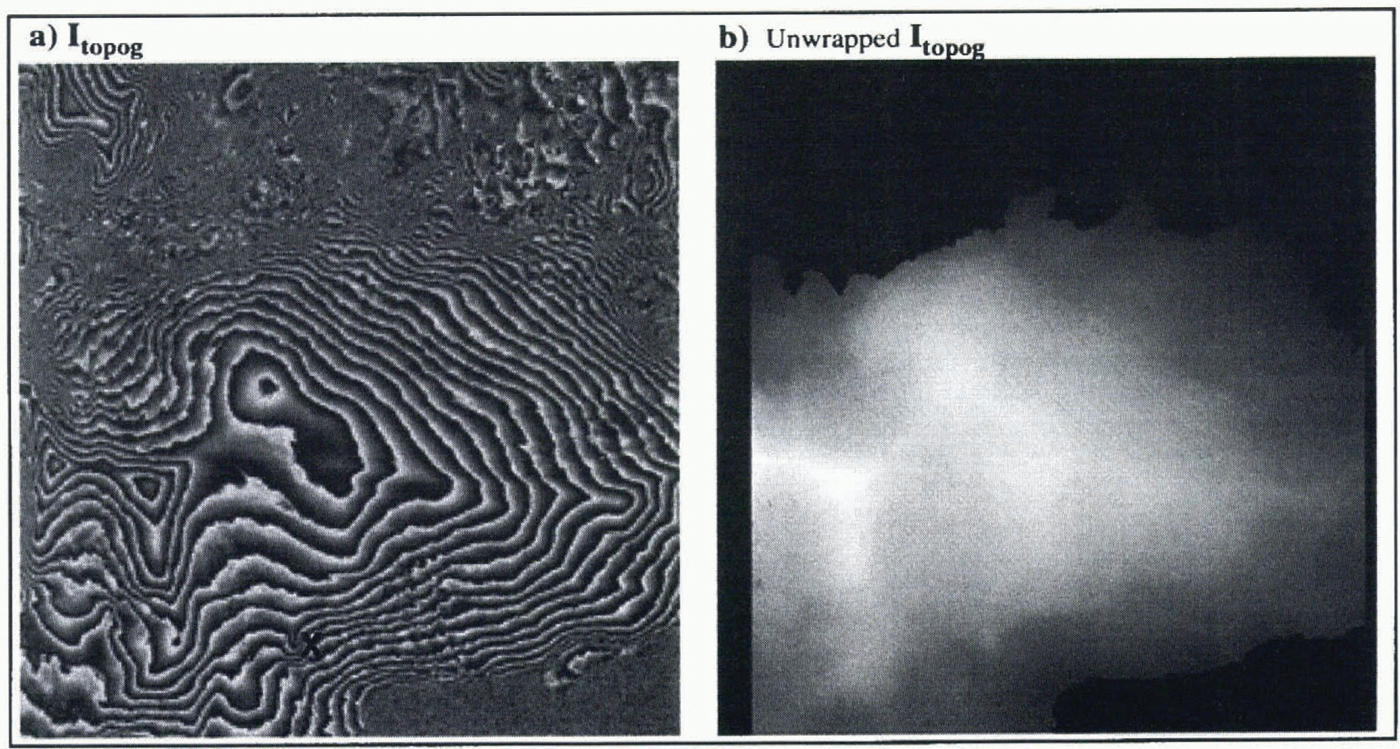
(a) Topographic interferogram formed by differencing I1, 2 I2, 3. One fringe cycle from black to white represents a phase change from 0 to 2π. The motion effects apparent in Figure 2 have been removed. The feature marked X is a small ice dome. (b) The unwrapped version of Itopog. Black regions were masked out of the unwrapping algorithm. The size of each image is 100 km x 100 km.
3 Single-Pair Interferograms
The three SAR images were mutually registered to sub-pixel accuracy using the technique of Gabriel and Goldstein (1988). For each pair the complex multiple was computed and non-topographic range-dependent ramps were removed. Baselines were estimated using Precise Orbit data (ESA, 1990), and the coordinate system used was that of a spherical Earth of radius equal to the local geodetic radius. To reduce speckle, at the expense of resolution, averaging was performed over two samples in range and ten samples in azimuth (Zebker and others, 1994). This process is often referred to as “multi-looking”. The resultant sample size was then 39.61 m in azimuth and 15.81 m in slant range (equivalent to approximately 40 m in ground range, though this varies with topography). The phase and correlation of each complex interferogram was calculated. Figure 2 shows the interferometric phase formed from each pair. These phase-difference images contain components due to both topography and flow. The topographic component is less dominant in I 1, 2 because of its relatively short baseline.
4 Topographic-Phase Isolation
The topographic phase was isolated by subtracting I 2, 3 from I 1, 2 (Kwok and Fahnestock, 1996), under the assumption that the velocity field remained constant over the relevant 6 d period. The subtraction was performed by multiplying the complex interferograms before the multi-look averaging procedure to optimise speckle reduction. figure 3a shows the resulting topography-only interferogram, I topog. Its equivalent baseline is the vectorial difference between the baselines of I 1, 2 and I 2, 3, which is 245 m at image centre. The greater length of this baseline relative to that of I 2, 3 accounts for the tighter fringe spacing of I topog
The modulo-2π phase of I topog was unwrapped using the algorithm of Joughin (1995). figure 3b shows the unwrapped phase. Areas of complicated topography or sea water were masked out of the procedure, and these regions are shown in black.
5 Dem Production
To produce accurate height information, the interferometric baseline parameters have to be known very accurately. Currently the best orbit estimates for ERS-1 are accurate to about 30 cm (ESA, 1990). This uncertainty can lead to systematic height errors of the order of 1 km (Zebker and others, 1994), and smaller, spatially varying height errors. It is therefore necessary to use tie-points of ground-truth heights to constrain the baseline parameters. Provided enough tie-points, of sufficient accuracy, are used, it is possible to reduce this component of the height error to less than 5 m (Zebker and others, 1994), equivalent to millimetre-order accuracy in baseline length. In the absence of tie-point errors, only four points would be needed to solve for the two baseline components and their gradients. However, where there are random errors in the tie-points, the result will be optimised by use of a greater number.
The tie-points used in this work are from an airborne radio-echo sounding (RES) mission performed jointly by the Scott Polar Research Institute (SPRI), Cambridge, and Norsk Polarinstitutt, Oslo, in 1983 (Dowdeswell and others, 1986). The mean of 251 RES crossing-point errors on Austfonna fonna was 11m, with a standard deviation of 9.3 m. These errors were due to poor navigational accuracy over much of the ice cap, and are larger where slopes are steep. The lowest errors occurred where two or more transponder position fixes could be made. Here position accuracies were calculated as ± 30 m (Dowdeswell and others, 1986), as distinct from ± 250 m elsewhere on the cap. Of over 17 000 tie-points, we selected 2500 from within the area where crossover errors were lowest (Dowdeswell and others, 1986). The tie-points were given pixel locations within the image using the best available knowledge of the orbit. A subset of 250 points, chosen by extracting every tenth point in the time series, was used in the baseline estimation procedure, solving for the parameters in a least-squares sense.
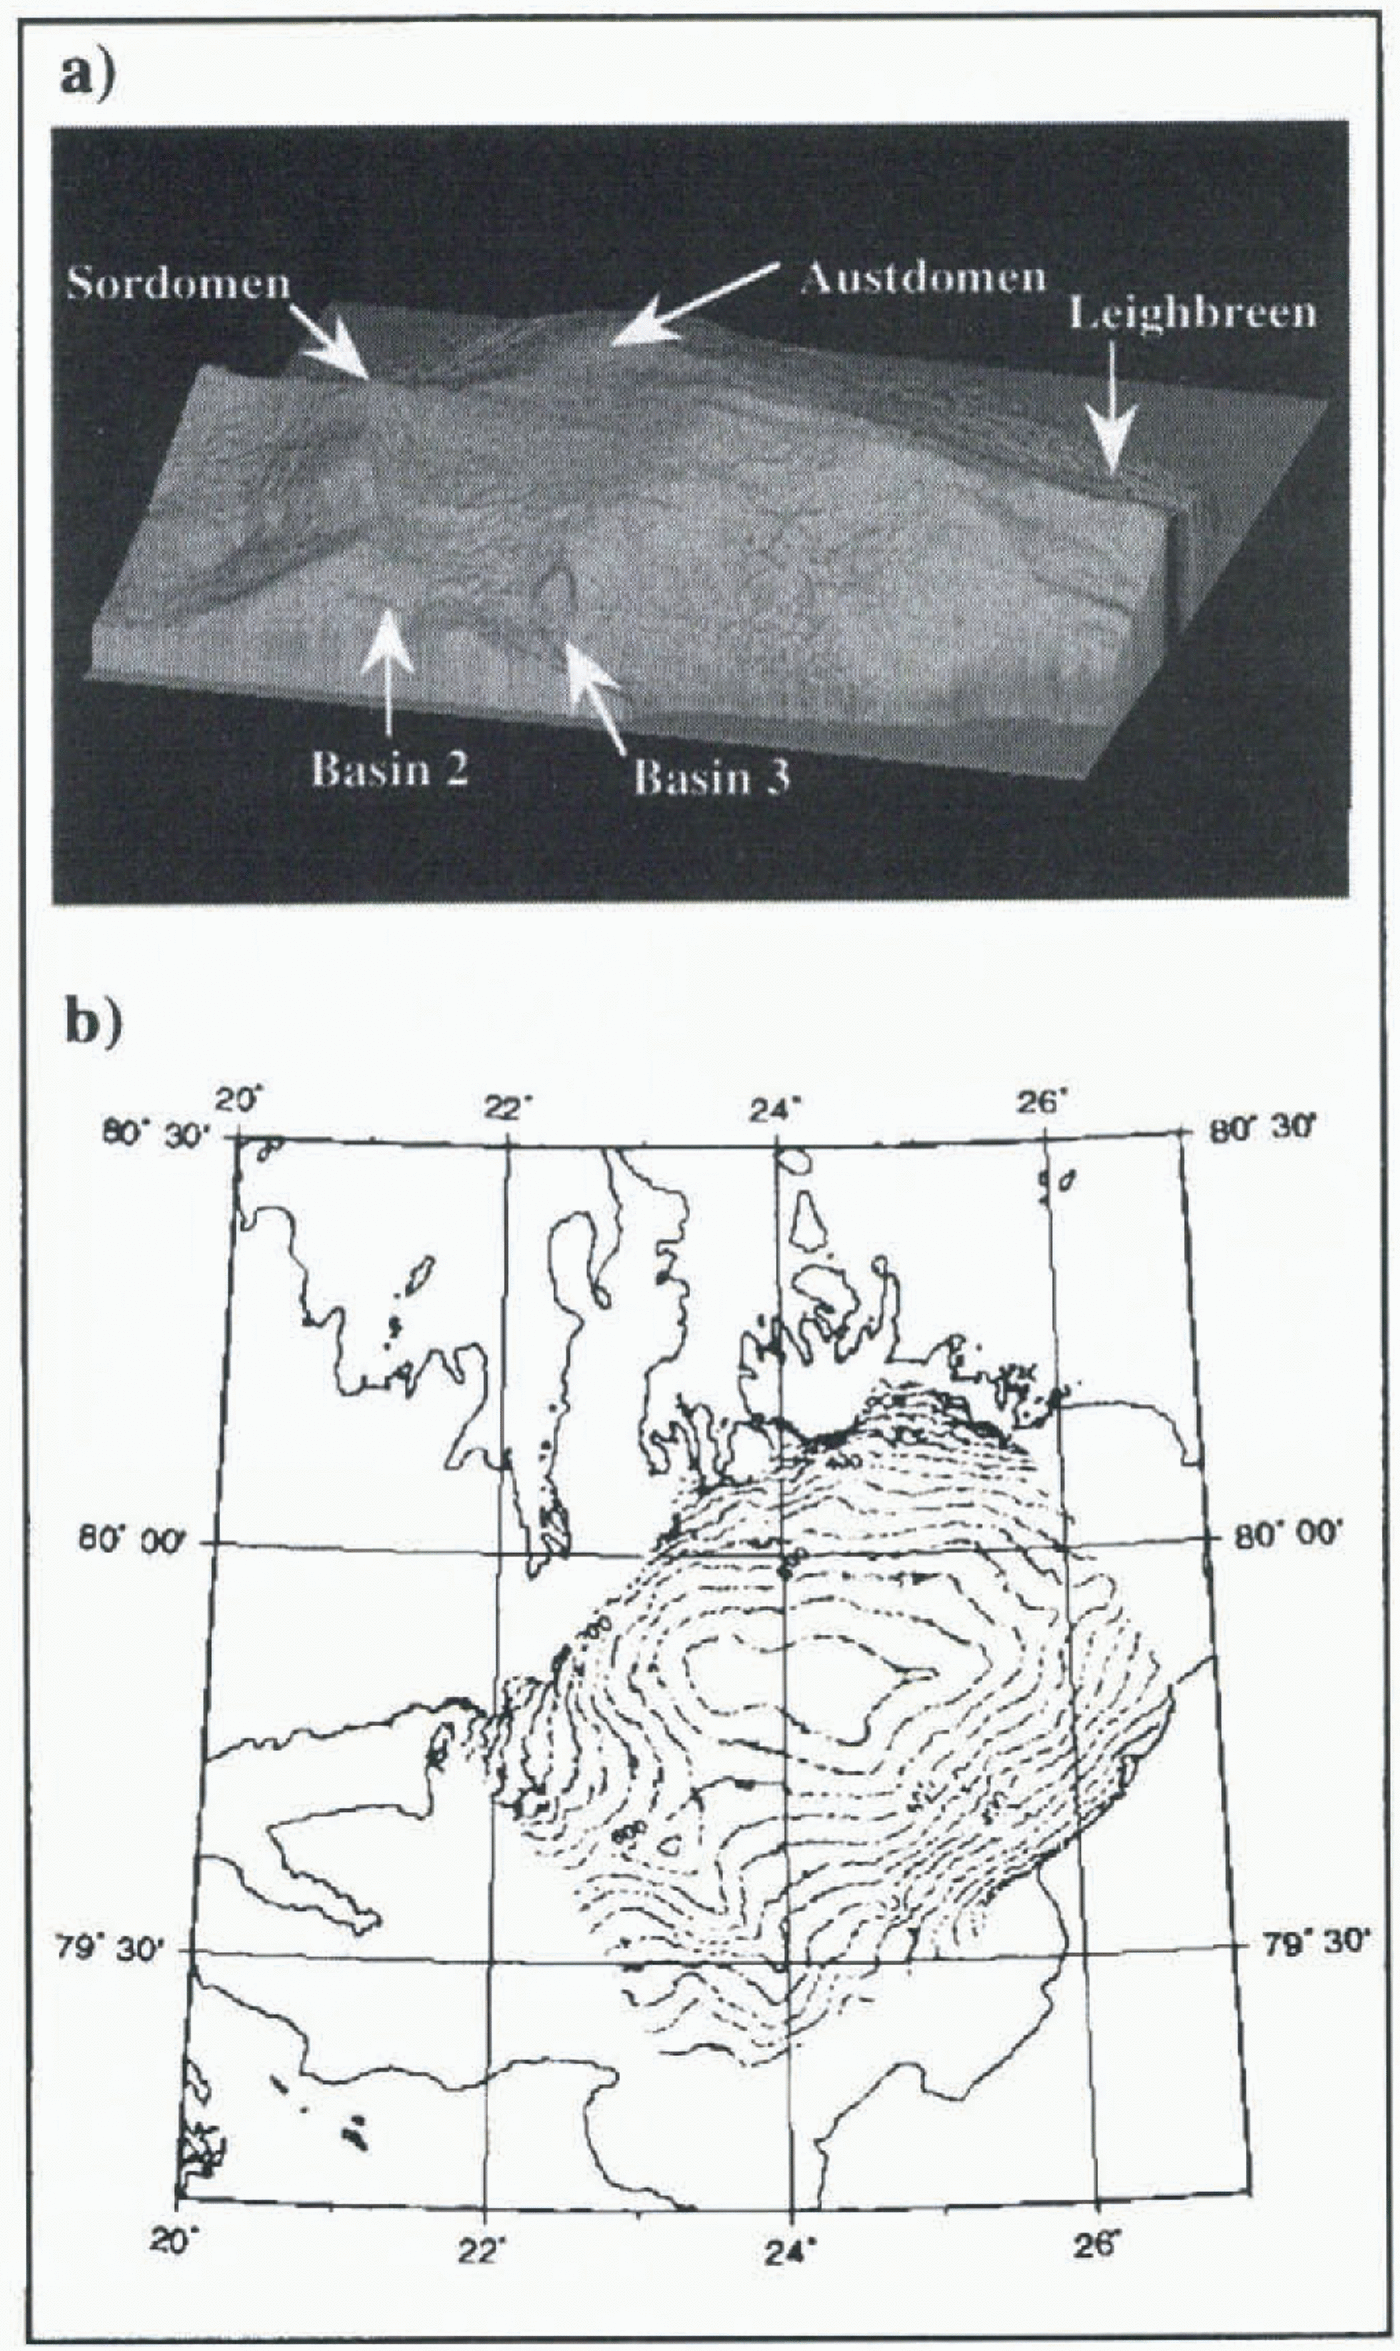
(a) Shaded isometric plot of interferometrically derived DEM of Austfonna. The positions of the main ice domes and drainage basins are marked. The edges correspond to the edges of the unwrapped phase image rather than the edges of the ice cap. (b) Contour plot with 50 m interval.
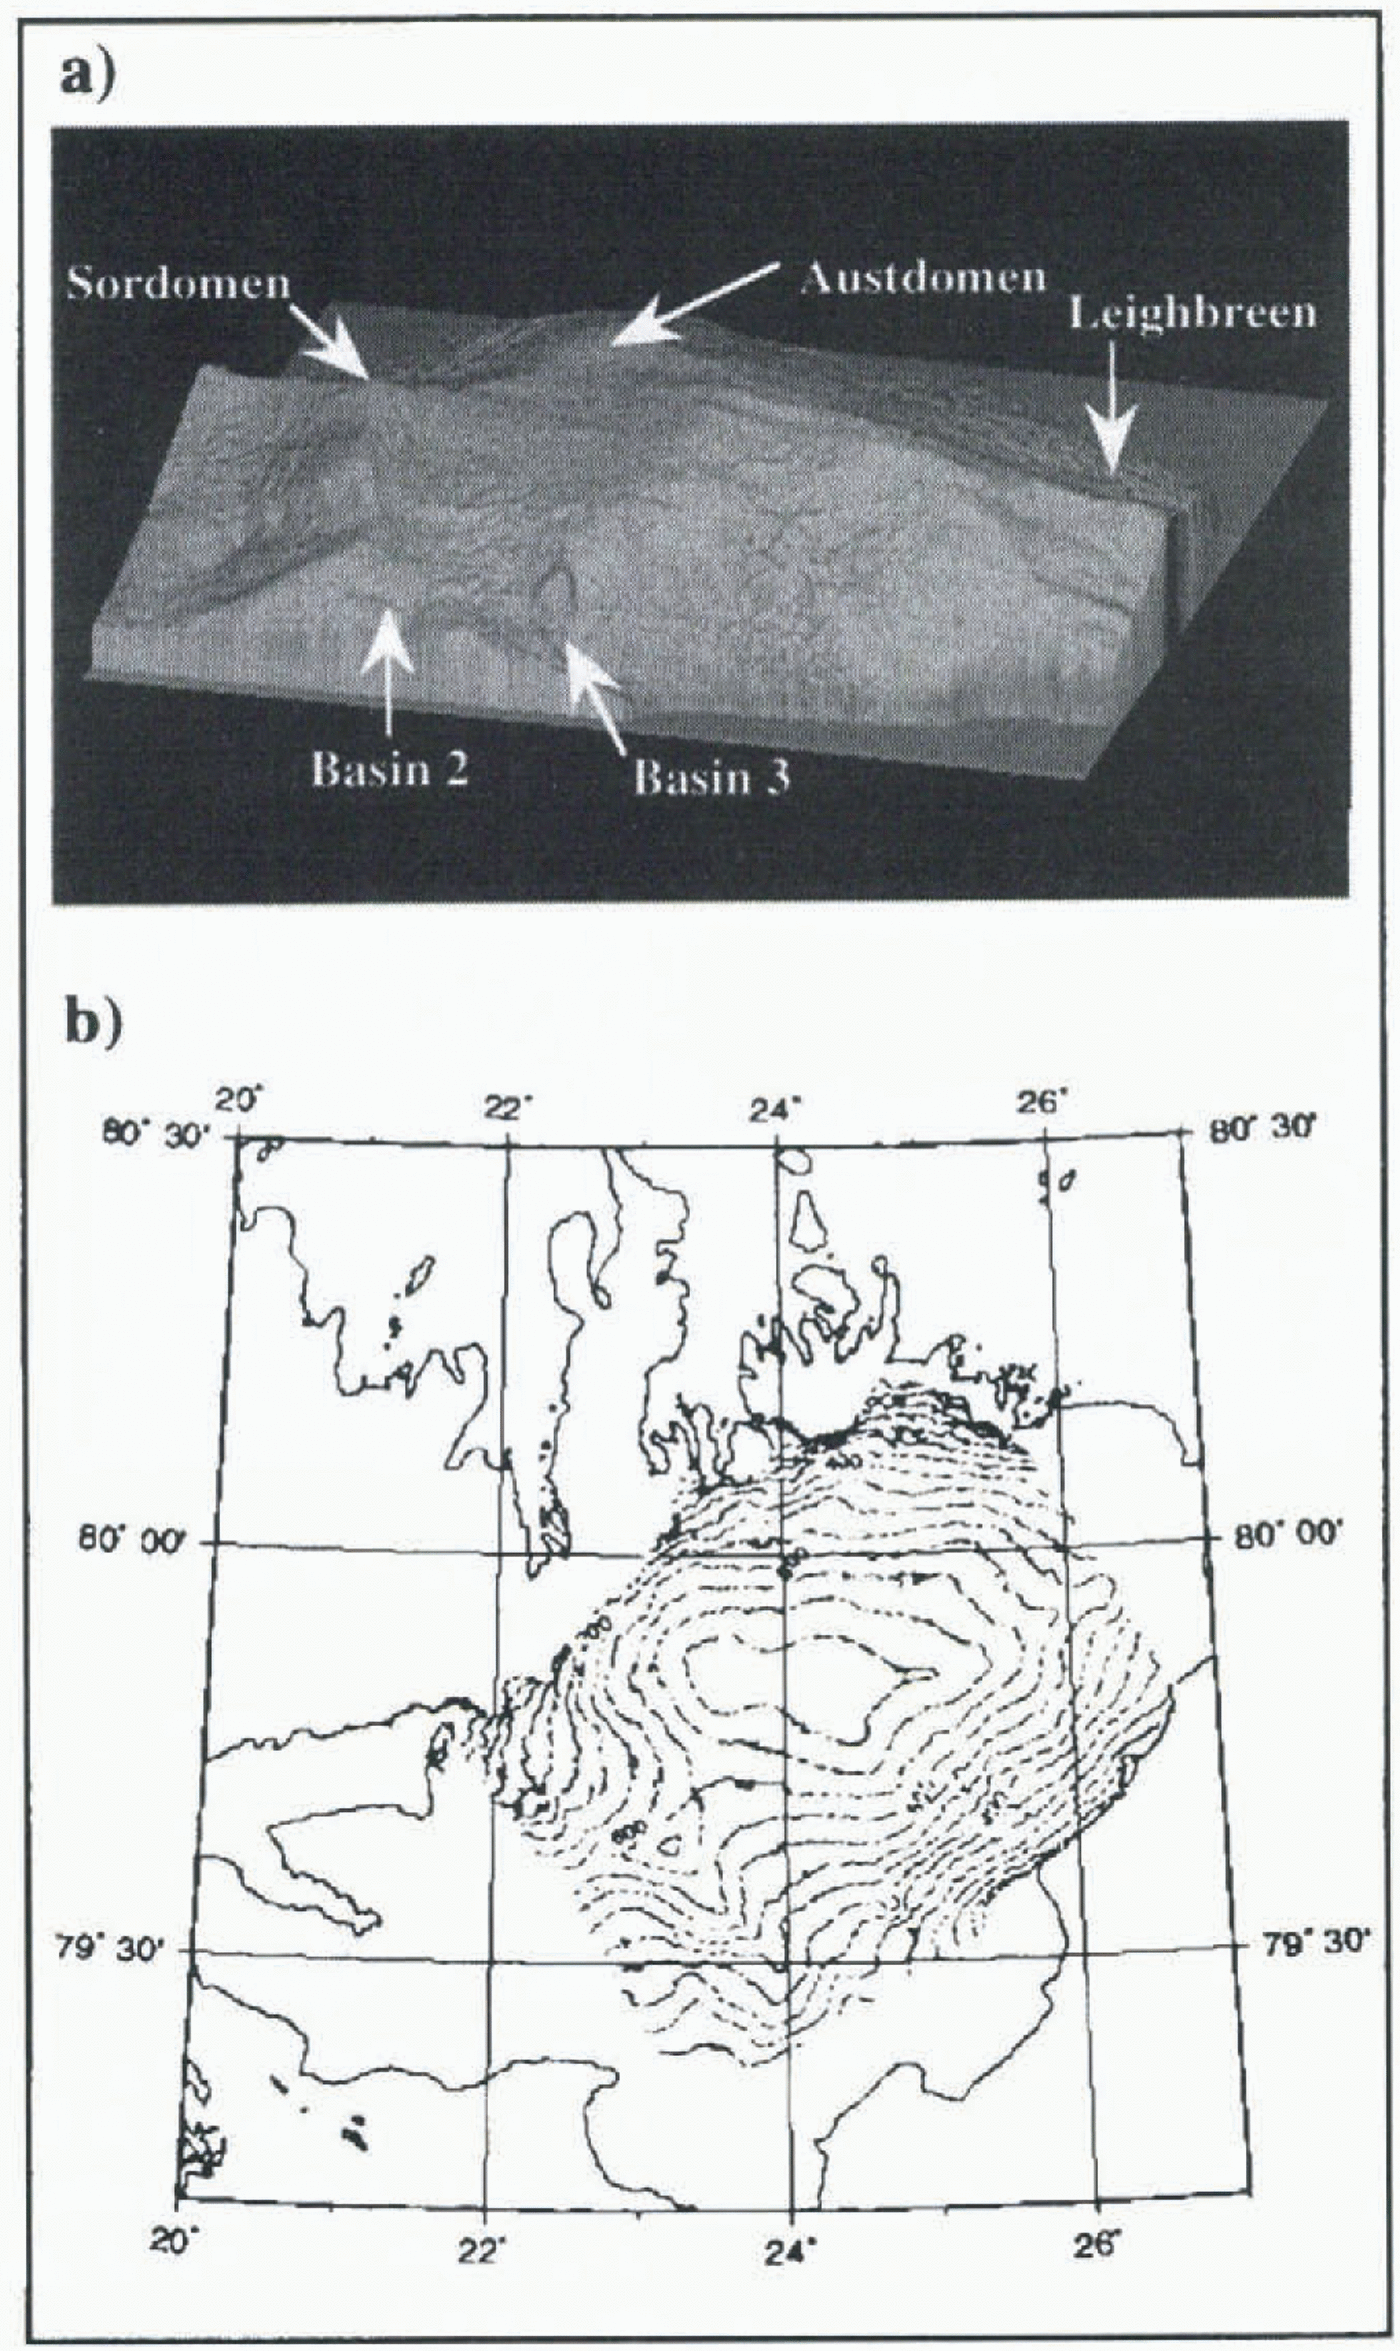
Once the baseline geometry is known, topographic heights may be derived from the unwrapped interferometric phase (Zebker and others, 1994). figure 4a shows a shaded isometric image of the interferometrically derived DEM. The main ice domes, Austdomen and Sørdomen (Dowdeswell and Drewry, 1985), can clearly be seen, as can the main ice divides delineating Austfonna’s drainage basins. The edges of this plot mark the edges of the SAR scene, or the limit of interferometric phase that could be unwrapped (see Fig. 3b), rather than the edge of the ice cap itself. A contour plot of the DEM is shown in figure 4b.
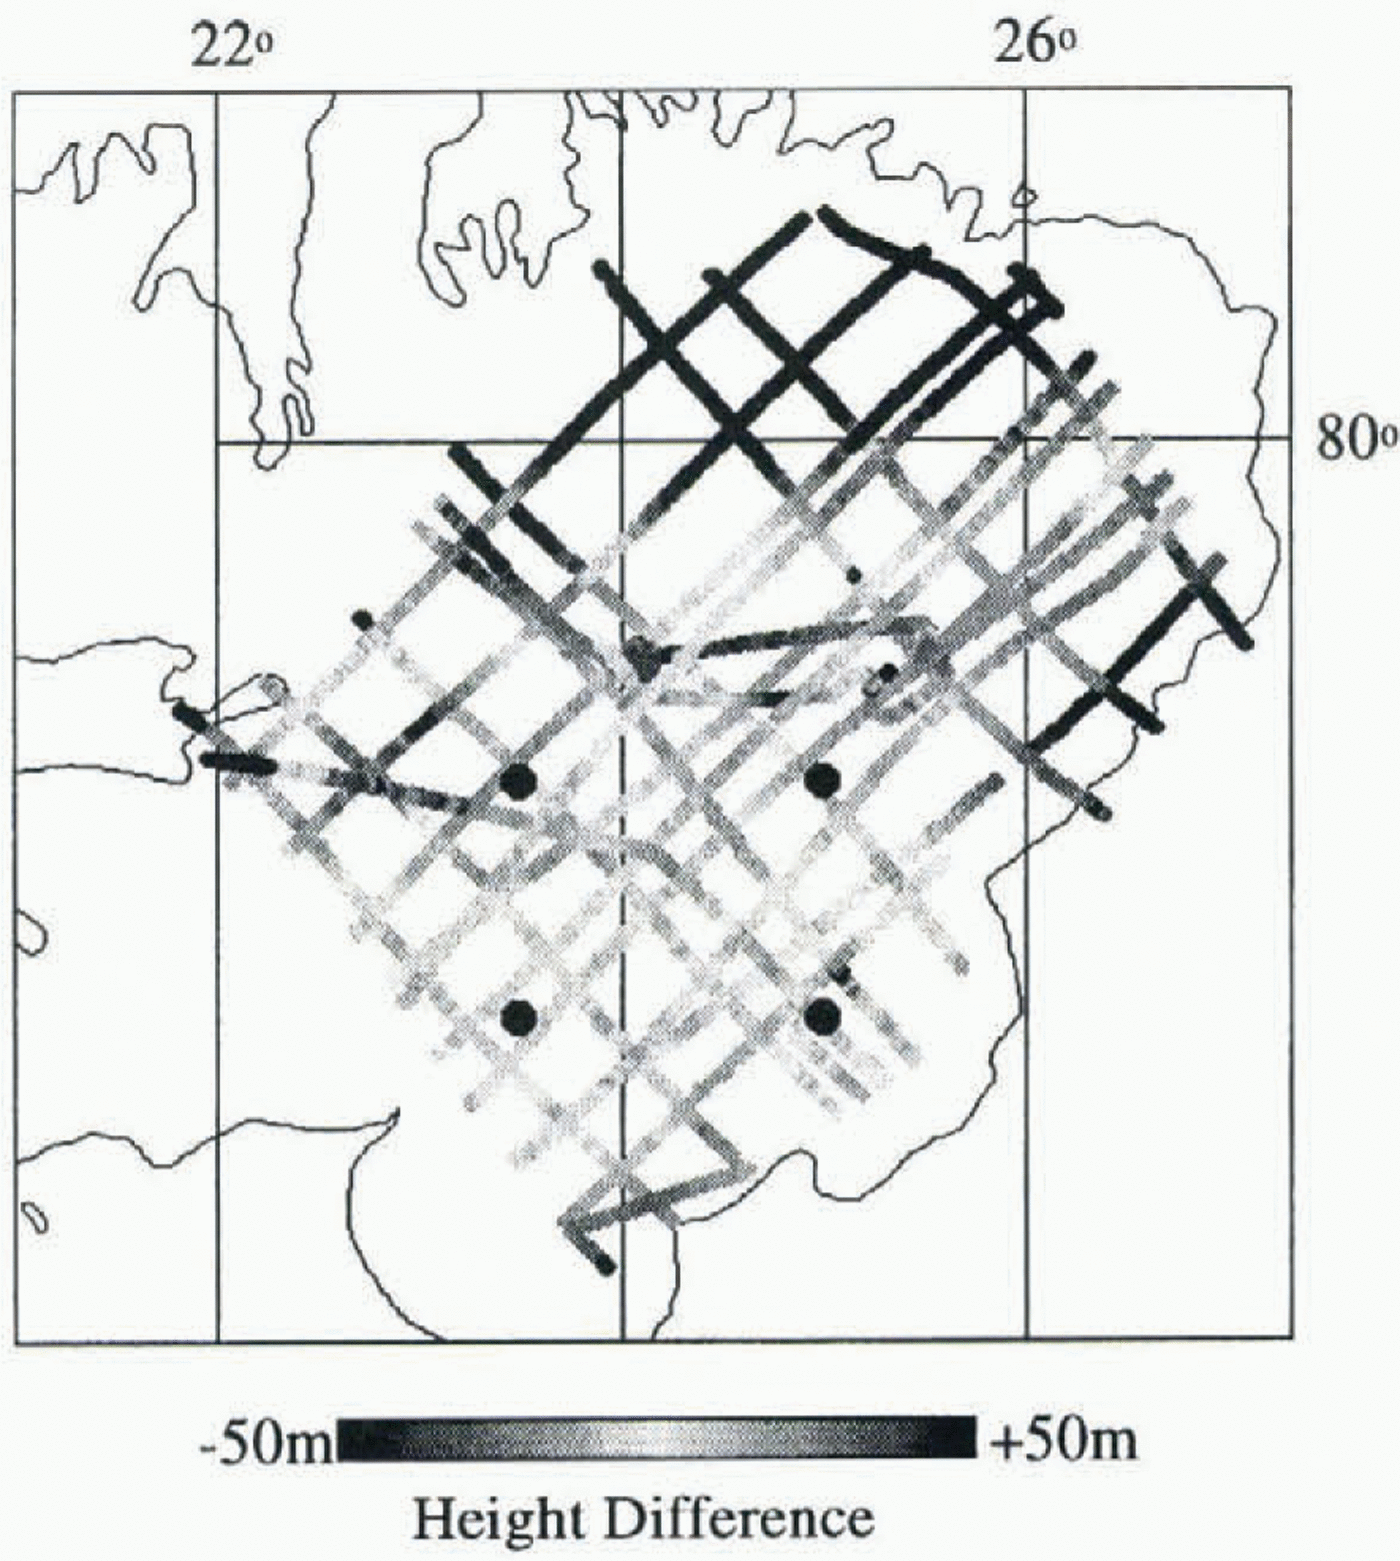
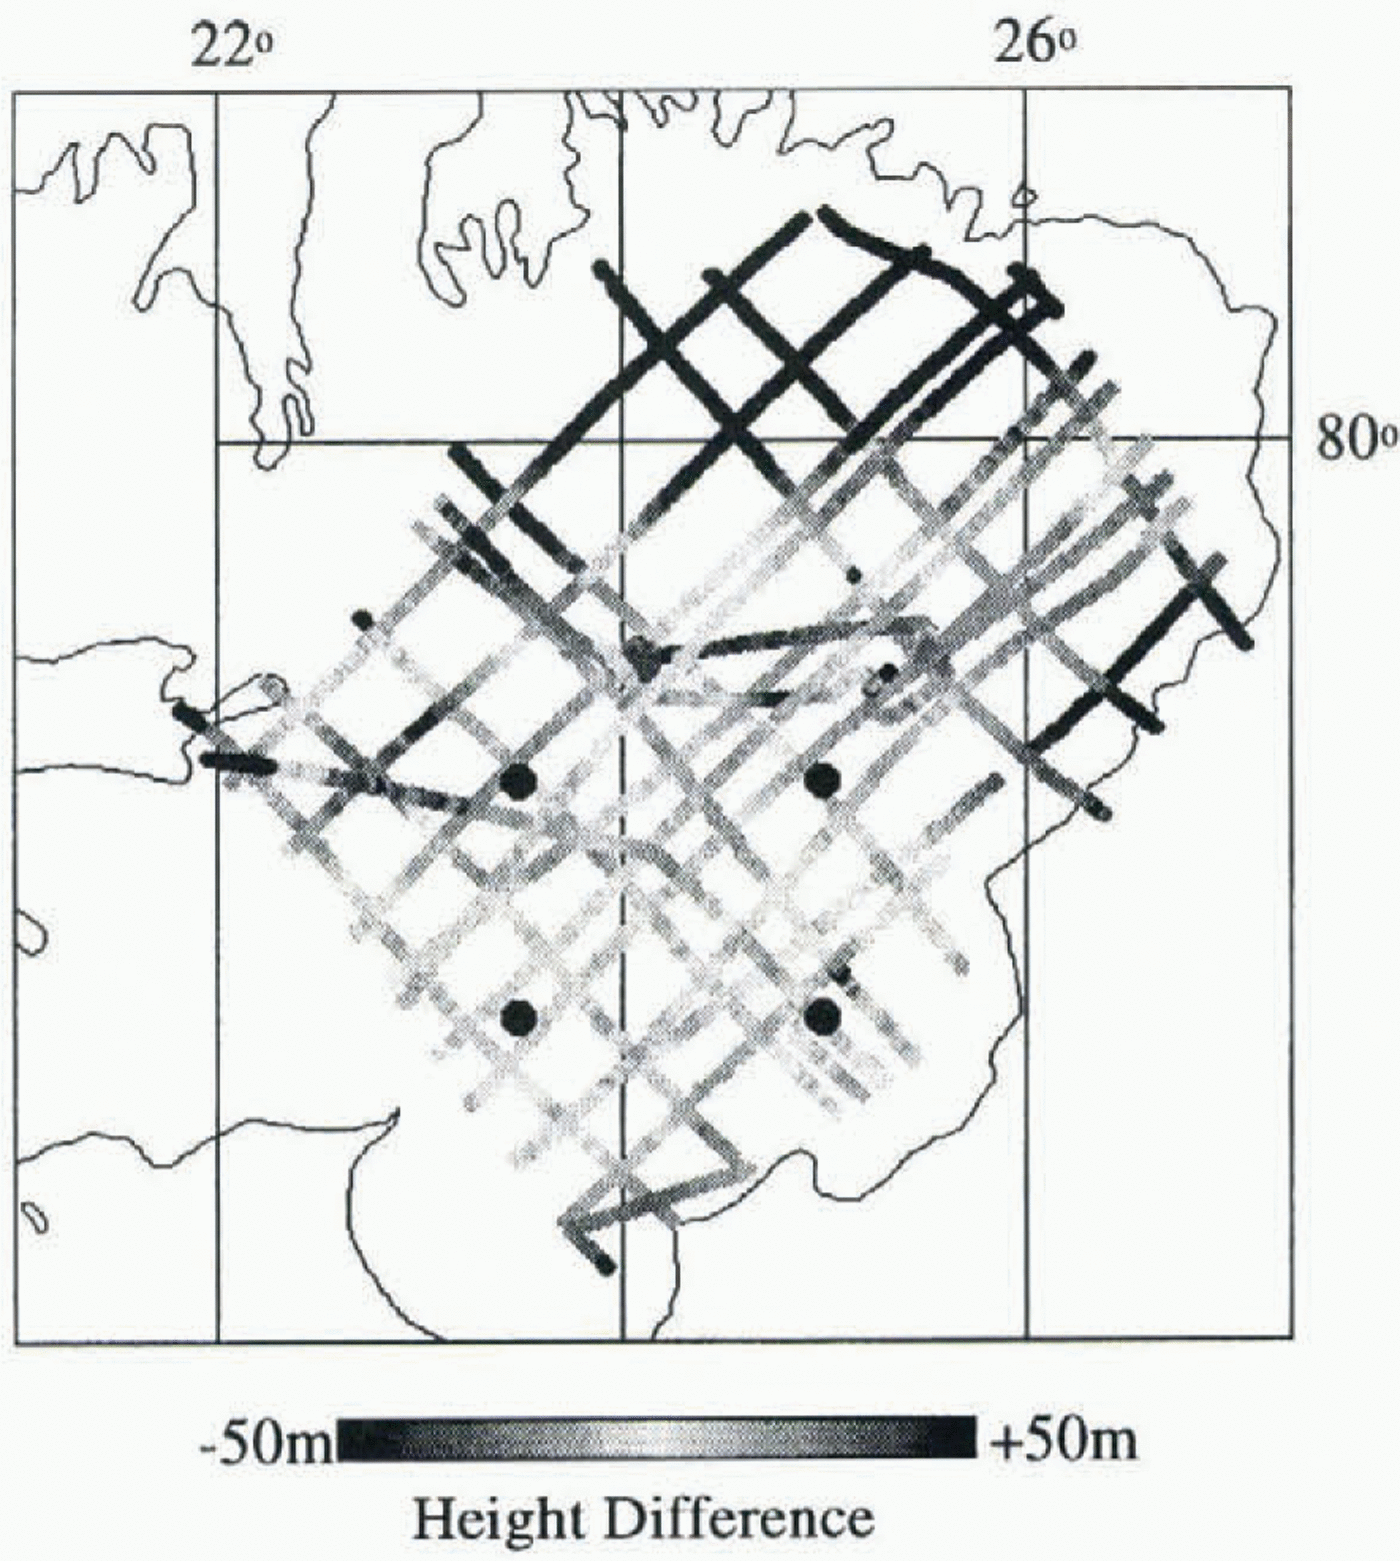
The interferometrically derived DEM was compared to the 2500 tie points selected from the low tie-point error zone. The average difference was 0.5 m and standard deviation 7.9 m. A comparison was also made with the whole tie-point data set, for which the mean difference was –12 m and standard deviation 42 m. Figure 5 shows that the largest dilferences occur in the northeast corner of the ice cap. No transponder fixes were available in this region. Slopes are also steep, exacerbating height errors arising from navigational uncertainties. Flight-line crossovers in the poorly navigated zone yielded RES height differences of up to 40 m (Dowdeswell and others, 1986). It is therefore likely that it is the RES data set that is in error in this area of the ice cap, rather than the interferometric height information. In order to corroborate this, an attempt to repeat the result using different SAR scenes is currently under way.
6 Drainage-Basin Flow Fields
The interferometric phase due to ice displacement was isolated by subtracting the unwrapped topographic phase from the mixed interferogram, l 1, 2, performing appropriate scaling to account for their different baselines (K wok and Fahne-stock, 1996). Since the baseline of l 1, 2 is known only to an accuracy of about 0.5 m, this cancellation of topography is incomplete, and a residual phase ramp remains. Each phase cycle from 0 to 2π represents a velocity increase of 0.95 cm d–1, or 3.5 m year–1. The residual error induced by a baseline uncertainty of 50 cm is roughly two fringes across the 100 km image in the look direction, which corresponds to a velocity change of about 7 m year–1. Over short distances, such as the width of an outlet glacier, this error can be considered negligible.
Differences between RES heights and the interferometrically derived DEM. The black circles delineate the area from which tie-points were used to constrain the baseline parameters. The largest differences occur where the reliability of the RES data was poor due to inadequate geolocation (see text).
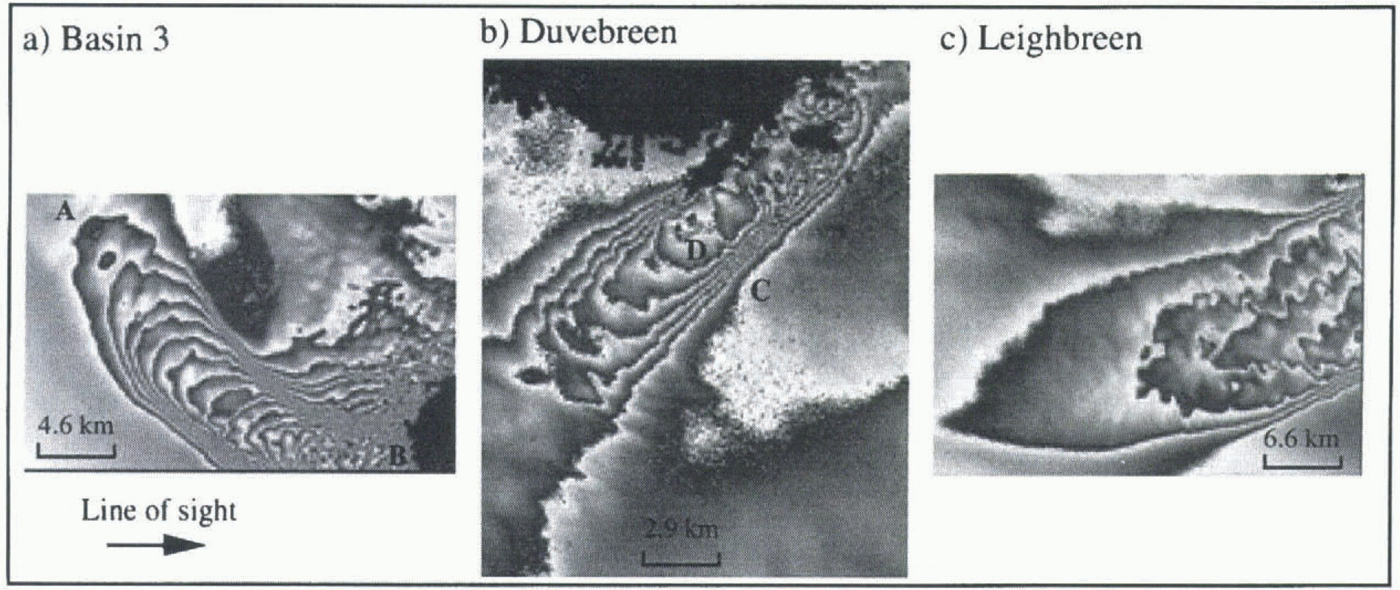
Displacement fringes for three of Austfonna’s drainage basins. Each cycle from black to white represents a velocity increase of 3.5 m year–1 in the line-of-sight of the satellite. Black areas represent regions where the topographic phase could not be unwrapped. The locations of these interferograms are indicated in Figure 1.
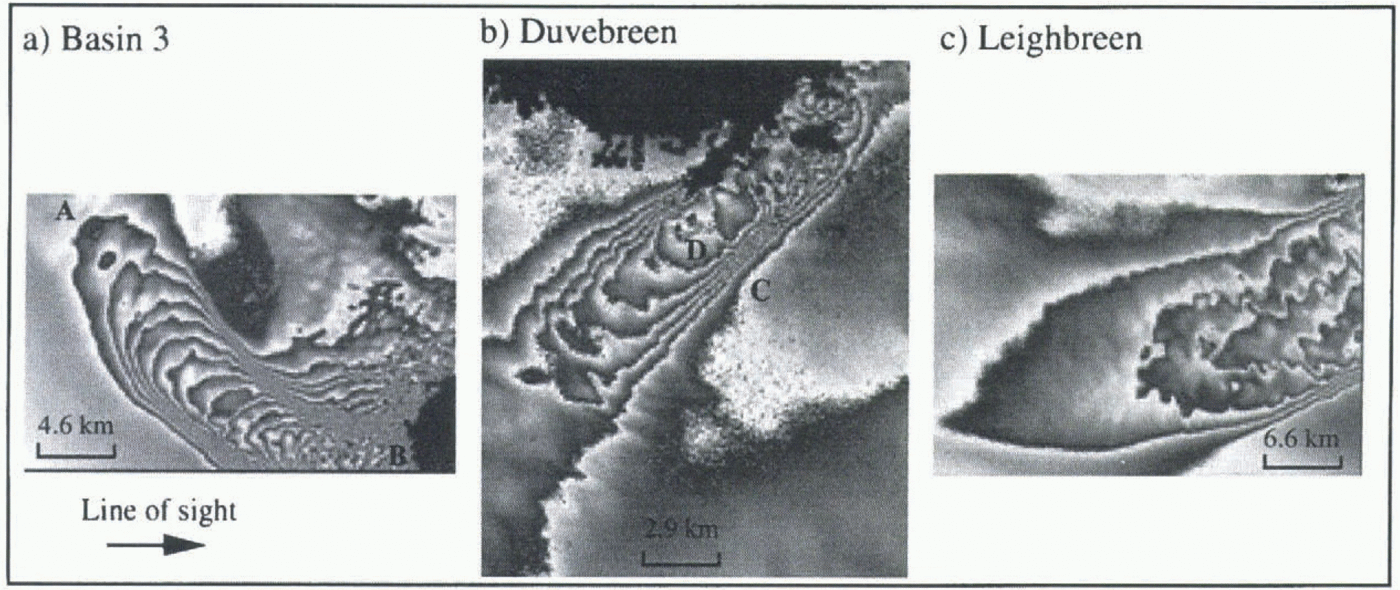
Figure 6 shows the displacement fringes for three of Austfonna’s drainage basins, for which flow was enhanced relative to the rest of the cap. The basins are Duvebreen in the north, Basin 3 in the south and Leighbreen in the east (Dowdeswell and Drewry, 1985). The interferometric fringes represent the flow-induced phase shift that occurred, in the line-of-sight of the satellite, during the 3 d period between the acquisitions of images 1 and 2. Each image is a contour map of slant-range displacement, with a contour interval of 2.8 cm (half the ERS-1 SAR wavelength). This converts to a line-of-sight velocity scale of 3.5 m year ’1 per fringe. As the origin of the phase shift is unknown, displacement, and hence velocity, may only be determined relative to that of a chosen reference point. In regions of phase continuity, absolute line-of sight velocities may be obtained if fringes are counted from a point of known velocity.
Examining Basin 3, for example, 18 fringes may be counted from where the flow begins at the point marked A to where it ends at point B, at the edge of the cap. This corresponds to a velocity increase over this region of 63 m year–1 (18 x 3.5). Since this represents only the velocity component in the line-of-sight of the satellite, true velocities will be higher.
Basin 5, to the east of Basin 3 (see Fig. 1) has maximum measured velocities of around 45 m year –1 (Dowdeswell and Drewry, 1989). Dowdeswell (1986) divided Austfonna’s drainage basins into two categories: those which had low driving stresses and were thought to be in the quiescent phase between surge activity, and those, such as Basin 5, which had high stresses and profiles and were interpreted as being frozen to their beds. Basin 3 was classified as the former type, and the high velocities visualised in figure 6a confirm that basal sliding is probably taking place. Leighbreen was thought to be intermediate between the two groups, with higher driving stresses than Basin 3. figure 6c confirms this observation. Duvebreen was not included in Dowdeswell’s study, but the high velocities implied by figure 6b, with a line-of-sight velocity increase of 21 m year–1 between points C and D, suggest that it could be in the same category as Basin 3.
7 Conclusions and Future Work
We have investigated the temporal coherence of ERS-1 First Ice Phase SAR data over Austfonna and identified a series of images suitable for interferometric study. We note the difficulty of obtaining sufficient quantities of coherent images in this region, due to high precipitation in the winter and melting in the summer. Topographic and displacement components of interferometric phase difference have been separated. The topographic phase has been used to produce a DEM of Austfonna, with a relative accuracy of 8 m and spatial resolution of approximately 40 m. The repeatability of this result, using different SAR scenes, is to be investigated and a comparison with ERS-1 altimetry data is currently under way. Since the use of satellite altimetry is highly problematic over regions of high slope, SRI provides an alternative for use over small ice caps and glaciers, as well as across the margins of the larger ice sheets. Resolution is also much higher than for altimetry, at about 40 m for data that has been multi-looked over 2 x 10 samples.
We have presented synoptic images of the line-of-sight velocity field of three of Austfonna’s drainage basins. We are currently investigating methods to obtain more complete resolution of the ice surface velocity vector. Vertical velocities are appreciable over local obstacles and are known to affect ice flow interferograms (Rignot and others, 1995). Physical assumptions concerning ice flow, and the use of ascending and descending scenes, will therefore be required to close the velocity vector.
Acknowledgements
This study was funded through U. K. Natural Environment Research Council grants GST/02/919 and GR3/9600. We would like to thank J. Dowdeswell, of the University of Wales, Aberyslwylh, and G. Rees, of SPRI, for allowing access to the radio-echo sounding data. We are grateful to I. Joughin of the Jet Propulsion Laboratory, Pasadena, for use of his phase unwrapping software, which was developed as part of his Ph.D. at the University of Washington. We thank the Norwegian Meteorological Institute for providing us with weather data.