

1. Introduction
The ability of states to carry out policies or provide services, such as ‘collect taxes, enforce law and order and provide public goods’ – their ‘capacity’ – is seen as crucial for economic development. The legal capacity to enforce rule of law and provide property rights is a key component of state capacity because it complements market activity (Besley and Persson, Reference Besley and Persson2011; Johnson and Koyama, Reference Johnson and Koyama2017: 2).Footnote 1 Providing property rights includes demarcating and re-defining rights, operating deeds registries, and arbitrating conflicts. These issues are usually studied from an institutional perspective (Besley and Ghatak, Reference Besley, Ghatak, Rodrik and Rosenzweig2010; Coase, Reference Coase1960; de Soto, Reference de Soto2000; Lamoreaux, Reference Lamoreaux2011; Libecap et al., Reference Libecap, Lueck and O'Grady2011; Libecap and Lueck, Reference Libecap and Lueck2011; North, Reference North1990; Yoo and Steckel, Reference Yoo and Steckel2016).
The ability of states to coordinate property rights provision is therefore central to our knowledge of the connection between state capacity and economic development. We study the provision of de jure property rights to land in two historical states in southern Africa, the Orange Free State (OFS) and the South African Republic (ZAR), primarily during the latter half of the 19th century. Known as the Boer Republics, both states implemented a metes and bounds (MB) land demarcation system where government officials recorded boundaries of farm parcels after European settlement (Braun, Reference Braun2015; Christopher, Reference Christopher1970: 96; Giliomee, Reference Giliomee, Lamar and Thompson1981; Liebenberg, Reference Liebenberg1973). Both states sought to improve their demarcation and recording systems, known as ‘inspections’, because they became an unreliable method to accurately record information in maps and deeds. The inaccurate information hampered each state's ability to collect taxes and led to conflicts amongst claimants.
We hypothesize that the different administrative capacities of the two states to implement and reform the inspection system influenced the quality of information of farm parcel boundaries in maps and thus the provision of de jure rights to European settlers. Accurate farm boundaries in maps reflect the government's ability to provide useful title deeds, maintain records that facilitate the transfer of ownership, and provide the public service of cartography. We use parcel shape in historical maps as a measure of map accuracy. We argue that the extent to which farm parcels are represented as squaresFootnote 2 captures inaccurate specification of farm boundaries and therefore poorer quality de jure rights. A key issue is that square parcels are optimal in relatively flat areas in an MB system (Libecap and Lueck, Reference Libecap and Lueck2011; Libecap et al., Reference Libecap, Lueck and O'Grady2011).
A model of the government's choice to survey farms after settlement by de facto claims in an MB system shows in a simple way how greater administrative capacity can lower the costs of survey and improve map accuracy. Because we measure outcomes from specific historical maps, we then include a review of the administrations and incentives of map compilers as the proximate factors influencing the accuracy of maps. The different administrations in the OFS and ZAR shaped the incentives of map creators because the administrations had different resources, standards of surveying and enforcement, training and expertise, and resistance to mapping by farmers. There were also other ‘macro’ factors at play, such as the relative political stability and wealth of the ZAR and the OFS.Footnote 3
To conduct a quantitative analysis and test the hypothesis that administrative capacity influenced the accuracy of farm parcels in maps, we collect information on farm boundaries. We digitize two sets of historical maps of farm boundaries. The first set was constructed by officials in the OFS and the ZAR at the end of the 19th century (OFS in 1886 and ZAR in 1892). The second set was constructed by the British military during the Anglo-Boer War (OFS in 1901 and ZAR in 1900). We also collect shapefiles of current (2019) properties provided by the South African government. We expect parcels of the ZAR to be less accurate (more square) than the OFS because it had lower administrative capacity. We also expect the 1900 military maps and 2019 shapefiles to be more accurate than the 19th-century maps because the administrations creating the later maps had better capacity.
Using OLS, where our outcome of interest is farm parcel shape (relative squareness) and including parcel-level measures of ruggedness, our findings broadly lend support to these hypotheses. We find that parcels in maps of the ZAR, which had less administrative capacity, tend to be more square compared to farms in the OFS. Within the ZAR, areas where map-makers had incentives to map the least accurately also have the most square farms on average. Last, compared to the maps created in 1886 and 1892, parcels tend to be less square in the 1900 British military maps (though imprecisely estimated) and 2019 property deeds. Areas in the ZAR show the largest ‘improvement’: farms are significantly less square in the 2019 shapefiles compared to the 1892 and the 1900 maps. The lack of a large statistical difference between the 19th-century maps and 1900 military maps suggests that the costs of previous administrations can limit future attempts to provide property rights (in terms of collecting information) even if the administration has resources, the officials have incentives, and officials have the training and expertise to accurately map property.
State capacity is usually thought of as consisting of fiscal capacity and legal capacity. Much research, which is primarily macro-historical owing to the concept's original use in comparative economic and political development, studies the determinants of a state's fiscal capacity (i.e. ability to collect taxes) and its relationship to economic development (e.g. Besley and Persson, Reference Besley and Persson2011; Cingolani, Reference Cingolani2013; Dincecco and Prado, Reference Dincecco and Prado2012; Johnson and Koyama, Reference Johnson and Koyama2017; Williams, Reference Williams2021).Footnote 4 In contrast, this paper contributes to our understanding of the development of legal capacity. Most work on legal capacity tends to be cross-country and often relies on indices of security of property rights, such as investor protection or property rights protection (e.g. Besley and Persson, Reference Besley and Persson2009, Reference Besley and Persson2011).Footnote 5 We provide more micro-level evidence on how the administrative structure was important for map accuracy, which helped coordinate other property rights services like deeds.Footnote 6 Last, our measure of map accuracy is novel in the literature on property rights cited above and specifically the literature on land demarcation (Libecap and Lueck, Reference Libecap and Lueck2011; Libecap et al., Reference Libecap, Lueck and O'Grady2011). Our measure of ‘accurate’ information in maps complements recent work on the ability and resources of states to capture and process information in the production of aggregate statistics, which is particularly important for African states today (Brambor et al., Reference Brambor, Goenaga, Lindvall and Teorell2020; Jerven, Reference Jerven2013). South Africa's surveying administrations have adapted over time to adopt international standards and new technologies of surveying, even though it is currently considered a ‘weak state’ along other dimensions.Footnote 7
Next, we provide background on the Boer Republics and their land demarcation systems. Section 3 overviews a model of the government's decision to survey. Section 4 reviews how the administrative structure and personnel incentives influenced the accuracy of maps created by OFS and ZAR officials in the 19th century, maps created by the British military in 1900, and the 2019 shapefiles provided by the South African government. Section 5 discusses the digitization of the maps, construction of measures of parcel accuracy, and our regression approach. Section 6 reports results. Section 7 concludes.
2. Historical background
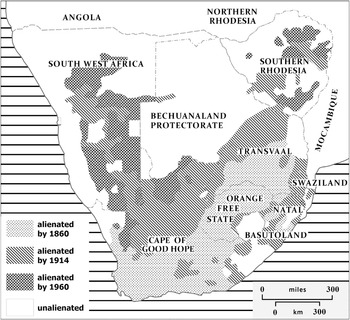
Figure 1 shows the two Boer, which means farmer, Republics, the Republic of the OFS and ZAR (or Transvaal), relative to other territories and colonies in 19th-century southern Africa. At the frontier of southern Africa, substantial migration by settlements of European, largely Dutch, descent from the British Cape Colony led to more dense population settlement in these areas in the 1830s and 1840s (Muller, Reference Muller1993).Footnote 8 The expansion of the British Cape Colony into the interior from the 1830s to the 1850s also helped consolidate the Boer Republics into official states that sought self-governance and independence from British colonial influence.Footnote 9
Main states in southern Africa and land alienation, 1860–1960. Source: Christopher (Reference Christopher1983).

Their creation went with the appropriation of the land of and resistance from indigenous populations as well as the creation of so-called native locations (Braun, Reference Braun2008, Reference Braun2015; Colson, Reference Colson and Turner1971; Keegan, Reference Keegan1987). We focus on the provision of de jure property rights for white settlers in largely Venda and Pedi lands (Braun, Reference Braun2005, Reference Braun2008).Footnote 10 Both republics transferred a significant amount of land to private Europeans during the 19th and 20th centuries (shown in Figure 1).
2.1 Land alienation and demarcation in the Boer Republics
The OFS and the ZAR provided de jure property rights to land to satisfy basic objectives: ‘the settlement of Europeans upon land, the raising of revenue, provision of security, raising agricultural and pastoral production’ (Christopher, Reference Christopher1983: 374). Revenues came through land sales, leases, and taxes. The ZAR also used land to back its currency notes in the 1860s and it continued to be used for the settlement of state debts until the 1890s (Christopher, Reference Christopher1983: 375).
Both states had liberal land grant policies and a demarcation system that was based on the Cape-Dutch model, which was a type of MB system. Officials recorded parcel boundaries after European settlement (Christopher, Reference Christopher1970: 96; Giliomee, Reference Giliomee, Lamar and Thompson1981).Footnote 11 Farms were generally granted in standardized areas with sides of one-hour ride via horseback. This was estimated to give owners about 3,750 morgen or 3,200 hectares (approximately 12.5 square miles) of land (Christopher, Reference Christopher1970, 1983). The ‘idea’ of a square farm had been accepted in southern Africa (Christopher, Reference Christopher1970: 96), but a square farm was not guaranteed: farms were measured by horse-riding and horses could ride at different paces, the authorities did not have to enforce farm parcels to be a certain shape, and, as will be discussed further below, square parcels are not economically efficient in rugged areas (Libecap and Lueck, Reference Libecap and Lueck2011; Libecap et al., Reference Libecap, Lueck and O'Grady2011).
The states used an ‘inspection system’ to demarcate property boundaries. Generally, a settler submitted a claim to a local official (such as a field cornet or magistrate). A commission of local officials and landowners (3 in total) then inspected the land. The result of the inspection was a description of the parcel and sketch maps of the property. The description and sketches were then included in government records. The government conferred title after payment for inspection. In the ZAR, there was a three-month period where neighboring landowners could contest the claim. In the OFS, an advertisement for the claim was placed in the Bloemfontein Gazette six weeks before the inspection. After the inspection, the commission submitted a copy of the report with a diagram of the claim to the government secretary. If there was no opposition three months after publication, the state president signed the land title and the settler could collect a copy of the title from the magistrate (Braun, Reference Braun2008: 239–240; Liebenberg, Reference Liebenberg1973).
The MB-inspection system may have held initial cost advantages for the governments because land had been settled before the creation of the Republics. Conducting a survey before allowing further occupation would have required the governments to forego revenues from land sales and delay pastoral and agricultural production (Libecap et al., Reference Libecap, Lueck and O'Grady2011). The inspection systems, however, became increasingly insufficient for reliable information on the extent and value of land for reasons discussed in section 4. Continual conflicts between settlers also led to additional expenses from surveys and re-surveys (Braun, Reference Braun2015: 208; Liebenberg, Reference Liebenberg1997: 133).
Both the OFS and ZAR sought to improve the quality of information in maps by improving the administration of the inspection system. Building on the historical narrative, we hypothesize that differential improvements in the administration in the OFS and the ZAR mediated the inspections and therefore the accuracy of farm parcel boundaries recorded in maps.
3. State capacity and provision of de jure property rights
3.1 Model
To understand how state capacity can influence the specification of farm parcels in maps, we analyze a model of a government's decision to survey property and provide de jure rights when de facto rights have been established in an MB system.Footnote 12 In our context, the governments already possessed some information about the location of farm parcels, so ‘survey’ can be interpreted as ‘resurvey or reinspect’. The model is fully described in the online Appendix. Here we present and interpret the main condition relating when a government will decide to survey land and how it relates to state administrative capacity and map accuracy.
A government will survey land at time τ when the present value of revenue under survey less the costs of surveying (V s) is greater than the revenue of maintaining an MB system ($V^{{\rm MB^{\prime}}}$ ): $V^{\rm s}-V^{{\rm MB^{\prime}}} > 0.$
 This condition yields

The first term is the increased benefits (in terms of revenue) of surveyed land, accurate records and information, and savings on boundary disputes that would have occurred after time τ′ if an MB system continued. The second term is the costs of implementing a survey, which is a function of the area A to be settled, the state's administrative capacity B, and the ruggedness of the terrain t. Governments looking to replace a land demarcation system face a cost of constructing an accurate survey that depends on their capacity (B).
If there is a larger area A or a more rugged terrain t, the costs of survey will increase ($( {\partial C_\tau^{\prime} /\partial A} ) > 0$ , $( {\partial C_\tau^{\prime} /\partial t} ) > 0$
 ). If a government has greater capacity to carry out surveys B, the costs of surveying land are less than the costs in states with less capacity ($( {\partial C_\tau^{\prime} /\partial B} ) < 0$
 ). The model treats ‘state capacity’ as exogenous. Economic theories of state capacity show that political leaders or governments can choose to invest in state capacity (e.g. Besley and Persson, Reference Besley and Persson2009, Reference Besley and Persson2011). The OFS and ZAR sought to invest in their administrative capacities to improve inspections and the informativeness of maps (discussed in the next section).
There are two important points about the model and how it relates to the empirical analysis. First, we think of the administrative structure and incentives of map compilers to accurately record parcel boundaries as central components of capacity B when comparing two different states. The administrative incentives depended on the governments' standards and the standards' enforcement, surveyors' expertise and training, resources or mapping technologies available, and the willingness of farmers to have their property accurately measured. For simplicity, we assume the individual demarcation costs incurred by de facto claimants are zero because they are sunk (see the online Appendix). Their sunk costs, however, may influence officials' incentives to accurately survey. For example, farmers who invested in agricultural production may be more likely to resist mapping if they may lose land as a result of more accurate surveys of their property. Facing this opposition, officials may have been more likely to quickly and haphazardly conduct inspections.
State administrative capacity was also likely a result of macro influences, such as political stability and wealth, that shaped the organizational incentives of map compilers during the 19th century.Footnote 13 In the model above, greater political instability could decrease the time horizon T and increase the government's incentives to keep the existing MB system without an accurate survey. Greater wealth could allow a government to invest in the survey department's resources to map, enforce standards of measurement, or employ trained surveyors.
Second, the model predicts if governments will choose to ‘survey or not’. Our empirical analysis proposes to use a measure of the ‘accuracy of surveys’ as the main outcome as opposed to if a survey was conducted or not. In a simple way, the difference between V s and $V^{{\rm MB^{\prime}}}$ can be thought of as a measure of how accurately farms will be mapped (the smaller the difference, the less accurate). We use the shape of farms, specifically a farm's relative squareness, as our outcome of interest.
A key alternative hypothesis is that farms are more square because, as discussed in the online Appendix and established in the literature, it is economically efficient to have square farms in areas that are relatively flat under an MB system (Libecap et al., Reference Libecap, Lueck and O'Grady2011; Libecap and Lueck, Reference Libecap and Lueck2011). The model also shows that more rugged terrain increases the costs of mapping, which would lead to poorer quality maps (i.e. more square parcels). The historical narrative suggests that the terrain and distance from capitals (governments' administrative centers) influenced officials' incentives to accurately record parcels (Braun, Reference Braun2015). We include measures of ruggedness at the farm level in the analysis. The sign of the coefficient will be informative about which effect dominates.
4. State capacity and map accuracy
We use maps of farm parcels compiled in the 19th century under the OFS and ZAR (OFS in 1886; ZAR in 1892), by the British military (OFS in 1901; ZAR in 1900), and shapefiles provided by the current South African government (2019) to create measures of accuracy of farm parcel specification. In this section, we overview how different administrative capacities influenced the construction of each source.
4.1 Nineteenth-century maps: 1886 survey of farms in the OFS and Troye's 1892 Map of the Transvaal
The first maps were created by government officials from the OFS and ZAR in the 19th century. The ZAR map is Troye's 1892 Map of the Transvaal, published by Wurster Randegger & Co., of Winterthur, Switzerland (hereafter referred to as Troye's 1892 map). Troye worked in the Office of the Surveyor General in Pretoria. The map is considered a ‘compilation map’ because he compiled it using property diagrams and cadasters in local survey departments and in the Office of the Surveyor General. The information available to him accumulated over 60 years of inspection reports, disputes, and re-inspections. Diagrams were sketches that were often without mathematical data, such as angle and side measurements (Braun, Reference Braun2008: 240–260, Reference Braun2015, Chapter 5). Troye's goal to ‘‘show all the landed properties in the Republic […] was utterly impossible to complete […] owing to a lack of sufficient reliable information’’ (qtd. in Liebenberg, Reference Liebenberg1973: 170).
The diagrams were the work of untrained inspectors who abused the inspection system. Inspections were generally without meaningful accountability or standards even though the government (Volksraad) sought to implement national standards and improve inspection commissions from 1864 to 1899. There was no existing system for training surveyors in European methods and instrumentation, which were necessary to conduct accurate maps.Footnote 14 Inspectors had incentives to misreport property and there was little enforcement of standards.Footnote 15 There is evidence of officials inspecting blocks of hundreds of parcels (or plots, plaatsen) at a single time (Braun Reference Braun2015: 201, 202).Footnote 16 Last, some farmers in the ZAR were resistant to mapmakers and more accurate surveys, which likely decreased inspectors' incentives to provide accurate information (Carruthers, Reference Carruthers2003: 959, 965; Pelzer, Reference Pelzer1950: 56, 172).Footnote 17 While accurate maps could help resolve conflicting claims, some farmers could significantly lose. Braun (Reference Braun2015) notes that proper surveys could entail additional taxes, diminish the value of farms by making property smaller or excluding valuable ground, or dispossess an owner entirely without compensation (p. 212). Reforms were incrementally taken throughout the period, depending on the ZAR's finances. When new standards were implemented, enforcement was weak. Though the administration did not incur large fixed costs to initially survey the land, the poor quality of maps and inspections compounded and significantly increased the costs of correcting initial inspection reports.Footnote 18
In contrast to the compilation map of farm parcels in the ZAR, the OFS map we use is an original ‘plan of survey’ of the border area between the OFS and Basutoland (now Lesotho). Government surveyors and commissioners delineated and surveyed the new border area in the division of Ladybrand.Footnote 19 The survey appears to have been conducted by government officials in 1886 to accompany the commission report sent to the OFS government. Surveyors likely had an incentive to map the area as accurately as possible because the survey was of an important area of the OFS (the new border). The 1886 survey was conducted after improvements in standards for surveying in the OFS (discussed next). It contains information set out in the new standards, such as coordinates, scale, location of land beacons, and the direction for true north.
Unqualified surveyors initially sat on commissions that inspected farms in the OFS in the 1850s. Diagrams attached to land commission reports were as primitive as inspections conducted in the ZAR. The legislature made early efforts to improve the accuracy of recording (Liebenberg, Reference Liebenberg1973: 135–137). Though a Surveyor General was only appointed in 1876, chairmen of land commissions and surveyors were warned to take greater care and make diagrams more accurate. They were also instructed to not only note the size (area) of the farm, but also the scale and the direction (northern point). Ordinance 1 of 1863 dictated that the Title Deeds Office should not accept diagrams if the lengths of the borders and the corners were not marked. In 1868, a standard measurement unit was established, which was the same unit used in the Cape Colony. Standard measuring sticks were also made available to surveyors from the Treasury (Liebenberg, Reference Liebenberg1973: 137).
The creation of the Office of the Surveyor General and implementation of a general survey law in 1877 appear to have improved the standards for surveys and were enforced.Footnote 20 It formalized a system of examining surveyors. The Surveyor General was authorized to check and approve all surveyed properties before deed registration. Surveyors were required to include additional measurements, such as the azimuth of the longest boundary line and the magnetic meridian, calculated from compass surveying) (Liebenberg, Reference Liebenberg1973: 138). Any approved land titles and diagrams were to be published monthly in the government newspaper. The general survey was completed on a more scientific base using cadastral measurement of blocks of farms in districts. Each district was surveyed by a separate surveyor, however, and it was practically difficult to compile the separate surveys because each surveyor used their own baseline. The surveying reform efforts appear to have been enforced and improved the quality of maps, though they were still limited without accurate topographical information (Liebenberg, Reference Liebenberg1973: 139).
We hypothesize that, though Troye may have tried to record all farms of the ZAR, the information he relied on, a result of incentives of inspectors to inaccurately record farm boundaries, made his map less accurate than the original survey of the OFS. We expect there to be differences within the ZAR because some areas were farther away from the capital and faced significant resistance to mapping. Other macro factors would also lead the ZAR to have less capacity than the OFS. Until the discovery of gold in 1884 in the ZAR, the OFS was generally wealthier than the ZAR after the discovery of diamonds in 1867. The OFS also benefitted from close trade with the British Cape Colony (Keegan, Reference Keegan1987: 196; Giliomee, Reference Giliomee, Lamar and Thompson1981: 116). The ZAR was politically unstable. It saw ongoing conflict with three smaller independent Boer Republics—Lydenburg (an area we include in the analysis), Utrecht and Soutpansberg—that fought to maintain their independence from 1856.Footnote 21 Governance did not improve and, by 1877, the British annexed the ZAR. The annexation was initially unopposed. Three years later, however, local political authorities (burgers) in the ZAR proclaimed, fought for, and regained their independence.
4.2 Military maps: Imperial Survey of South Africa, 1900 and Orange River Colony Degree Sheet Series, 1901
We use maps created by the British military during the South African or Anglo-Boer War (1899–1902) to compare accuracy with the 19th-century maps. Similar to Troye's 1892 map, the military maps we use, the Imperial Map of South Africa (1900) and the Orange River Colony Degree Sheet Series (1901), are compilation maps based on local farm surveys. Thus, their map accuracy is a function of two countervailing forces: (1) the incentives of the actual map compilers and (2) the quality of surveys available to them. The British military, specifically the trained surveyors it employed and those it partnered with, had incentives to accurately construct maps even though the military had a different objective function than the OFS and ZAR administrations (and therefore likely a different calculus from our model).Footnote 22 The extent of the improvement may have been limited by the existing records available to the military officials.
It seems likely the military map creators had incentives to reconcile local survey differences to map farm parcels as accurately as possible. The war was primarily ‘fought on horseback, [thus] farm boundaries and farm names were considered important’ to include (Liebenberg, Reference Liebenberg2007). Further, the mapping branch of the Field Intelligence Department contracted with a local surveying firm, Wood and Ortlepp of Cape Town, to produce the 1900 Imperial Map series. The Field Intelligence Department, and therefore the British military, covered the expenses and ownership of the map would revert to the compiler John T. Wood after the war. The map appears to have been valuable because copies were sold and it was used for commercial purposes.Footnote 23 If the company expected the map to be valuable in the future, it is reasonable to conclude they would have an incentive to try to accurately reconcile existing surveys. Their ability to do so, however, may have been constrained by the type of information available in local surveys. The magnitude of the difference of parcel accuracy between the 19th-century maps and the military maps, if there are any differences at all, is one way we can test for this.
The 1900 Imperial Map covers the ZAR and the OFS, but we only use it for the ZAR because sheets of the areas in the OFS are not digitally available. We use the Orange River Colony Degree Sheet Series (1901) for information on parcels in the OFS. A new Mapping Section of the British military installed in Bloemfontein, the capital of the OFS, created the series after the British took over in 1900 (Liebenberg, Reference Liebenberg2007). Officials found the information in the 1900 Imperial Map of South Africa for the OFS inadequate. The new mapping section consisted of five Royal Engineers and eight civilians (Liebenberg, Reference Liebenberg2007). The series was created using farm diagrams in the Office of the Surveyor General. Compared to the 1886 plan of survey of Ladybrand, we expect the 1901 map to show improvement in accuracy. But, because the map creators may have used surveys like the 1886 Ladybrand survey in its construction, the change in ‘accuracy’ of parcels may not be a large or statistically significant change.
4.3 2019 Deeds shapefiles
We expect property boundaries to be accurate in current (2019) records. The Anglo-Boer War and the beginning of the 20th century ushered in comprehensive surveying and mapping of British South Africa (Liebenberg, Reference Liebenberg1997). A substantial geodetic framework, which allowed surveyors to correct for the curvature of the earth's surface through triangulation, was implemented in South Africa by 1906 (Liebenberg, Reference Liebenberg1997).Footnote 24 The British Imperial government underwrote the cost of the primary geodetic triangulation carried out between 1903 and 1906. Topographical surveying and secondary triangulations developed unevenly thereafter across the former colonies (Braun, Reference Braun2015: 229).
A national mapping project was planned from 1936 to 1956 under the Trigonometrical Survey Office. After World War II, aerial photographs produced by the South African Airforce facilitated the creation of accurate national maps. The 1950s and 1960s saw further demand for accurate surveys from the Departments of Water, Transport and Telecommunications for infrastructure development. The government adopted new technologies, such as GPS, to facilitate surveying. Today, the office of the Department of Rural Development and Land Reform houses the National Geo-spatial Information (NGI), founded by the Land Survey Act 8 of 1997. The NGI is South Africa's national mapping organization. The NGI established an integrated survey system and contributes to South Africa's standards for geographic information. It manages South Africa's geodetic and topographic surveys and produces publicly available coordinate reference systems, known as the New South African Datum or the Hartebeesthoek94 Datum based on the World Geodetic System 1984 (WGS84), for GIS. The NGI describes this service as supporting South Africa's ‘status of possessing one of the most up to date and advanced integrated survey reference systems in the world’.Footnote 25
To summarize, we argue that the OFS had greater capacity than the ZAR from 1860 to 1900, and therefore should have more accurate 19th-century maps. The OFS not only had more capacity in terms of its administrative structure and personnel incentives, but it was also relatively more politically stable and had greater wealth than the ZAR. There may be heterogeneity within the ZAR because officials had weaker incentives to accurately map areas farther from the capital and where farmers opposed mapping. We argue that the British military had better incentives to construct relatively more accurate maps in 1900 than the 19th-century maps, so maps of farms in the OFS and ZAR should both ‘improve’. We expect maps of farms in areas of the ZAR to show the largest improvement given its initially lower starting point in terms of map quality. The magnitude of the change may not be large, however, because military officials relied on maps of farm parcels created by the OFS and ZAR. Last, we expect the 2019 shapefiles to be the most accurate because South Africa has a system of mapping using modern technologies and based on internationally established scientific standards.
5. Data and method
5.1 Data and summary statistics
We digitize farm parcels in areas of the OFS (Ladybrand) and the ZAR (Nylstroom; Lydenburg) from the historical maps discussed above.Footnote 26 We also use shapefiles of farm portions, which reflect 2019 deeds to land, provided by NGI and the Chief Surveyor General Office. We chose Ladybrand in the OFS because it was the earliest map showing farms we could find in the Western Cape Archives. For the ZAR, we chose Nylstroom because it is approximately the same distance from the state capital of the ZAR (Pretoria) as Ladybrand is from the capital of the OFS (Bloemfontein). Last, we chose the Lydenburg region of the ZAR because it was at the frontier of the state and the historical literature emphasizes that farmers in the region were especially resistant to central control and mapping.
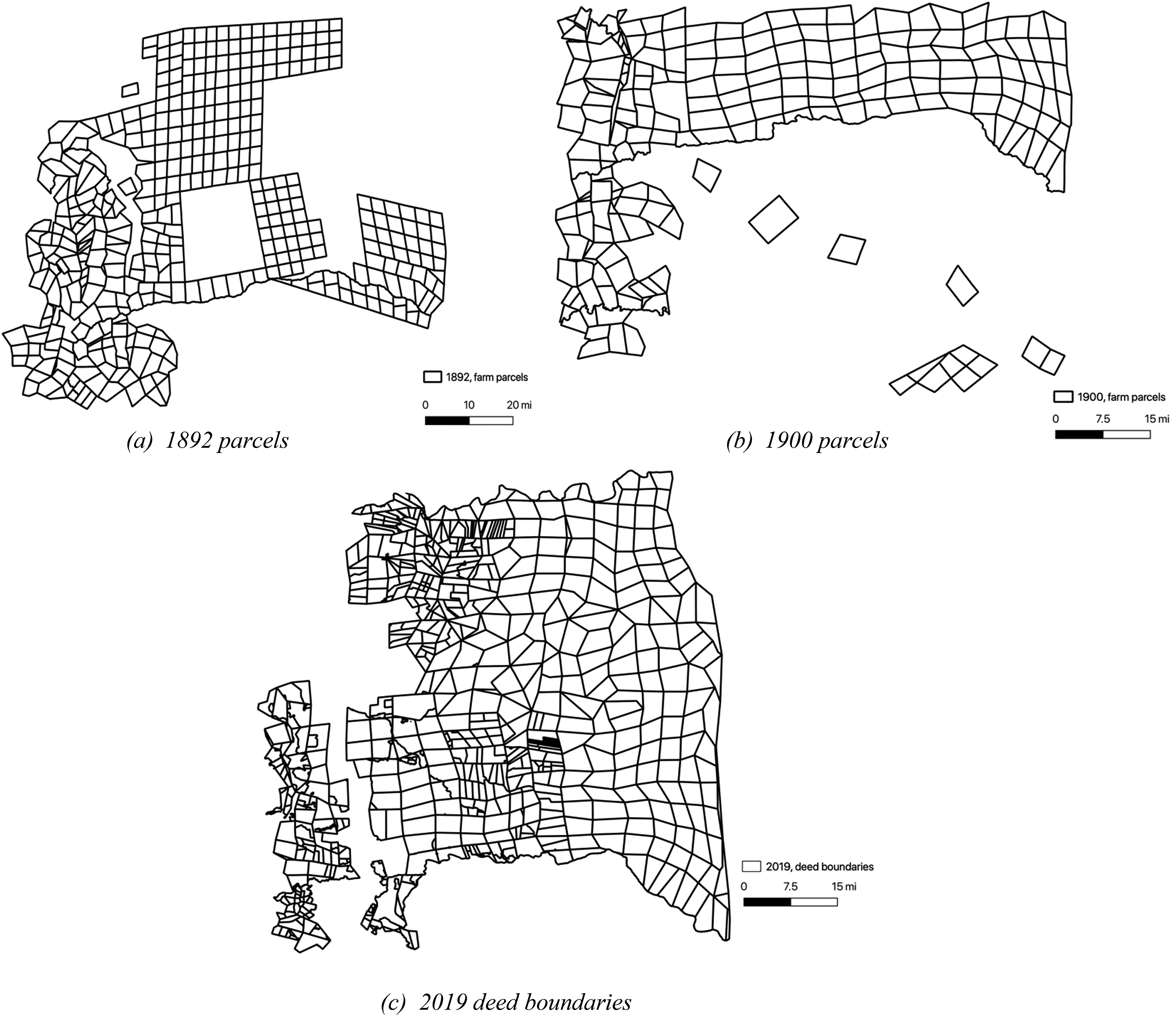
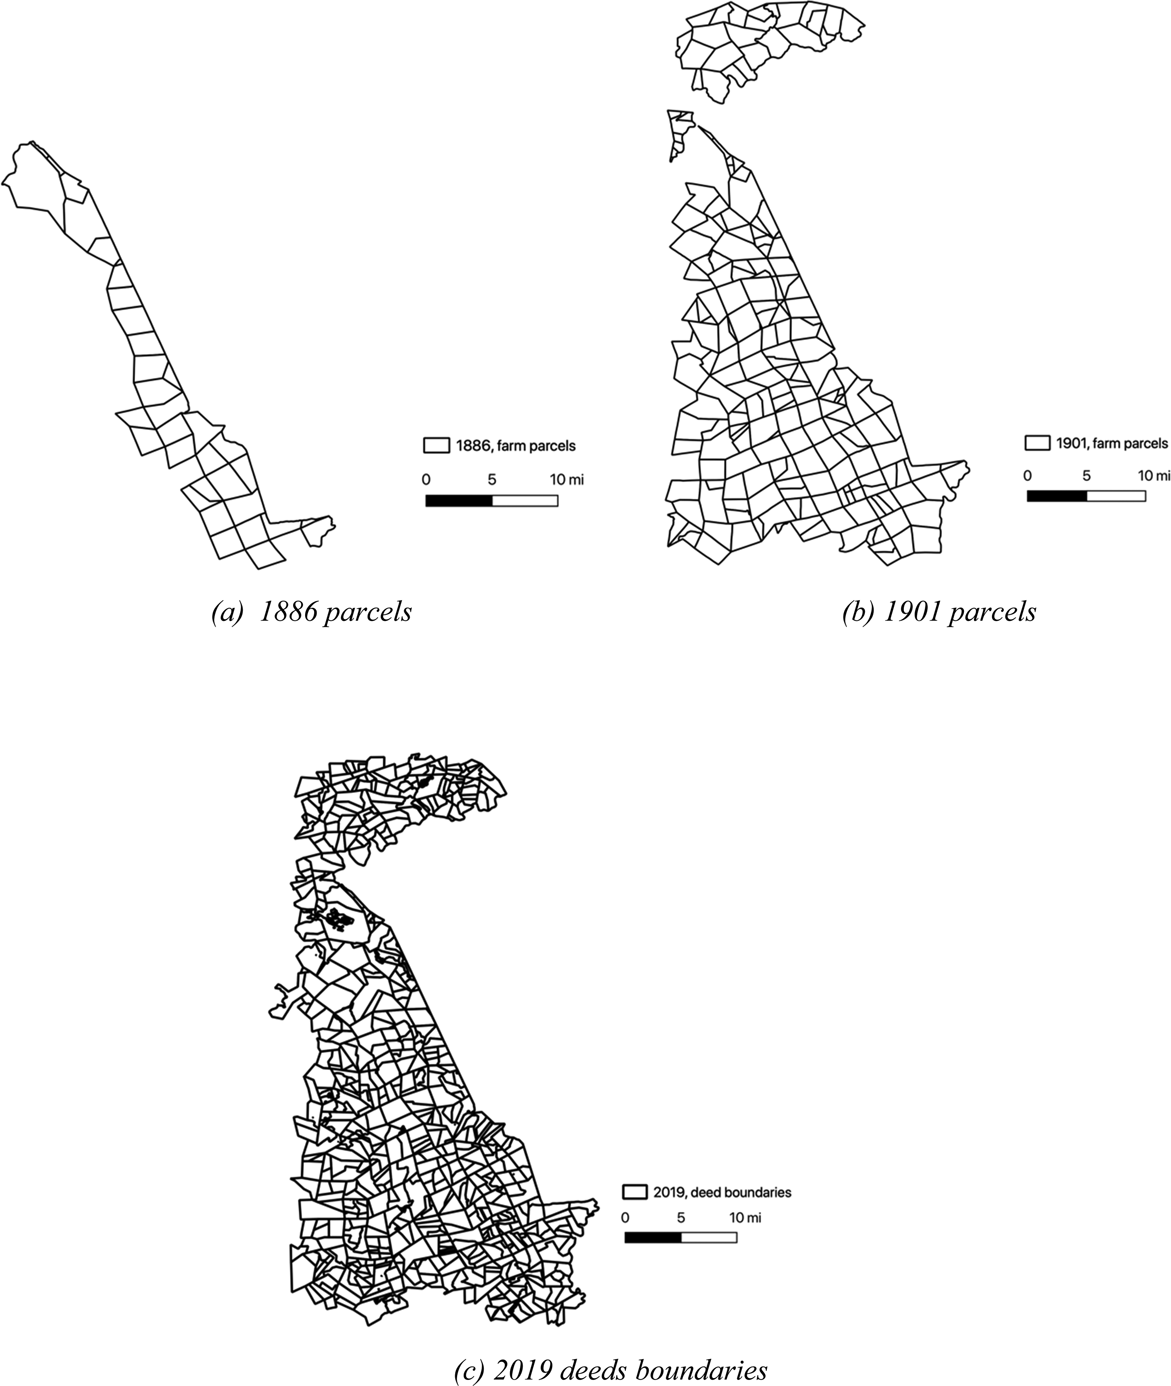
Figure 2 shows parcels from the 1892 and 1900 maps and 2019 shapefiles for Lydenburg (ZAR). Figure 3 shows parcels for Ladybrand (OFS) from the three sources. Figure A1 in the online Appendix shows parcels from Nylstroom (ZAR). There are two important points about the digitized maps. First, the number of parcels from each source is not consistent. In particular, there is a proliferation of properties in the 2019 shapefiles from subdivision of the original properties. Second, the available 1900 Imperial Map of Nylstroom and Lydenburg do not cover the exact area we digitized from Troye's 1892 map. We present results using all digitized parcels and using only parcels in areas that ‘overlap’ (see Figure A2 in the online Appendix for overlapping regions between the 1892 and 1900 maps of Lydenburg). The online Appendix describes the digitization process.
Lydenburg farm parcels in 1892, 1900, and 2019. Sources: Troye's 1892 Map of Transvaal (Lydenburg); Wood, JT, Lydenburg, Imperial Map of South Africa (1900), Military Map Collection, UCT Digital Africana Program; Farm Portion shapefiles, NGI, Chief Surveyor General Office, RSA, retrieved January 2021.

Ladybrand farm parcels in 1886, 1901, and 2019. Sources: Western Cape Archives and Records Services, M3/114; Duncan AHF, Ladybrand & Wepener and Zastron, Orange River Colony Degree Sheet Series (1901), Military Map Collection, UCT Digital Africana Program; Farm Portion shapefiles, NGI, Chief Surveyor General Office, RSA, retrieved January 2021.

5.1.1 Outcome: farm parcel shape
We construct measures of ‘boundary accuracy’ for each farm. For consistency with previous work, we used “square” in the preceding discussion in describing parcel shape. In the analysis, we technically calculate measures of parcel rectangularity. We argue that farms that are more square will be less accurate conditional on terrain. To construct measures of farm parcel squareness, we use Procrustes analysis, which compares the shape of two or more objects. The objects are ‘superimposed’ optimally, by translating, rotating, and uniformly scaling them. Both the placement in space and the size of the objects are freely adjusted in order to obtain a similar placement and size by minimizing a measure of shape difference, called the Procrustes distance, between the objects. The squared Procrustes distance between two shapes is the sum of the squared point distances (Gower, Reference Gower1975; Stegmann and Gomez, Reference Stegmann and Gomez2002). The greater the deviation from a rectangle (a lower correlation) will capture the extent to which the map included real-world features and is thus interpreted as more accurate. The measure ranges from 0 to 1 and farm parcels with a correlation equal to 1 are rectangles. We conducted the Procrustes analysis for the blocks of farms shown in Figures 2, 3 and Figure A1 in the online Appendix in MATLAB to construct a measure of rectangularity for each farm parcel. The process of the algorithm is visually shown in Figure A5 and described in an online Appendix section A4. The code is available at https://github.com/fduple/maps-procrustes.
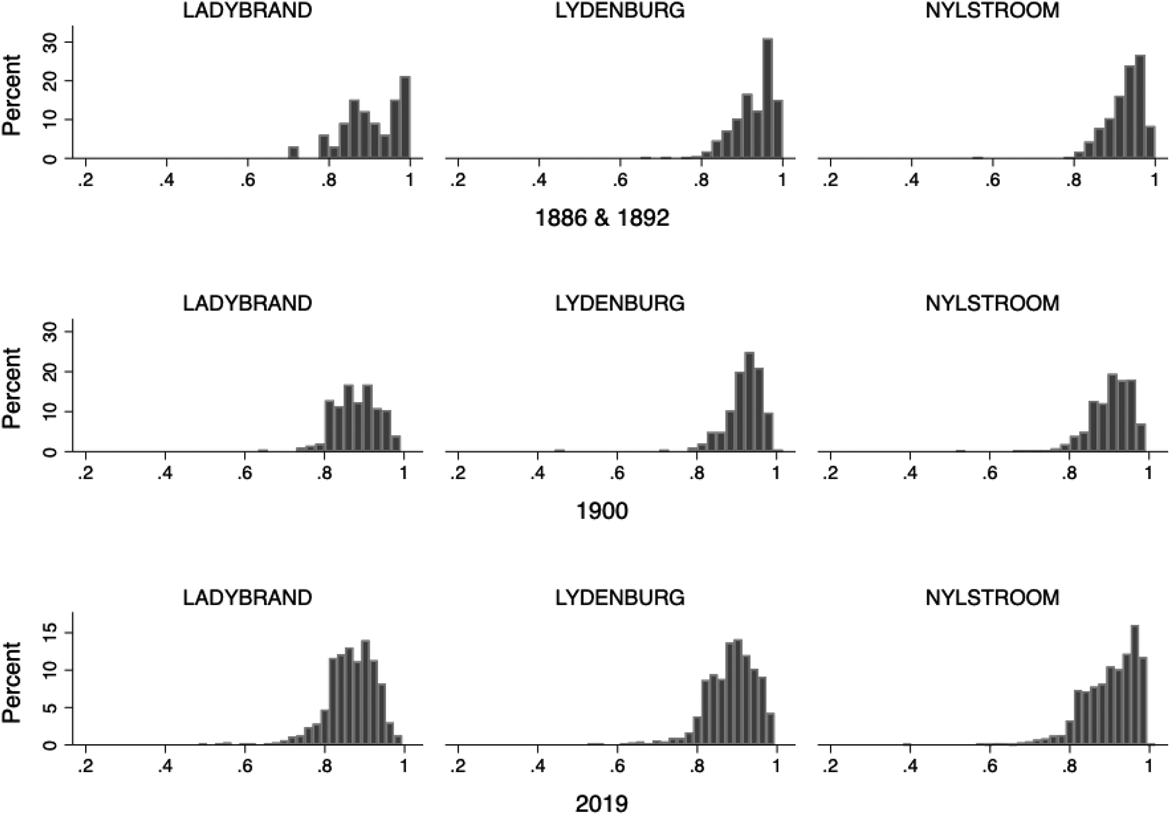
Figure 4 shows the distribution of parcel shapes for each division by map years. Farm parcels tend to be less rectangular in the 1900 military maps and the 2019 shapefiles compared to the 19th-century maps. The 19th-century maps (top row) are left skewed with a cluster of parcels close to 1, indicating most parcels are near perfect rectangles. The distributions generally become more normal with a lower median measure of accuracy in the 1900 military maps (middle row) and the 2019 shapefiles (bottom row).Footnote 27
Distributions of parcel shapes. Notes: Distribution of the farm parcel shapes across maps and regions. Shape is defined as a correlation with a perfect square. Parcels with a higher correlation (closer to 1) are more square.

5.1.2 Ruggedness
It is optimal for farm parcels to be square under an MB system if the terrain is relatively flat. To help control this issue, we use the average terrain ruggedness index (TRI) for each farm parcel. We create elevation rasters from the ASTER Global Digital Elevation Map (GDEM). The ASTER GDEM is the underlying source standard in the literature to calculate ruggedness (e.g. Nunn and Puga, Reference Nunn and Puga2012; Riley et al., Reference Riley, DeGloria and Elliot1999). We use this elevation data because it has a resolution of 30 m, which is important given the relatively small farm parcels in our analysis. The TRI is then calculated as is standard in the literature (Nunn and Puga, Reference Nunn and Puga2012; Riley et al., Reference Riley, DeGloria and Elliot1999).
5.2 Method
Using OLS, for a farm parcel i in a division d from a map year t, we estimate models of the form:

where shapeidt is a parcel's correlation with a rectangle, β i contains indicators for a map division (Ladybrand, Nylstroom, or Lydenburg), δ t contains indicators for a map yearFootnote 28, and ruggednessidt is a parcel's average TRI.
We generally expect the estimated coefficient on γ to be negative: farms in more rugged areas will have a lower correlation with a square. We are interested in comparing average parcel shape across divisions (β i). Conditional on ruggedness, we expect Nylstroom and Lydenburg to have more rectangle parcels than Ladybrand. Within the ZAR, we also expect Lydenburg to have more rectangle parcels than Nylstroom because the ZAR had less capacity to accurately survey Lydenburg as discussed above. We generally expect farm parcels to be more accurate (less rectangle on average) in the 1900 military maps and the 2019 shapefiles compared to the 19th-century maps. Because the sample of farms is not consistent across maps, we also report results restricting the analysis to farms in areas where the maps overlap.
6. Results
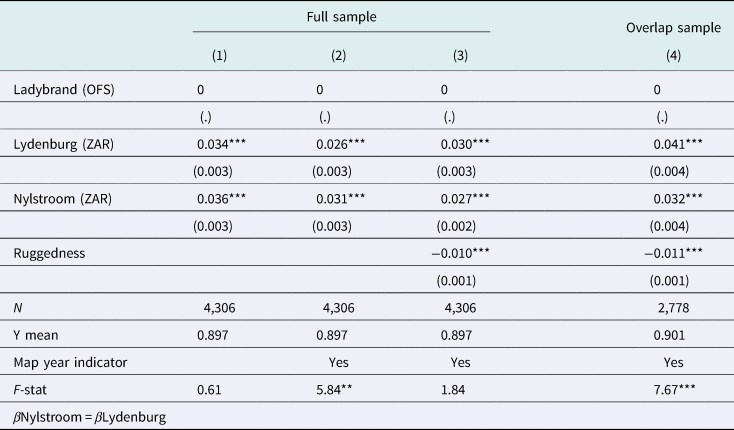
Table 1 reports the estimated coefficients of β i and γ. Column 1 includes only indicators for the map region. Ladybrand is always the omitted category. Column 2 introduces map year indicators. Column 3 introduces parcel ruggedness and column 4 restricts the analysis to only the overlap sample. The last row reports the F-statistic for the test that estimated coefficients on Lydenburg and Nylstroom are significantly different from one another.
Differences in parcel shape by region

Notes: The outcome of a farm parcel's correlation with a square. Correlations equal to 1 are parcels that are rectangles. Ruggedness is a parcel's average terrain ruggedness index (TRI). Standard errors in parentheses. ***p < 0.01, **p < 0.05, *p < 0.10.
The estimated coefficient on ruggedness (γ) is negative and significant: more rugged areas have less rectangular farms. The evidence supports the prediction that square/rectangular parcels are efficient in relatively flat areas in an MB system (Libecap et al., Reference Libecap, Lueck and O'Grady2011; Libecap and Lueck, Reference Libecap and Lueck2011). Our analysis and results add evidence that state capacity also plays a significant role in parcel shape, the construction of maps and, ultimately, the provision of de jure property rights.
Across all specifications, parcels in Lydenburg and Nylstroom are significantly more rectangular than parcels in Ladybrand. The differences hold conditional on ruggedness (column 3) as well as restricting to only parcels in areas that are generally found on both maps (column 4). There is a statistical difference between farm shapes in Lydenburg and Nylstroom, with Nylstroom having more rectangular parcels on average not controlling for ruggedness (column (2)). After controlling for ruggedness, Lydenburg has more square parcels on average though the difference is not significant (column (3)). The evidence suggests that parcels in Nylstroom may have been more tailored to the terrain. For the overlap sample, parcels in Lydenburg are significantly more rectangular than parcels in Ladybrand and in Nylstroom (column (4)). Thus, the evidence indicates that maps of parcels in the ZAR are significantly less informative about the property than those in the OFS. With the narrative evidence discussed above, the differential administrative capacity of the two states can explain this difference.
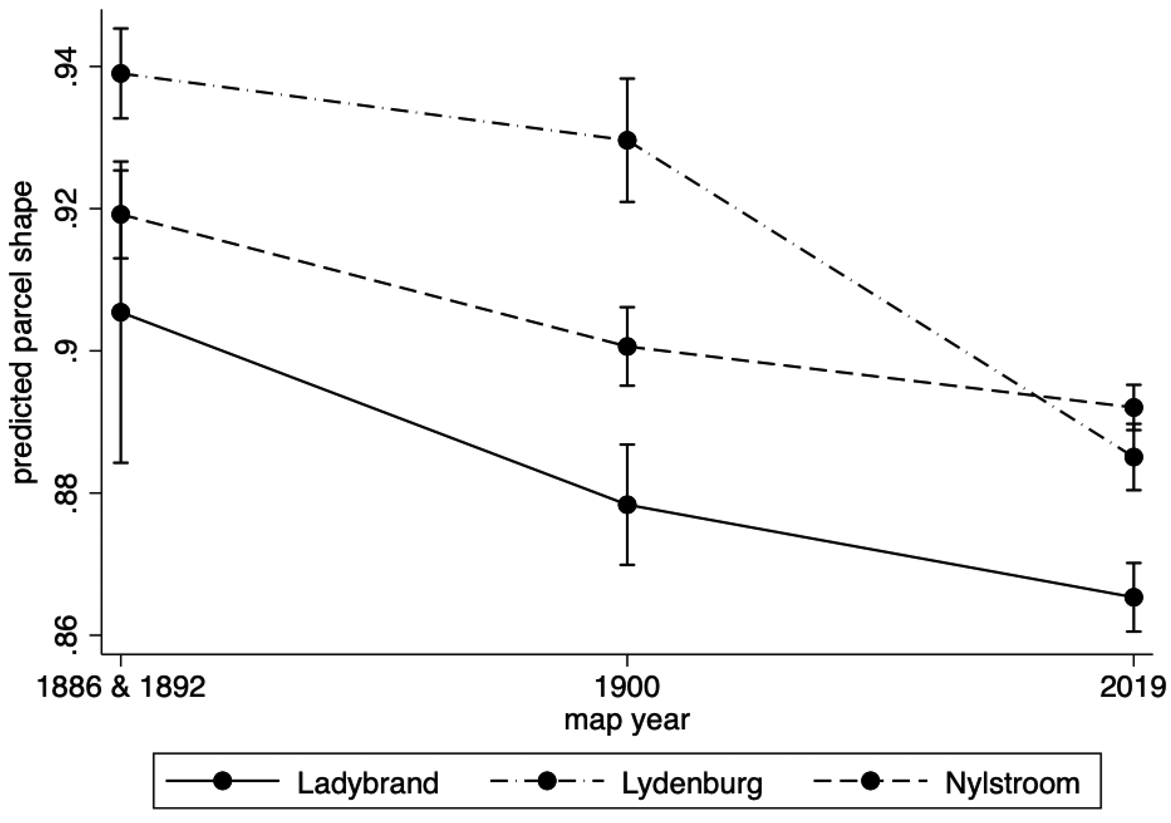
To investigate how parcel shapes are depicted under different administrations, Figure 5 and Figure A3 in the online Appendix show the predicted parcel shape for each map year across map regions. Predicted parcel shapes are obtained from an OLS regression including each parcel's TRI and interactions between indicators for map year and map region. Figure 5 shows the average predicted shape for the full sample. Figure A3 shows the average predicted shape for the overlap sample. The patterns generally support the ordering and change we hypothesized above though some of the differences are not statistically significant.
Predicted parcel shape, full sample. Notes: see text.

For the full sample (Figure 5), Lydenburg's parcels tend to be more rectangular across all maps. They tend to be less rectangular in the 1900 Imperial map and the 2019 shapefiles compared to parcels in Troye's 1892 map. The difference between 1892 and 1900 is not significant, but it is significant between 1892 and 2019 and between 1900 and 2019. Nylstroom tends to have less rectangular parcels than Lydenburg and more square parcels than Ladybrand across all maps, though the difference is not precise in the 19th-century maps and the 2019 maps. Nylstroom parcels are slightly less rectangular in the 1900 Imperial maps relative to Troye's 1892 map. Parcels in Ladybrand tend to be the least rectangular across all maps. The difference is imprecisely estimated for the 19th-century maps (1886 and 1892) likely because the 1886 Ladybrand survey only has 33 parcels. Parcels are significantly less square in the 1901 Degree Series military map and the 2019 shapefiles.
A central pattern is that the 1900 military maps show a slight decrease in average parcel squareness, which is not precisely estimated. With the historical narrative, it seems likely that this is because 1900 military maps were compilation maps using the inaccurate local inspection diagrams and farm surveys. Thus, even if the map makers had better incentives to accurately construct maps, they were limited by the inspection reports available to them. The 2019 shapefiles, which were made with modern surveying tools and methods, are the most accurate.
7. Conclusion
This paper compares the development of the specification of de jure property rights to land in two historical states, the Boer Republics of the OFS and the ZAR. We argue that the differential administrative capacity of the two can explain the provision of de jure property rights to land. We compare the states' ability to accurately survey farms after land had already been settled. Drawing on the historical narrative, we argue that the different administrations and incentives of map compilers led to less accurate maps in the ZAR compared to the OFS in 19th-century maps. We expected maps created by the British military in 1900 to be more accurate than 19th-century maps because of the military's resources, expertise, and incentives to create accurate maps. The differences, however, are not statistically significant, suggesting that the military maps compilers were constrained by the existing information available in local survey departments. Last, we find that shapefiles provided by the current, 2019 South African government, which adheres to international standards of geospatial information and uses new technologies, are the most accurate.
The analysis and results shed light on how administrative capacity facilitate or hinder the provision of de jure property rights to land for European settlers as recorded in maps. The narrative suggests it took efforts spanning 100 years from the founding of the Boer Republics to accurately survey land. According to the historical narrative, the most significant investments in this capacity came with increased demand for infrastructure. At the same time, however, it went with further dispossession and relocation of black Africans (Braun, Reference Braun2015), which we have not incorporated in our analysis. Digitization of historical maps can be used to further understand this part of the process.
Acknowledgements
We would like to thank Christie Swanepoel, Mark Hup, Johan Fourie, and Professor Martin Kidd for valuable comments and discussions. Hanu Mostert and Paige Smith provided invaluable research assistance. We are also grateful to Marieta Buys (Special Collections, Stellenbosch Library), Erika Le Roux (Western Cape Archives and Records Service), and Ilze Boonzaier and Lauren McCarthy (Centre for Geographic Analysis, Stellenbosch University) for assistance finding and accessing maps and shapefiles. All errors are our own.