Governments have intervened in food and other agricultural markets for millennia, particularly via trade policies.Footnote 1 Attempts are often made to justify the interventions on economic, social, or environmental grounds, but mostly such trade measures are welfare reducing – both in the country applying them and in the rest of the world – relative to more direct first-best policy instruments for achieving those domestic policy objectives of society (Bhagwati, Reference Bhagwati and Bhagwati1971; Corden, Reference Corden1997). Through distorting the incentives producers and consumers would otherwise face, they are also welfare redistributing and inherently discriminatory.
Those welfare-reducing and redistributing properties ensure government regulations are the focus of a great deal of attention at home and abroad. In the international arena, food-exporting countries are concerned with access to markets in food-importing countries and unfair competition in third-country markets from subsidized food exporters, while food-importing countries are concerned with foreign competition in their home market. In the domestic setting, myriad groups are concerned with the efficiency, equity, employment, environmental, poverty, etc. consequences of such measures. Both reform-focused and protectionist domestic groups, as well as foreign traders and trade negotiators, are therefore keen to understand better the reasons behind and effects of such distortions to incentives. The first step to improving that understanding involves measuring the extent of distortions to incentives faced in each country by farmers, agribusiness firms, food consumers, and traders.
Many observers thought the Uruguay Round of GATT trade negotiations, which led to the Agreement on Agriculture (URAA) in 1994, would make the task much easier via ‘tariffication’: the transforming of non-tariff barriers (NTBs) to food and other agricultural imports into tariffs (import taxes), which are inherently more transparent and simpler to negotiate (Winters, Reference Winters1987). With that came minimum market access requirements, which manifest themselves in the form of lower or zero tariffs on agreed quantities of imports (called tariff rate quotas, or TRQs), but higher (sometimes prohibitive) out-of-quota most-favored-nation (MFN) tariffs. The Uruguay Round agreements also explicitly recognized domestic producer supports and export subsidies for farm products, and quantitative restrictions or prohibitions on imports for sanitary or phytosanitary reasons. So while in principle that set of multilateral agreements was expected to add to transparency, in practice it remains very difficult to quickly identify the extent of distortions to agricultural prices and their changes over time.
An identification difficulty exists even for tariffs themselves. In tariffying, not only did countries choose to set specific (e.g., $x/kg) rather than or in addition to ad valorem (%) tariffs,Footnote 2 but most bound their out-of-quota tariffs in the World Trade Organization (WTO) at rates well above those actually being applied. The URAA also provides a special safeguard mechanism for farm products to allow import surges to be curtailed. Thus almost all WTO members retain the freedom to raise applied rates at will – in some cases by several orders of magnitude. Furthermore, most countries offer preferential tariff rates to a subset of supplying countries. Some provide that formally as TRQs, while many others do it via bilateral and regional trading agreements. Still others offer non-reciprocal preferential market access to select developing countries such as under the European Union's programs for so-called African, Caribbean, and Pacific Island (ACP) countries and for all least-developed countries (under the ‘everything but arms’ program). Typically, these discriminatory agreements have complex rules of origin that raise the cost of accessing the preferences, sometimes to prohibitive levels. Clearly, with differing in-quota and out-of-quota tariff rates for agricultural products, many of them specific or compound rather than just ad valorem, and with a wide array of preferential bilateral tariffs in place in most countries, there is no obvious single tariff rate that can serve as a measure of protection actually delivered to any particular industry. Indeed, the marginal rate is likely to vary though time as market circumstances change, even when the various set rates themselves are not changed.
The continuing importance also of agricultural non-tariff import barriers, especially in the light of the emerging food regulations discussed in Josling et al. (Reference Josling and Valdes2004), and the continuing use of agricultural production, consumption, and export subsidies and taxes, the availability of the special safeguard mechanism, and the use of occasional quantitative export restrictions and prohibitions (as used for food staples in 2008 by numerous developing countries seeking to insulate their food consumers from a major rise in food prices in international markets) mean that the only sure way to measure the actual distortions to farmer and consumer prices in any country is through careful domestic-to-international price comparisons. This is indeed what the OECD Secretariat has been doing systematically for the past two decades in generating producer support estimates and consumer subsidy equivalents (PSEs and CSEs) for the key farm products of high-income countries (OECD, 2007a, 2007c) and five non-EU developing countries (OECD, 2007b). But there has been no such similar comprehensive price-comparison exercise undertaken for developing countries. The seminal multi-country study by Krueger, Schiff, and Valdes (K/S/V) (Reference Krueger, Schiff and Valdes1988, Reference Krueger, Schiff and Valdes1991), for the period from around 1960 to 1984, was for just 15 of today's non-OECD countries plus Korea, Portugal, and Turkey. That K/S/V study had the virtue of also estimating the indirect impact on agricultural incentives of distortions to non-agricultural prices (e.g., through manufacturing tariffs or NTBs) and to the domestic prices of foreign currencies via fixed and multiple exchange rates. It found that, at least up to the mid-1980s, incentives facing farmers in developing countries typically were depressed by government policies, in contrast to the situation in most OECD countries. It is unclear how much that situation has changed over the past two decades in which many developing countries have begun to reform their agricultural and trade policies.
This suggests the need for new empirical analysis aimed at systematic estimation of overall actual delivered rates of distortion to domestic prices for agricultural and food products from policy interventions affecting both agricultural and non-agricultural markets. The core of this paper addresses the methodological issues that need to be faced when attempting to undertake such a measurement task in developing countries. This approach is being used in a new research project convened by the World Bank that is applying it in more than 40 developing countries and to Europe's transition economies that, together with the OECD countries, account for around 90% of global agricultural production, employment, and trade (see www.worldbank.org/agdistortions). The focus is on those border and domestic measures that are due exclusively to governments' actions, and as such can be altered by a political decision and have an immediate effect on consumer choices, producer resource allocation, and net farm incomes. Most commonly, these are import or export taxes, subsidies, and quantitative restrictions for farm and non-farm products, supplemented by direct domestic taxes or subsidies for farm outputs or inputs and food consumer subsidies or taxes.
The incentives faced by farmers are affected not only by direct protection or taxation of primary agricultural industries but also indirectly via policies assisting non-agricultural industries, since the latter can have an offsetting effect by drawing resources away from farming. While those non-agricultural measures may be of only minor importance in most OECD countries today, and therefore have been ignored by the OECD Secretariat in generating their PSEs and CSEs for those countries,Footnote 3 they have been too important in developing countries over the past half-century to ignore. Another difference between the OECD's methodology (see OECD, 2007c) and what is required for examining developing country policies, especially prior to the 1990s, has to do with exchange rate policies: they cannot be ignored as they have had a substantial distortionary impact on agricultural incentives in many developing countries. However, we suggest they be treated somewhat differently than in K/S/V (Reference Krueger, Schiff and Valdes1988, Reference Krueger, Schiff and Valdes1991), focusing on the differential impact across commodities of dual or multiple exchange rates rather than on overall real exchange rate misalignment. This ensures the indicators we provide for distortions to prices of individual commodities can be direct price-wedge inputs into the database of computable general equilibrium (CGE) models. Such models can then be used to estimate the effects of those distortions on such things as resource allocation, welfare, income distribution, and the real exchange rate (that is, the endogenously determined price of tradables relative to non-tradables).
The paper begins by outlining what theory suggests should be measured directly and indirectly to obtain indicators of the extent of distortions. It then outlines how that theory has been put into practice in the World Bank's current research project. To illustrate, a summary of two types of results being generated by that project are presented: one involves presenting estimates of the changing extent of distortions for one important country, namely China for the period 1981 to 2005; the other is a summary of new estimates from a global economy-wide CGE model of the effects on agricultural versus non-agricultural markets of the project's measured distortions as of 2004. The final section offers some concluding comments.
What theory suggests should be measured
The key purpose of distortion estimates of the sort being generated by the World Bank project is to provide a long annual time series of indicators showing the extent to which price incentives faced by farmers and food consumers have been distorted directly and indirectly by own-government policies in all major developing, transition and high-income countries, and hence for the world as a whole (taking international prices as given). We follow the Bhagwati (Reference Bhagwati and Bhagwati1971) and Corden (Reference Corden1997) concept of a market policy distortion as something that governments impose to create a gap between the marginal social return to a seller and the marginal social cost to a buyer in a transaction. Such a distortion creates an economic cost to society, which can be estimated using welfare measure techniques such as those pioneered by Harberger (Reference Harberger1971). As Harberger notes, this focus allows considerable simplification in evaluating the marginal costs of a set of distortions: changes in economic costs can be evaluated taking into account the changes in volumes directly affected by such distortions, ignoring all other changes in prices. In the absence of divergences such as externalities, the measure of a distortion is the gap between the price paid and the price received, irrespective of whether the level of these prices is affected by the distortion.
Other developments that change incentives facing producers and consumers can include flow-on consequences of the distortion, but these should not be confused with the direct price distortion that we aim to estimate. If, for instance, a country is large in world trade for a given commodity, imposition of an export tax may raise the price in international markets, reducing the adverse impact of the distortion on producers in the taxing country. Another flow-on consequence is the effect of trade distortions on the real exchange rate, which is the price of traded goods relative to non-traded goods. Neither of these flow-on effects are of immediate concern, however, because if the direct distortions are accurately estimated, they can be incorporated as price wedges into an appropriate country or global economy-wide computable general equilibrium (CGE) model, which in turn will be able to capture the full general equilibrium impacts (inclusive of real exchange rate effects) of the various direct distortions to producer and consumer prices.
Importantly, the total effect of distortions on the agricultural sector will depend not just on the size of the direct agricultural policy measures, but also on the magnitude of distortions generated by direct policy measures altering incentives in non-agricultural sectors. It is relative prices and hence relative rates of government assistance that affect producers' incentives. In a two-sector model an import tax has the same effect on the export sector as an export tax: the Lerner (Reference Lerner1936) Symmetry Theorem. This carries over to a model that has many sectors, and is unaffected if there is imperfect competition domestically or internationally or if some of those sectors produce only non-tradables (Vousden, Reference Vousden1990: 46–47). The Symmetry Theorem is therefore also relevant for considering distortions within the agricultural sector. In particular, if import-competing farm industries are protected, for example via import tariffs, this has similar effects on incentives to produce exportables as does an explicit tax on agricultural exports; and if both measures are in place, this is a double imposition on farm exports.
In what follows, we begin by focusing first on direct distortions to agricultural incentives, before turning to those affecting the sector indirectly via non-agricultural policies.
Direct agricultural distortions
Consider a small, open, perfectly competitive national economy with many firms producing a homogeneous farm product with just primary factors. In the absence of externalities, processing, producer-to-consumer wholesale plus retail marketing margins, exchange rate distortions, and domestic and international trading costs, that country would maximize national economic welfare by allowing both the domestic farm product price and the consumer price of that product to equal E times P, where E is the domestic currency price of foreign exchange and P is the foreign currency price of this identical product in the international market. That is, any government-imposed diversion from that equality, in the absence of any market failures or externalities, would be welfare reducing for that small economy.
Price-distorting trade measures at the national border
The most common distortion is an ad valorem tax on competing imports (usually called a tariff), t m. Such a tariff on imports is the equivalent of a production subsidy and a consumption tax both at rate t m. If that tariff on the imported primary agricultural product is the only distortion, its effect on producer incentives can be measured as the nominal rate of assistance to farm output conferred by border price support (NRA BS), which is the unit value of production at the distorted price less its value at the undistorted free market price expressed as a fraction of the undistorted priceFootnote 4

The effect of that import tariff on consumer incentives in this simple economy is to generate a consumer tax equivalent (CTE) on the agricultural product for final consumers

The effects of an import subsidy are identical to those in equations (1) and (2) for an import tax, but t m in that case would have a negative value.
Governments sometimes also intervene with an export subsidy s x (or an export tax in which case s x would be negative). If that is the only intervention

If any of these trade taxes or subsidies are specific rather than ad valorem (e.g., $y/kg rather than z percent), its ad valorem equivalent can be calculated using slight modifications of equations (1), (2), and (3).
Domestic producer and consumer price-distorting measures
Governments sometimes intervene with a direct production subsidy for farmers, s f (or production tax, in which case s f is negative, including via informal taxes in kind by local and provincial governments). In that case, if only this distortion is present, the effect on producer incentives can be measured as the nominal rate of assistance to farm output conferred by domestic price support (NRA DS), which is as above except s f replaces t m or s x, but the CTE in that case is zero. Similarly, if the government just imposes a consumption tax c c on this product (or consumption subsidy, in which case c c is negative), the CTE is as above except c c replaces t m or s x, but the NRA DS in that case is zero.
The combination of domestic measures and border price support provides the following total rate of assistance to output, NRA o, and total consumer tax equivalent, CTE


What if the exchange rate system also is distorting prices?
Should a multi-tier foreign exchange rate regime be in place, then another policy-induced price wedge exists. A simple two-tier exchange rate system creates a gap between the price received by all exporters and the price paid by all importers for foreign currency, changing both the exchange rate received by exporters and that paid by importers from the equilibrium rate E that would prevail without this distortion in the domestic market for foreign currency (Bhagwati, Reference Bhagwati1978).
Exchange rate overvaluation of the type we consider here requires controls by the government on current account transfers. A common requirement is that exporters surrender their foreign currency earnings to the central bank for exchange to local currency at a low official rate. This is equivalent to a tax on exports to the extent that the official rate is below what the exchange rate would be in a market without government intervention. That implicit tax on exporters reduces their incentive to export and hence the supply of foreign currency flowing into the country. With less foreign currency, demanders are willing to bid up the purchase price. That provides a potential rent for the government, which can be realized by auctioning off the limited supply of foreign currency extracted from exporters or creating a legal secondary market. Either mechanism will create a gap between the official and parallel rates.
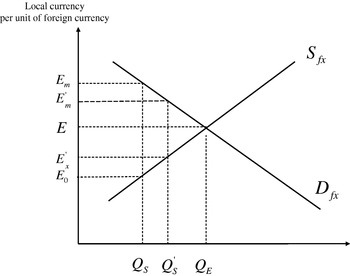
Such a dual exchange rate system is depicted in Figure 1, in which it is assumed that the overall domestic price level is fixed, perhaps by holding the money supply constant (Dervis et al., Reference Dervis, de Melo and Robinson1981). The supply of foreign exchange is given by the upward sloping schedule, S fx, and demand by D fx, where the official exchange rate facing exporters is E 0 and the secondary market rate facing importers is E m. At the low rate E 0, only Q S units of foreign currency are available domestically, instead of the equilibrium volume Q E that would result if exporters were able to exchange at the ‘equilibrium rate’ E units of local currency per unit of foreign currency.Footnote 5 The gap between the official and the secondary market exchange rates is an indication of the magnitude of the tax imposed on trade by the two-tier exchange rate: relative to the equilibrium rate E, the price of importables is raised by (E m−E=)e m×E, while the price of exportables is reduced by (E−E 0=)e x×E, where e m and e x are the fractions by which the two-tier exchange rate system raises the domestic price of the importable and lowers the domestic price of the exportable, respectively. The estimated division of the total foreign exchange distortion between an implicit export tax, e x, and an implicit import tax, e m, will depend on the estimated elasticities of supply of exports and of demand for imports.Footnote 6 If the demand and supply curves in Figure 1 have the same slope, then e m=e x and (e m+e x) are the secondary market premium or proportional rent extracted by the government or its agents.Footnote 7
The domestic market for foreign currency. Source: Martin (Reference Martin1993). See also Dervis et al. (Reference Dervis, de Melo and Robinson1981), Kiguel and O'Connell (Reference Kiguel and O'Connell1995, Reference Kiguel and O'Connell1997), and Shatc and Tarr (Reference Shatc, Tarr, Hoekman, Matoo and English2000)

If the government chooses to allocate the limited foreign currency to different groups of importers at different rates, that is called a multiple exchange rate system. Some lucky importers may even be able to purchase it at the low official rate. The more that is allocated and sold to demanders whose marginal valuation is below E m, the greater the unsatisfied excess demand at E m and hence the stronger the incentive for an illegal or ‘black’ market to form, and for less-unscrupulous exporters to lobby the government to legalize the secondary market for foreign exchange and to allow exporters to retain some fraction of their exchange rate earnings for sale in the secondary market. Providing such a right to exporters to retain and sell a portion of foreign exchange receipts increases their incentives to export, and thereby reduces the shortage of foreign exchange and hence the secondary market exchange rate (Tarr, Reference Tarr1990). In terms of Figure 1, the available supply increases from Q S to Q′S, bringing down the secondary rate from E m to E′m such that the weighted average of the official rate and E′m received by exporters is E′x (the weights being the retention rate r and (1−r)). Again, if the demand and supply curves in Figure 1 have the same slope, then the implicit export and import taxes resulting from this regime will be each equal to half the secondary market premium.
In the absence of a secondary market and with multiple rates for importers below E m, a black market often emerges. Its rate will be above E the more the government sells its foreign currency to demanders whose marginal valuation is below E m and the more active is the government in catching and punishing exporters selling in that illegal market. If the black market were allowed to operate ‘frictionlessly’, there would be no foreign currency sales to the government at the official rate and the black market rate would fall to the equilibrium rate E. So even though in the latter case the observed premium would be positive (equal to the proportion by which E is above nominal official rate E 0), there would be no distortion. For present purposes, since the black market is not likely to be completely ‘frictionless’, it can be thought of as similar to the system involving a retention scheme. In terms of Figure 1, E′m would be the black market rate for a proportion of sales and the weighted average of that and E 0 would be the exporters' return. Calculating E′x in this case (and hence being able to estimate the implicit export and import taxes associated with this regime) by using the same approach as in the case with no illegal market thus requires not only knowing E 0 and the black market premium but also guessing the proportion, r, of sales in that black market.
In short, where a country has distortions in its domestic market for foreign currency, the exchange rate relevant for calculating the NRA or CTE for a particular tradable product depends in the case of a dual exchange rate system on whether the product is an importable or an exportable, while in the case of multiple exchange rates it depends on the specific rate applying to that product each year.
What about real exchange rate changes?
A change in the real exchange rate alters equally the prices of exportables and importables relative to the prices of non-traded goods. Such a change can arise for many different reasons, including changes in the availability of capital inflows, macroeconomic policy adjustments, or changes in the terms of trade. When the economy receives a windfall – such as a greater inflow of foreign exchange from remittances or foreign aid or a commodity boom – the community moves to a higher indifference curve (Collier and Gunning, Reference Collier and Gunning1998). While net imports of traded goods can change in response to this inflow of foreign exchange, the domestic supply of and demand for non-traded goods must balance. The equilibrating mechanism is the price of non-traded goods. The price of non-traded goods rises to bring forth the needed increase in the supply of non-traded goods, and to reduce the demand for these goods to bring it into line with supply (Salter, Reference Salter1959).
While this type of change in the real exchange rate affects the incentive to produce traded goods, it is quite different from distortions in the market for foreign currency analyzed above in two respects. First, the incentives to produce importable and exportable goods are reduced to the same degree by this real exchange rate appreciation. In contrast with the multiple-tier exchange rate case, that appreciation does not generate any change in the prices of exportables relative to importables. Second, most such changes do not involve direct economic distortions of the type measurable using tools such as producer or consumer surplus. If the government, or the private sector, chooses to borrow more from abroad to increase domestic spending, this may raise the real exchange rate, but such an outcome is not obviously a distortion. Moreover, symmetric treatment of any such ‘overvaluation’ during periods of high foreign borrowing would require taking into account exchange rate ‘undervaluation’ during periods of low foreign borrowing or repayment of foreign debt. For these reasons, we do not follow K/S/V (Reference Krueger, Schiff and Valdes1988) and Orden et al. (Reference Orden, Cheng, Nguyen, Grote, Thomas, Mullen and Sun2007) in including deviations of real exchange rates from benchmark values. Rather, we only include deviations arising from direct distortions in the market for foreign currency such as via multiple exchange rate system.
What if trade costs are sufficiently high for the product to be not traded internationally?
Suppose the transport costs of trading are sufficient to make it unprofitable for a product to be traded internationally, such that the domestic price fluctuates over time within the band created by the cif import price and the fob export price. Then any trade policy measure (t m or s x) or the product-specific exchange rate distortion (e.g., e m or e x) is redundant. In that case, in the absence of other distortions, NRA 0=0, and the CTE=0. However, in the presence of any domestic producer or consumer tax or subsidy (s f or t c) the domestic prices faced by both producers and consumers will be affected. The extent of the impact depends on the price elasticities of domestic demand and supply for the non-tradable (the standard closed-economy tax incidence issue).
To give a specific example, suppose just a production tax is imposed on farmers producing a particular non-tradable, so s f<0 and t c=0. In that case
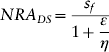
and

where ∊ is the price elasticity of supply and η is the (negative of the) price elasticity of demand.Footnote 8
What if farm production involves not just primary factors but also intermediate inputs?
Where intermediate inputs are used in farm production, any taxes or subsidies on their production, consumption, or trade would alter farm value added and thereby also affect farmer incentives. Sometimes a government will have directly offsetting measures in place, such as a domestic subsidy for fertilizer use by farmers but also a tariff on fertilizer imports. In other situations, there will be farm input subsidies but an export tax on the final product.Footnote 9 In principle all these items could be brought together to calculate an effective rate of direct assistance to farm value added (ERA). The nominal rate of direct assistance to farm output, NRA o, is a component of that, as is the sum of the nominal rates of direct assistance to all farm inputs, call it NRA i. In principle, all three rates can be positive or negative. To estimate ERAs requires knowing each product's value added share of output though. Such data are not available for most developing countries even every few years, let alone for every year in the time series. And in most developing countries distortions to farm inputs are very small compared with distortions to farm output prices, and those purchased inputs are a small fraction of the value of output. But where there are significant distortions to input costs, their ad valorem equivalent can be accounted for by summing each input's NRA times its input–output coefficient to obtain the combined NRA i, and adding that to the farm industry's nominal rate of direct assistance to farm output, NRA o, to get the total nominal rate of assistance to farm production, call it simply NRA Footnote 10

What about post-farmgate costs?
If a state trading corporation is charging excessively for its marketing services and thereby lowering the farm-gate price of a product, for example as a way of raising government revenue in place of an explicit tax, the extent of that excess should be treated as if it is a tax.
Some farm products, including some that are not internationally traded, are inputs into a processing industry that may also be subject to government interventions. In that case the effect of those interventions on the price received by farmers for the primary product also needs to be taken into account.
The mean and standard deviation of agricultural NRAs
It is helpful to generate a weighted average NRA for covered products for each country and to add the NRA for non-covered products to get the NRA for all agriculture. When it comes to averaging across countries, each polity is an observation of interest, so a simple (unweighted) average for the focus countries is meaningful for the purpose of political economy analysis. But if we want a sense of how distorted agriculture is in a whole region, a weighted average is needed. The weighted average NRA for covered primary agriculture can be generated by multiplying each primary industry's value share of production (valued at the farm-gate equivalent undistorted prices) by its corresponding NRA and adding across industries.Footnote 11 The overall sectoral rate, which we denote NRAag, can be obtained by adding also actual or assumed information for the non-covered commodities. When appropriate, the aggregate value of non-product-specific assistance to agriculture is added too.
A weighted average can be similarly generated for the tradables part of agriculture – including those industries producing products such as milk and sugar that require only light processing before they can be traded – by assuming that all non-product-specific assistance goes to producers of tradables. Call that NRAag t.
In addition to the mean, it is important to provide also a measure of the variability of the NRA estimates across the covered products. The cost of government policy distortions to incentives in terms of resource misallocation are greater the greater the degree of substitution in production (Lloyd, Reference Lloyd1974). In the case of agriculture, which involves the use of farm land that is sector-specific but transferable among farm activities, the greater the variation of NRAs across industries within the sector then the higher will be the welfare cost of those market interventions. A simple indicator of that cost is the standard deviation of industry NRAs within agriculture.
Trade bias in agricultural assistance
A trade bias index also is needed, to indicate the changing extent to which a country's policy regime has an anti-trade bias within the agricultural sector. This is important because, as mentioned in the theory section above, the Lerner (Reference Lerner1936) Symmetry Theorem demonstrates that a tariff assisting import-competing farm industries has a similar effect to a tax on agricultural exports; and if both measures are in place, this is a double imposition on farm exports. The higher is the nominal rate of assistance to import-competing agricultural production (NRAag m) relative to that for exportable farm activities (NRAag x), the more incentive producers in that sub-sector will have bid for mobile resources that would otherwise have been employed in export agriculture, other things equal.
Once each farm industry is classified either as import-competing, or a producer of exportables, or as producing a non-tradable (with its status sometimes changing over the years), it is possible to generate for each year the weighted average NRAs for the two different groups of tradable farm industries. They can then be used to generate an agricultural trade bias index defined as
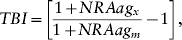
where NRAag m and NRAag x are the average NRAs for the import-competing and exportables parts of the agricultural sector (their weighted average being NRAag t). This index has a value of zero when the import-competing and export sub-sectors are equally assisted, and its lower bound approaches −1 in the most extreme case of an anti-trade policy bias.
Indirect agricultural assistance/taxation via non-agricultural distortions
In addition to direct assistance to or taxation of farmers, the Lerner (Reference Lerner1936) Symmetry Theorem further demonstrates that their incentives are also affected indirectly by government assistance to non-agricultural production in the national economy. The higher is the nominal rate of assistance to non-agricultural production (NRAnonag), the more incentive producers in other sectors will have bid up the value of mobile resources that would otherwise have been employed in agriculture, other things equal. If NRAag is below NRAnonag, we might expect there to be fewer resources in agriculture than there would be under free market conditions in the country, notwithstanding any positive direct assistance to farmers, and conversely if NARag>NRAnonag. A weighted average can be generated for the tradables part of non-agriculture too, call it NRAnonag t.
One of the most important negative effects on farmers is protection from import competition for industrialists. Tariffs are part of that, but so too – especially in past decades – are non-tariff barriers to imports. Other primary sectors (fishing, forestry, and minerals and energy raw material extraction) on average tend to be subject to less direct distortions than either agriculture or manufacturing, but there are important exceptions. One example is a ban on logging, but if such a ban is for genuine natural resource conservation reasons, it should be ignored. Another example is a resource rent tax on minerals. Unlike an export tax or quantitative restriction on exports of such raw materials (which are clearly distortive and would need to be included in the NRA for mining), a resource rent tax, like a land tax, can be fairly benign in terms of resource re-allocation (see Garnaut and Clunies-Ross, Reference Garnaut and Clunies-Ross1983) and so can be ignored.
The largest part of most economies is the services sector. It produces mostly non-tradables, many of them by the public sector. Distortions in services markets have proven to be extraordinarily difficult to measure, and no systematic estimates across countries are available even for a recent period, let alone over time. One way forward in generating time series estimates of NRAnonag is to assume all services are non-tradable and that they, along with other non-agricultural non-tradables, face no distortions. All the other non-agricultural products can be separated into exportables and import-competing products for estimating correctly their weighted average NRAs, including via multiple exchange rates, so as to generate NRAnonag t in the same way as discussed above for their the calculation of NRAag t. Ideally, production valued at border prices should be used as weights, although in practice GDP shares may have to be used as a proxy.
Assistance to agricultural relative to non-agricultural production
Given the calculation of NRAag t and NRAnonag t as above, it is then possible to calculate a relative rate of assistance, RRA, defined as

Since an NRA cannot be less than −1 if producers are to earn anything, neither can the RRA. This measure is a useful indicator for providing international comparisons over time of the extent to which a country's policy regime has an anti- or pro-agricultural bias.
Putting the theory into practice
Making the above theory operational in the real world, where data are often scarce especially over a long time period, is as much an art as a science.Footnote 12 Thankfully, we do not have to start from scratch in many countries. Nominal rates of assistance are available from as early as 1955 in some cases, and at least from the mid-1960s, to the early or mid-1980s for the 18 countries included in K/S/V (Reference Krueger, Schiff and Valdes1988, Reference Krueger, Schiff and Valdes1991) and Anderson and Hayami (Reference Anderson and Hayami1986). Much has been done to provide detailed estimates since 1986 of direct distortions to farmer (though not food processing) incentives in the high-income countries that are now members of the OECD, and (since the early or mid-1990s) in selected European transition economies and Brazil, China, and South Africa (OECD, 2007a,b). As well, at least for direct distortions, the K/S/V measures have been updated to the mid-1990s for some Latin American countries (Valdes, Reference Valdes1996) and provided also for some East European countries (Valdes, Reference Valdes2000); and a new set of estimates of simplified PSEs for a few key farm products for China, India, Indonesia, and Vietnam since 1985 are now available from IFPRI (Orden et al., Reference Orden, Cheng, Nguyen, Grote, Thomas, Mullen and Sun2007). Each of these studies uses variations on the above methodology, but the basic price data at least, as well as the narratives attached to those estimates, are invaluable springboards for the present study.
Farm product coverage
The agricultural commodity coverage includes all the major food items plus other key farm products (e.g., tree crop products, tobacco, cotton, wool), with the aim of reaching 70% of each country's value of agricultural and food production at undistorted farm-gate prices. Priority is given to the most-distorted industries, because then the residual will have not only a low weight but also a low degree of distortion.
Each product is explicitly identified as import-competing, exporting, or non-tradable. For many products, that categorization changes over time, in some cases moving monotonically through those three categories and, in others, fluctuating in and out of non-tradability. Hence an indication of a product's net trade status is given each year rather than just one categorization for the whole time series; and it is determined by what the status would be in the absence of the distortions to incentives that are being measured (Byerlee and Morris, Reference Byerlee and Morris1993). For large-area countries with high internal and coastal shipping costs, some regions within that country may be exporting abroad even while other regions are net importers from other countries. In such cases, it is necessary to estimate separate NRAs for each region and then generate a national weighted average.
Farm input coverage
The range of input subsidies considered in any particular country study will depend on the degree of distortions in that country's input markets. In addition to fertilizer, the other large ones are likely to be electric or diesel power, pesticides, and credit (including occasionally large-scale debt forgiveness, as in Brazil and Russia, although how that is spread beyond the year of forgiveness is problematic).Footnote 13 There are also distortions to water, but the task of measuring water subsidies is especially controversial and complex so they are not included in our NRA calculations (just as the OECD has ignored them in its PSE calculations). Similarly, distortions to land and labor markets are excluded, apart from qualitative discussion in the analytical narrative of some country case studies.
Price distortions due to multiple exchange rates
If there are no exchange rate distortions, the official exchange rate is used. However, when a dual exchange rate system is in place, a parallel market rate (which could be the black market rate if no legal secondary market exists) is reported along with an estimate of the proportion of foreign currency actually sold by exporters at the parallel market rate. This is the formal retention rate where an official dual exchange regime is in place, or otherwise a guesstimate of the proportion traded on the black market (premia for which are provided by Easterly, Reference Easterly2006). We can then compute an estimate for the equilibrium exchange rate for the economy, which is the rate at which international prices are converted into local currency to compute each NRA. Relevant exchange rates for importers and exporters are also then able to be computed endogenously. If they are distorted away from the official exchange rate, the relevant exchange rate for importers and exporters, respectively, are the discounted parallel market rate and the weighted average of the official exchange rate and the discounted parallel rate according to the proportion of the exporter's currency that is sold on the parallel market.
If a multiple exchange rate system is in place and that system provides for a specific rate for a product that differs from the general rates calculated as above, then that industry-specific rate should be used.
‘Guesstimates’ of NRAs for the non-covered agricultural products
In calculating the weighted average rates of assistance for the whole sector, NRAs have to be ‘guesstimated’ for the 30% or so of the value of agricultural products for which price comparisons are not calculated. The OECD in its PSE work assumes the not-measured part has the same market price support as the average of the measured part. An alternative default is to assume the rates are zero. Orden et al. (Reference Orden, Cheng, Nguyen, Grote, Thomas, Mullen and Sun2007) show that these two alternatives produce significantly different results for India, so it is preferable to make informed judgments for the import-competing, exporting, and non-tradable parts of the residual group of farm products and then calculate their weighted average (again using the value of production at undistorted prices as weights).
Non-product-specific assistance to agriculture
If there are non-product-specific forms of agricultural subsidies or taxes in addition to product-specific ones that cannot even be allocated as between importables, exportables and non-tradables, these can be included in the NRAag in the same way (as a percentage of the total value of production) as is done for these types of interventions in the calculation by the OECD (2007a) of its total support estimate.
Dollar values of farmer assistance and consumer taxation
For simplifying the presentation of results below, the NRA, CTE, and RRA are expressed as percentages rather than proportions. It is also helpful to multiply the NRA by the gross value of production at undistorted prices to obtain an estimate in current US dollars of the direct gross subsidy equivalent of assistance to farmers, and to also divide that by the number of farmers to express it as current dollars per person engaged in agriculture.
An application: the case of China, 1981 to 2005
What does the above methodology suggest has been the pattern of distortions to agricultural incentives in China following the launch of its reforms from the late 1970s? The evidence has been unclear to date, particularly because agricultural trade has been managed using a wide range of non-transparent policies including state trading, import licensing, and quotas as well as tariffs. Hence there was a need for a more thorough study, and one now has been made available by Huang et al. (Reference Huang, Liu, Martin and Rozelle2007) using the above methodology.
During the pre-reform socialist period, a key policy objective was to accelerate the rate of industrial development through direct and indirect transfers from agriculture. Another objective was to depress the prices of agricultural products to allow food to be made available at low prices to urban consumers – a pattern consistent with that observed in other low-income countries (Pinstrup-Andersen, Reference Pinstrup-Andersen1988). In combination this meant the farm sector was taxed by the prices of agricultural goods being set for both farmers and food consumers below their market values and by prices of industrial goods being set above what would have been their free-market level. That policy involved total taxation of agriculture of an estimated 26% in 1957 and 27% in 1978, primarily from direct taxation of the prices of agricultural goods (Yao, Reference Yao1994: 138).
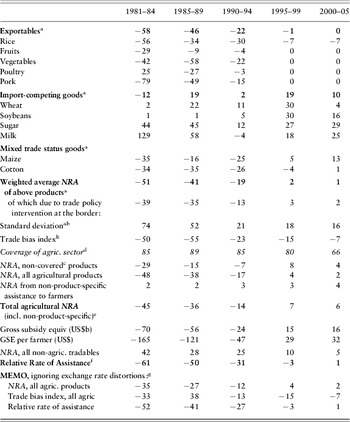
In undertaking domestic-to-border price comparisons since the reforms began in 1979, an important feature taken into account by Huang et al. (Reference Huang, Liu, Martin and Rozelle2007) is the fact that the official exchange rate had been greatly overvalued up to the mid-1990s and an active secondary or parallel market was operating. If we did not account for the dual exchange rate regime that prevailed from the early 1980s until unification of the exchange rate in 1994, price comparisons at the official exchange rate might suggest China has been protecting farmers. But using the method described above to account for distortions in the market for foreign currency (data for which are available from 1981), a quite different pattern emerges. Huang et al. provide new annual estimates of protection and taxation from 1981 to 2005 for 11 commodities: rice, wheat, maize, soybeans, cotton, pork, milk, poultry, fruit (using apples as a representative product), vegetables (using tomatoes as a representative product) and sugar (both sugar beet and sugar cane). Over their study period, these commodities accounted for between 70% and 90% of the total value of agricultural output in China. A summary of their key results is provided in Table 1.
Nominal rates and gross subsidy equivalent of assistance to agricultural industries, China, 1981 to 2005 (%)

Notes: a Nominal rates of assistance to farmers plus product-specific input subsidies weighted using the value of output at undistorted prices. Mixed trade status products included in exportable or import-competing groups depending upon their trade status in particular years.
b The standard deviation shown is the simple five-year average of the annual standard deviation around the weighted mean.
c Non-covered importables are assumed to be protected at 75% of the rate applied on covered products. Non-covered exportables are assumed to be protected or taxed at 80% of the rate applying to covered products.
d Expressed as a percentage of agricultural production valued at undistorted prices.
e Total of assistance to primary factors and intermediate inputs divided to total value of primary agricultural production at undistorted prices (%).
f The RRA is defined as 100*[(100+NRAag t)/(100+NRAnonag t)−1], where NRAag t and NRAnonag t are the percentage NRAs for the tradables parts of the agricultural and non-agricultural sectors, respectively.
g These memo items show what the average NRAag, trade bias index and RRA would be if the distortions in the market for foreign currency, as captured by the project's methodology, are ignored.
h Trade bias index is TBI=100*[(100+NRAag x)/(100+NRAag m)−1], where NRAag m and NRAag x are the average percentage NRAs for the import-competing and exportable parts of the agricultural sector.
Source: Huang et al. (Reference Huang, Liu, Martin and Rozelle2007).
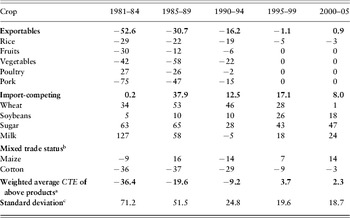
A striking feature of Table 1 is the extent to which producers were directly taxed by agricultural and trade policies in the early reform era. This was particularly the case for staple foods such as rice and maize. Taxation of rice reduced returns to farmers by over 50% relative to world price levels. Cotton prices were also strongly depressed, partly because of a desire to have low-cost inputs for the processing sector. Returns to other labor-intensive agricultural products such as vegetables and pork were depressed too, partly as a consequence of restrictions on exports. Returns to import-competing agricultural products were much less seriously depressed, and some of these products, such as sugar and milk, had quite high levels of positive protection. For these products, the goal of self-sufficiency, or at least concerns about vulnerability if grain imports reached double-digit shares of consumption, appear to have resulted in much lower levels of taxation. Assistance to agricultural exportables and to maize and cotton remained strongly negative in the late 1980s, while protection to imported commodities became slightly positive.
In the first half of the 1990s, there were very important changes, including the abolition of the system of compulsory procurement of grains. The weighted average rate of taxation fell by half in this period, to just under 20%. However, key commodities such as rice, maize, and cotton still had negative rates of assistance. In the late 1990s, the taxation of rice diminished greatly, and taxation of a range of other exportable goods disappeared as export restrictions on these goods were removed.Footnote 14 Taxation of import-oriented agriculture disappeared completely, to be replaced by significant agricultural protection. In part, this reflected the phase-out of the obligation for farmers to deliver a substantial amount of their output at below-market prices under the production quota system. Incentives for maize protection became positive in this period, with export subsidies applying in at least some years (Huang et al., Reference Huang, Rozelle, Min, Bhattasali, Li and Martin2004). Between 2000 and 2005, direct taxation of agriculture became, on average, essentially zero, with the provision of positive assistance to producers of import-competing products and even some exportable goods. As part of that reform, the anti-trade bias in farm policies fell dramatically (the trade bias index for agriculture averaged more than −0.5 in the 1980s but is now less than −0.1). The gross subsidy equivalent of farmer assistance in the first half of this decade averaged US$16 billion per year ($32 per person employed in agriculture), in contrast to an effective tax of more than $60 billion ($140 per farmer) per year in the 1980s.
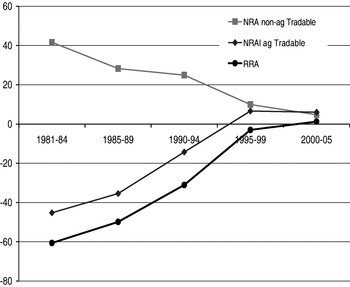
An equally important influence on the incentive environment for China's agriculture has been protection to the non-agricultural sector. Protection to non-agricultural tradable sectors imposes an implicit tax on the agricultural sector by drawing resources away from agriculture. As part of the process of WTO accession, protection rates to both agriculture and manufacturing in China were reduced substantially, and these reductions were locked in through legal tariff bindings in the WTO. The relative rate of assistance (RRA) estimates toward the bottom of Table 1, and depicted in Figure 2, provide a summary measure that combines the effects of direct and indirect incentives. From Figure 2 it is clear that the combined effect of reductions in direct taxation of agriculture and its indirect taxation through protection to other sectors outweighed the effect of reductions in assistance to protected import-competing agricultural industries in the late 1990s and early 2000s, and improved enormously the overall incentives for agricultural production in China.
Nominal rates of assistance to agricultural and non-agricultural tradables, and relative rate of assistance,a China, 1981 to 2005 (%). Notes: a The relative rate of assistance is calculated as RRA=100[(100+NRAag)/(100+NRAnonag)−1], where NRAag and NRAnonag are the nominal rates of assistance to agricultural and non-agricultural tradables, respectively. Source: Huang et al. (Reference Huang, Liu, Martin and Rozelle2007)

To see how much of the changes in the estimated NRAag, trade bias index and RRA are due to the dual exchange rate system that was in place until the early 1990s, the final three rows of Table 1 report what the estimates are if just the official exchange rate is used. In the 1980s, almost one-quarter of the NRAag, more than one-third of the (anti)trade bias index and one-sixth of the RRA were due to distortions to exchange rates in that decade. To have ignored that source of price distortion would have led to a considerable under-estimation of the adverse effect of past government policies on farmers' incentives in China.
The distortions to agricultural prices in China impacted not only on farmers but also on buyers of farm products. Even if one assumes that none of the government benefit from forcibly acquiring farm output at below-market prices was passed on to consumers (implying that the only consumer price distortion was that caused by border trade restrictions), the price of farm products to consumers was more than one-third below what it otherwise would have been in the early 1980s. That transfer fell to just under 20% by the latter 1980s and 10% in the first half of the 1990s, but since then it has disappeared and consumers are effectively taxed by 2–4% on average now when expressed at the farm-gate level. The dispersion across products is very considerable though (although much less so than in the 1980s), with consumer prices of some items such as rice always being below market levels and others such as dairy, sugar, and wheat always above market levels (Table 2).
Consumer tax equivalent of policy distortions to agricultural prices, measured at the farmgate level, China, 1981 to 2005 (%)

Notes: a Consumer tax equivalents are weighted using the value of consumption at the farmgate level, measured at undistorted prices.
b Mixed trade status products included in exportable or import-competing groups depending upon their trade status in the particular year.
c The standard deviation shown is the simple five-year average of the annual standard deviation around the weighted mean.
Source: Huang et al. (Reference Huang, Liu, Martin and Rozelle2007).
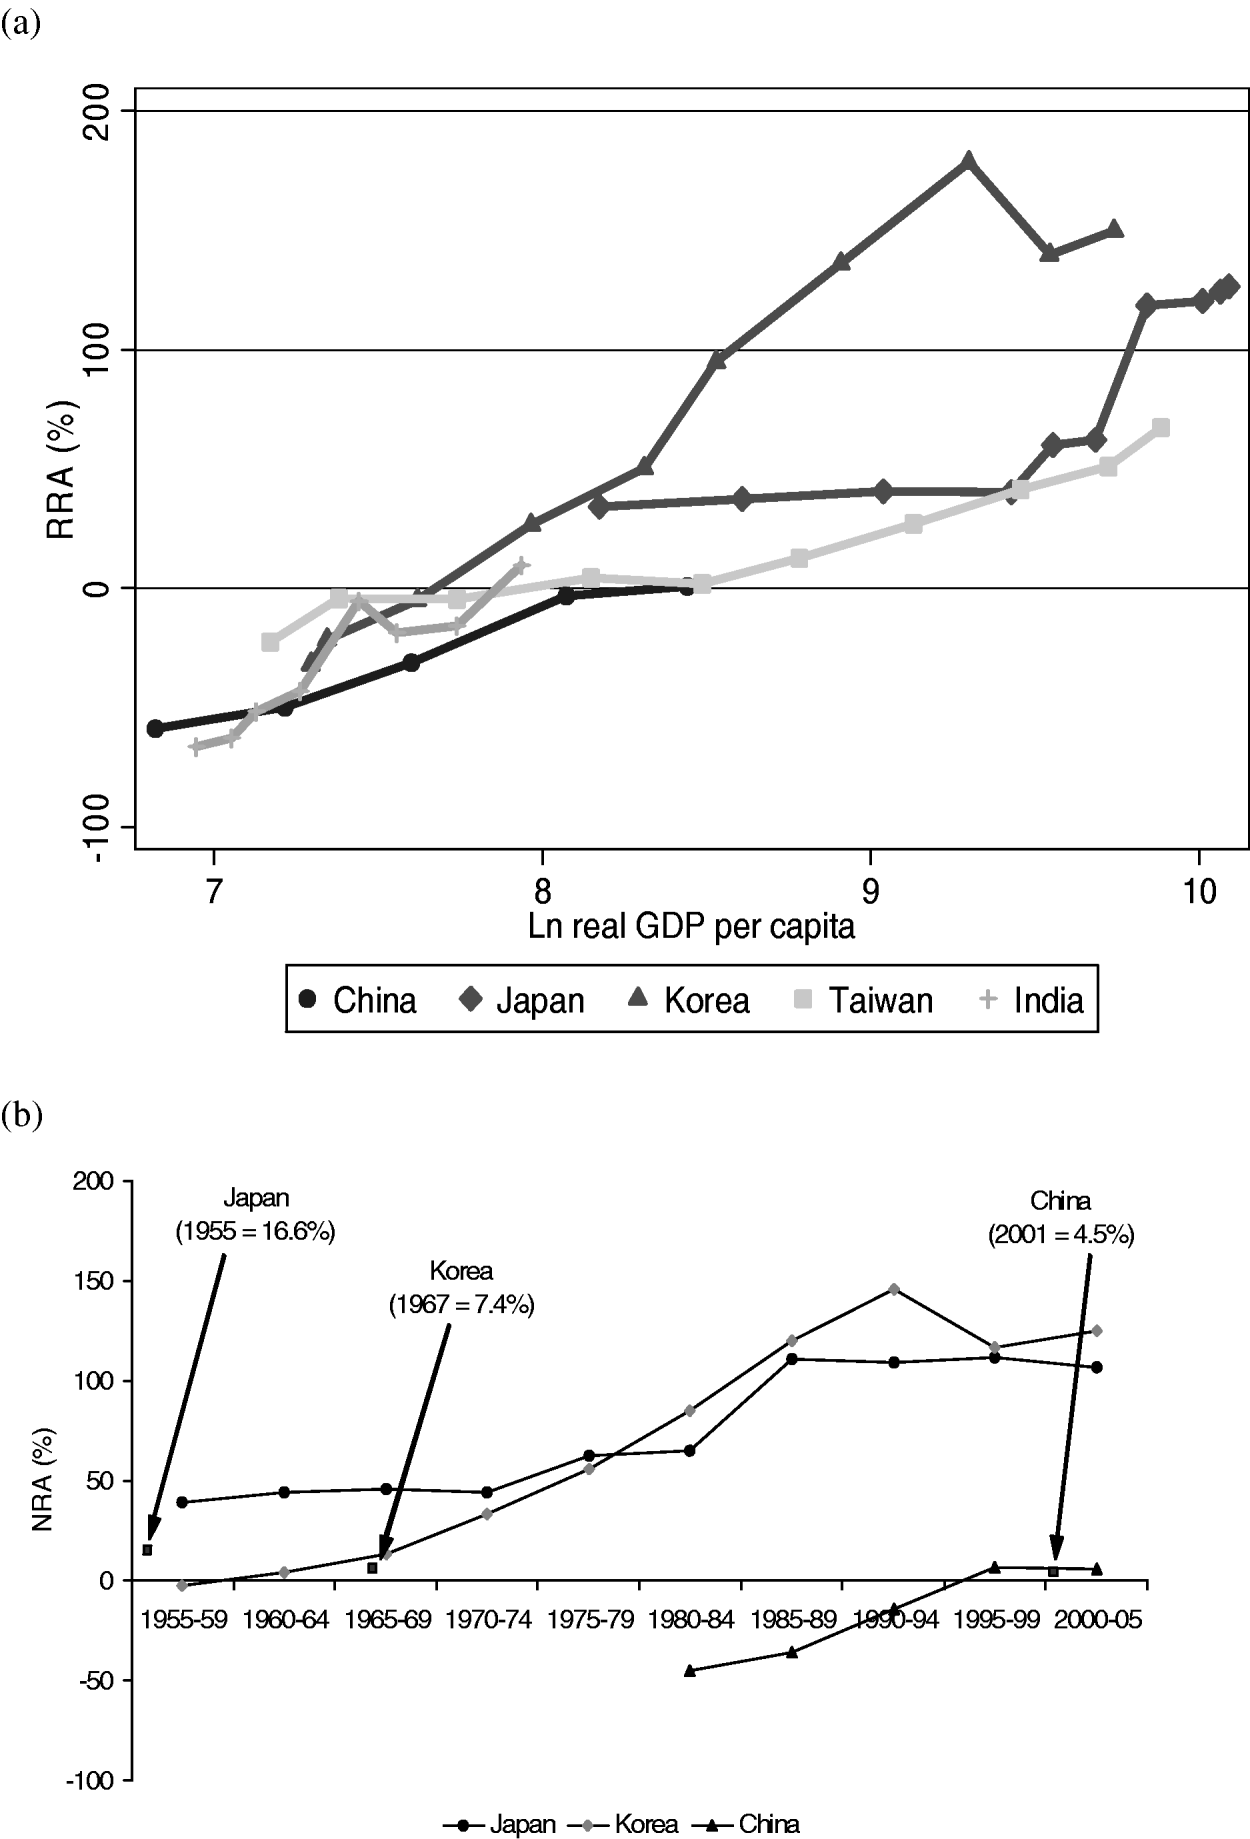
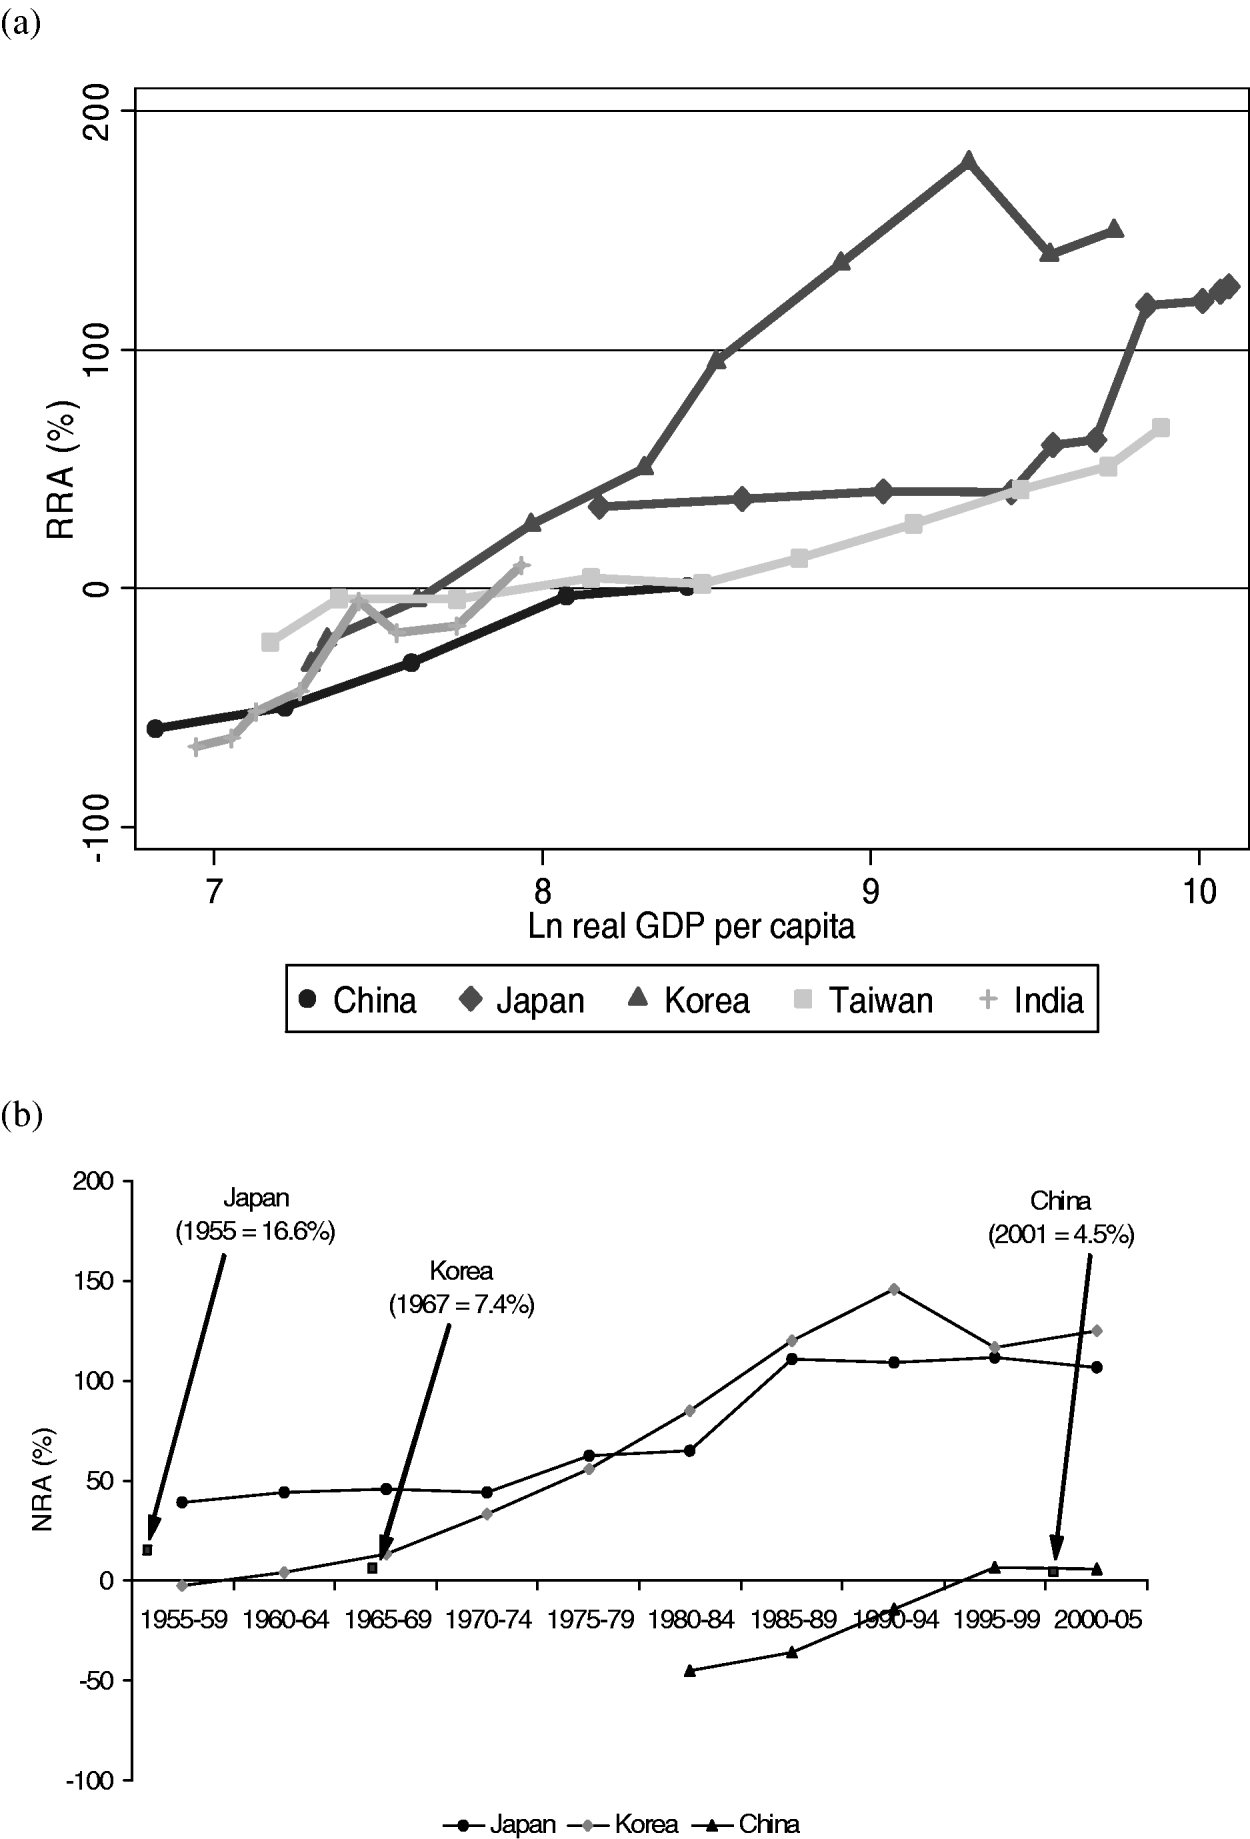
In summary, these new estimates suggest the anti-agricultural policy bias of the socialist era in China was very considerable, continued for some time in the post-reform period, was gradually reduced, and has now virtually disappeared on average. There remains some dispersion of NRAs and CTEs within the agricultural sector still, but even that has reduced considerably as part of the reform process (see the standard deviation row in Tables 1 and 2). A question for the future is: will China's RRA stay around zero or, as happened in Japan, Korea, and Taiwan (see Anderson and Hayami, Reference Anderson and Hayami1986), will China begin assisting its farmers relative to non-agricultural producers in the decades ahead?
Another application: using new price distortion measures to estimate their global effects on agricultural versus non-agricultural markets as of 2004
The above estimates of distortions to agricultural prices for China, and similar ones for other developing countries, can be used in global economy-wide computable general equilibrium (CGE) models. Most such CGE models depend on just applied tariffs supplemented by agricultural subsidies in high-income countries as measured by the OECD. These are collated and distributed as the GTAP Protection Database by the GTAP Center in Purdue University (www.gtap.org). The newly estimated average of distortions for China in 2004 is less than two-thirds the average of those in the latest version (the pre-release of Version 7.0) of the GTAP Protection Database. In particular, the production-weighted average tariff on imports of all agricultural and processed food products that year is 10.9% in the GTAP database, compared with just 6.8% based on the new estimates reported above (plus an average export subsidy for those products of 0.2%, compared with 0.0% in the GTAP database).
These new numbers based on price comparisons for China, and similar ones for other developing countries in the project, are inevitably going to generate different national and global results than those based mainly on trade-weighted average tariff rates. When used in a global CGE model they are going to provide a better indication of what impact policies are having on output, trade, and agricultural relative to non-agricultural value added than can be inferred simply from nominal and relative rates of assistance. A small sample of estimates of the effects of those price distortions, using the linkage model (see van der Mensbrugghe, Reference van der Mensbrugghe2005) of the global economy, is provided in what follows, details of which are available in Anderson et al. (Reference Anderson, Kurzweil, Martin, Sandri and Valenzuela2009).
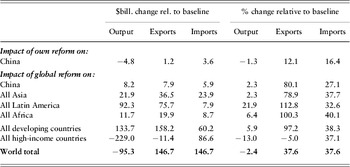
With China (like much of Asia, Africa, and Europe) having less agricultural comparative advantage than Latin America, and tending to protect its farmers more from import competition, it is not surprising that the model suggests an own-country reform that removes distortions to all goods markets causes farm output to decline in China. It would fall by US$4.8 billion per year, or 1.3%. However, China's agricultural and food exports would expand (by $1.2 billion or 12%), while its imports of those products would increase by $3.6 billion or 16% as farmers would specialize more (less) in those farm enterprises in which the country has a comparative advantage (disadvantage).
Notice from Table 3 that if all other countries were to liberalize simultaneously with China, China's farm output would expand (by 2%) rather than fall, and its exports of farm products would be four-fifths rather than just one-eighth greater. Its imports would be greater too, but by a much smaller margin (rising by 27% under global reform compared with the 16% rise under unilateral reform). That is, while China's own policies are now slightly pro-agricultural, their positive effects on farmers less than fully offset the negative effect on farmers of agricultural protectionism abroad. This finding for China is not unlike that for developing countries as a group. If all countries/regions moved to free markets for all goods, more specialization would be encouraged. For developing countries as a whole, it would result in a 6% expansion in overall farm output and an almost doubling in their combined agricultural exports. Highly protected farmers in rich countries would reduce output though, and global farm output as of 2004 would be 2.4% less, while global farm trade would be 38% larger.
Impacts of China's and global liberalization of goods markets on agricultural and food output and trade, by country/region, 2004 (relative to benchmark data, in 2004 US$ billion and %)

Source: Anderson et al. (Reference Anderson, Kurzweil, Martin, Sandri and Valenzuela2009).
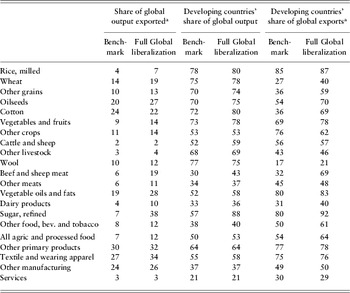
These global results suggest the current structure of goods market distortions is encouraging slightly more production of farm goods than is optimal globally, but far too many in rich countries and too few in developing countries. If those distortions were removed in all countries, the share of world agricultural and food production that is exported would nearly double, rising from 7% to 12% (while that for non-farm goods would rise only about 3 percentage points), and the developing country share of global farm exports would rise from 54% to 64% (Table 4).
Impact of full global liberalization of goods markets on shares of global output exported, and developing country shares of global output and exports,a by product, 2004 (%)

Note: a Excluding intra-EU15 trade.
Source: Anderson et al. (Reference Anderson, Kurzweil, Martin, Sandri and Valenzuela2009).
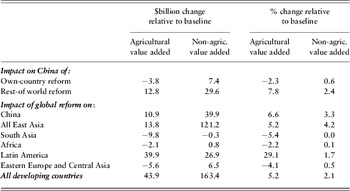
The impact on value added in agriculture versus other sectors of the economy also is generated by the linkage model. The negative of this provides a national general equilibrium counterpart to the partial equilibrium concept of the effective rate of assistance in the case of own-country reform scenarios, or its global general equilibrium counterpart in the case of a global reform scenario. Both are presented in Table 5. For China, removing distortions to its goods markets as of 2004 would reduce agricultural value added by 2.3% and raise value added in the rest of the economy by 0.6%, suggesting its own current distortions structure by 2004 was pro-agricultural. This is consistent with the NRA and RRA estimates in Table 1, but the modeling results also take into account the impact such a reform would have on China's terms of trade internationally (since China is a non-trivial player in world markets for numerous goods).
Impacts of China's and global liberalization of goods markets on agricultural and non-agricultural sectoral value added, 2004 (relative to benchmark data)

Source: Anderson et al. (Reference Anderson, Kurzweil, Martin, Sandri and Valenzuela2009).
If the rest of the world moved to free markets for all goods, on the other hand, agricultural value added in China would rise by 7.8%, while value added in the rest of its economy would rise by just 2.4%. Thus, the rest of the world's policies discriminate more against China's farmers than against its producers of non-farm goods, according to these results (row 2 of Table 5).
If all countries were to reform simultaneously, the results are similar to but not quite the same as the sum of the above, because the effects on the international terms of trade are not additive. The lower part of Table 5 provides the value added results from global liberalization. For China, value added in agriculture would increase by 6.6% or by twice the percentage for non-agricultural sectors. The change in the rest of East Asia has the same bias but to a lesser extent. This compares with a much more pro-agricultural outcome for Latin America, but contrasts with the bias in South Asia, Africa, and Eastern Europe where non-agricultural value added would grow at the expense of farmers' earnings. For developing countries as a whole, the bias of policies in 2004 was clearly against farmers, since their removal would boost net farm incomes by 5.2%, while value added in other sectors would rise by just 2.1% (final row of Table 5).
Summary and conclusion
With import tariffs on farm products continuing to provide an incomplete indication of the extent to which agricultural producer and consumer incentives are distorted in national markets (notwithstanding tariffication under the WTO's Uruguay Round Agreement on Agriculture), monitoring of government policies causing those distortions remains a complex but necessary task. And for countries that have also distorted incentives for their producers of non-agricultural tradables, those too need to be monitored if impacts of policies on net farm incomes are required (for example, as an input into the poverty and inequality impacts of those policies). The NRA and RRA measures described above, together with CTEs, provide perhaps the simplest way to estimate the extent to which agricultural and trade policies distort farmer and consumer incentives. And where an economy-wide CGE model is available, those NRAs and CTEs can be inserted in its database to estimate the effects of those price distortions on markets, income distribution and the like as well. Without NRAag and CTE estimates based on price comparisons, however such CGE models are likely to rely just on import-weighted tariffs and thereby to generate misleading estimates of the effects of government interventions in goods markets.
One further point about the use of NRA and CTE estimates in CGE modeling is worth making by way of conclusion. CGE models are used to estimate the consequences not just of recent policies but also of possible changes in policies. In the case of China, they were used widely to assess the likely consequences of the commitments China made as part of its accession to WTO (one of many examples being by Ianchovichina and Martin, Reference Ianchovichina, Martin, Bhattasali, Li and Martin2004). Such studies compare a projected reform scenario with a base case that typically assumes the current policy regime will continue into the future. In the case of agricultural policies, however, history reveals that countries tend to transform from taxing to assisting farmers relative to producers of other tradables as their economy develops. The extent of that transformation is particularly strong in densely populated countries as their comparative disadvantage in agriculture intensifies, as revealed in the World Bank project's new estimates of NRAs for key Asian economies (Figure 3(a)). One might therefore anticipate that, in the absence of outside influences such as WTO accession, China might eventually follow the agricultural protectionist path of earlier-industrializing Japan and Korea. In that case, estimating the net present value of its legally bound commitments to reduce farm tariffs and subsidies as part of WTO accession arguably requires comparing that scenario with a base scenario involving a rising counterfactual NRA for agricultural products rather than simply assuming that the low level of recent years would prevail indefinitely. Imagine how much greater would have been the estimated benefits of signing on to the GATT had agricultural reform commitments been required at the time Japan joined in 1955 and Korea in 1967, in the light of the growth as revealed in Figure 3(b) of their agricultural NRAs since then.
Relative and nominal rates of assistance to agriculture, China and other Asian countries, 1955 to 2005. (a) Relative rates of assistance (RRA, %), (b) Nominal rates of assistance to farmers (NRA, %). Source: Anderson (Reference Anderson2009), drawing on estimates in Anderson and Valenzuela (Reference Anderson, Valenzuela and Anderson2009)