Implications
This study compared the metabolic adaptations to lactation in dairy cattle under the organic and conventional farming systems. Our results show that the prevalence of subclinical ketosis was higher in organic animals; however, after calving, these animals showed better insulin sensitivity, a lower degree of inflammation, less liver injury as well as an absence of macromineral deficiencies. Therefore, the management of nutrition after calving on organic farms is vital to prevent the undesirable consequences of subclinical ketosis, as other treatments commonly used in conventional farms are forbidden by the European legislation on organic farming.
Introduction
The number of certified organic bovine animals not destined for meat production in the European Union has shown a 15-fold increase since 2003 (Eurostat, 2014). Organic production is an integrative farming system that aims to deliver improved food quality through enhanced animal welfare, seeking better immunity and resistance to disease through the provision of appropriate nutrition (Padel et al., Reference Padel, Schmid and Lund2004). Organically managed cattle (OMC) are fed a forage-based diet (minimum of 60%), as imposed by European legislation (European Commission, 2008); there are some concerns about this restriction, as a reduction in the proportion of concentrates in the diet of OMC may reduce the cows’ ability to consume enough energy to meet the requirements of milk production (Harðarson, Reference Harðarson2002; Roesch et al., Reference Roesch, Doherr and Blum2005). The genetic background for milk production is similar between OMC and conventionally (intensively) managed cattle (CMC), so a potential lack of energy after calving could increase the risk of negative energy balance (NEB) in these animals. In fact, some studies have already reported greater NEB in OMC (Hardeng and Edge, Reference Hardeng and Edge2001; Roesch et al., Reference Roesch, Doherr and Blum2005), although this point was not supported by Fall et al. (Reference Fall, Gröhn, Forslund, Essen-Gustafsson, Niskanen and Emanuelson2008). However, subclinical ketosis has been frequently encountered in OMC (Hayton, Reference Hayton2012) and dairy cows under grazing production systems (Garro et al., Reference Garro, Mian and Cobos Roldan2013).
The metabolic, endocrine and inflammatory changes associated with the transition from gestation to lactation have been extensively studied in CMC. However, few experimental data are available comparing OMC with CMC in the scientific literature (Rosati and Aumaitre, Reference Rosati and Aumaitre2004). As milk yield is usually lower in OMC (Hamilton et al., Reference Hamilton, Forslund, Hansson, Emanuelson and Ekman2002; Fall and Emanuelson, Reference Fall and Emanuelson2009), it can be hypothesised that some differences may exist in the adaptation to the onset of lactation in OMC. Therefore, the aim of this observational study was to compare changes associated with the periparturient period between these two management types under field conditions. Several serum parameters that reflect the energetic status (glucose, non-esterified fatty acids (NEFA), β-hydroxybutyrate (BHB)), protein metabolism (total serum proteins (TSP), albumin, globulins, albumin : globulins ratio, creatinine, urea), the macromineral status (calcium, phosphorus and magnesium) and the liver activity (activity of aspartate aminotransferase (AST) and ɣ-glutamyl transpeptidase (GGT)) were selected. In addition, serum insulin and surrogate indices of peripheral insulin sensitivity were calculated, because of the key role of this hormone in the orchestrated changes in nutrient partitioning associated with the onset of lactation; along with the quantification of two acute phase proteins, in order to indicate the inflammatory status of the animals.
Material and methods
All the experiments followed the Spanish standards for the protection of animals used for experimental and other scientific purposes, and all animal use was previously approved by the Bioethical Committee of the University of Santiago de Compostela.
Animals and samplings
This study is part of a larger research project (Galician Government ref. 10MRU261004PR). Data from the CMC animals come from the article by Abuelo et al. (Reference Abuelo, Hernandez, Benedito and Castillo2013), involved in the aforementioned project. The information regarding the diets of the animals is given in Supplementary Table S1.
Serum samples were taken from multiparous dairy cows every 2 or 3 weeks, for CMC and OMC, respectively; from 2 months prior the expected calving date until the peak of lactation (expected at 75 days for CMC and 90 for OMC). Samples from healthy periparturient cattle were obtained simultaneously from one conventional farm (n=22) and two organic farms (n=40; 20 animals each) located nearby (maximum distance=40 km), with similar conditions in feeding delivery and presentation and calvings all the year round. The three farms had free-stall barns with enough number of headlocks for all the animals to feed together. The CMC farm (average 305 days normalised milk production of 10.235 kg/cow) and one of the OMC (6589 kg/cow) had only Holstein–Friesian cows, while at the other OMC farm (6148 kg/cow) a mixture of Holstein–Friesian (n=12) and Brown–Swiss (n=8) was used. Samplings of these animals were grouped ex post into the four physiological stages suggested by Van Saun (Reference Van Saun2009): (i) far-off dry (FOD): from 60 to 30 days before calving, (ii) close-up dry (CUD): from 29 days to 3 days before calving, (iii) fresh (FRH): 3 to 30 days in milk, and (iv) peak of lactation (PkL): from 31 to 90 days in milk. Animals in the three farms were dried-off 60 days before the expected calving date.
Animals between the 4th and 5th month of pregnancy were also sampled at each farm to establish a control group per management type (n=40 for CMC, n=30 for OMC - 15 animals per farm). These animals have the lower metabolic burdens available for lactating cattle (Castillo et al., Reference Castillo, Hernández, Bravo, López-Alonso, Pereira and Benedito2005), are ‘homeostatically stable’, and as they are far from the NEB nadir (Jorritsma et al., Reference Jorritsma, Wensing, Kruip, Vos and Noordhuizen2003), they can provide a baseline value for comparison. Sampling of these animals took place simultaneously with sampling from periparturient cattle to minimise any possible temporal effect.
Analytical determinations
Metabolic profiles
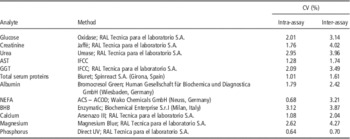
Glucose, NEFA, BHB, TSP, albumin, creatinine, urea, calcium, phosphorus and magnesium were quantified in the serum samples, as well as the AST and GGT activities. The globulin concentration was estimated by subtracting the albumin from the TSP, and the albumin : globulins ratio was calculated. All determinations were performed using photometric commercial kits, summarised in Table 1, on a biochemistry autoanalyser (CST-240, DIRUI Industrial Co., Ltd, Changchun, China) calibrated against a multipoint calibrator (Biocal; RAL Tecnica para el laboratorio S.A., Barcelona, Spain). Physiological and pathological control sera (Gernorm and Gerpath, respectively; RAL Tecnica para el laboratorio S.A.) were analysed alongside the samples to provide two-point quality control.
Analytical determinations
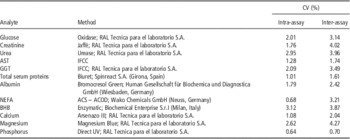
AST=aspartate aminotransferase; IFCC=International Federation of Clinical Chemistry and Laboratory Medicine; GGT=ɣ-glutamyl transpeptidase; NEFA=non-esterified fatty acids; ACS=acyl-CoA synthetase; ACOD=acyl-CoA oxidase; BHB=β-hydroxybutyrate.
A cow was considered to have subclinical ketosis when she showed either a NEFA level above 0.3 mmol/l at the last sampling before calving (15 to 3 or 21 to 3 days before calving for CMC and OMC, respectively), or a NEFA or BHB concentration at the first sampling after calving (between 3 and 15 or 3 and 21 DIM for CMC and OMC, respectively) above 0.7 mmol/l and 1.2 mmol/l, respectively, using the cut-off points most commonly employed in the literature (McArt et al., Reference McArt, Nydam, Oetzel, Overton and Ospina2013).
Insulin sensitivity
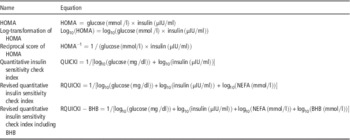
The serum concentration of insulin was assessed by means of a commercial ELISA kit (Insulin Bovine ELISA; Mercodia AB, Uppsala, Sweden) with a detection limit of 0.025 μg/l; the intra- and inter-assay CV were 4.9% and 7.2%, respectively. Samples were run in duplicate. Surrogate indices of insulin sensitivity were calculated, as shown in Table 2. The conversion of bovine insulin from units of the International System to International Units, for the purpose of surrogate indices calculation, was performed according to Abuelo et al. (Reference Abuelo, De Koster, Hernandez, Opsomer, Grufman and Castillo2012).
Calculation of different surrogate indices to assess insulin sensitivity
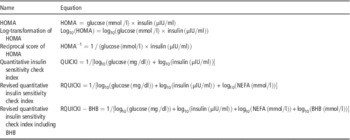
HOMA=homeostatic model assessment; QUICKI=quantitative insulin sensitivity check index; RQUICKI=revised quantitative insulin sensitivity check index; BHB=β-hydroxybutyrate.
Inflammatory response
Haptoglobin (Hp) and serum amyloid A (SAA) were determined as positive acute phase proteins. A commercial photometric colorimetric kit was employed for assessing Hp (Phase Haptoglobin Assay; Tridelta Development Ltd, Maynooth, Ireland), with intra- and inter-assay CVs of 5.9% and 6.3%, respectively. The SAA concentration was determined using a commercial ELISA kit (Phase SAA Assay; Tridelta Development Ltd), for which the intra- and inter-assay CVs were 5.2% and 9.8% respectively. The detection limits were 2.5 mg/ml and 0.3 µg/ml for Hp and SAA, respectively. All samples were analysed in duplicate.
Statistical analysis
All statistical procedures were performed with IBM SPSS for Windows v.21, and the criterion for statistical significance was established at P<0.05. Generalised linear mixed models with repeated measurements were built for each of the studied parameters as the outcome variable. The periparturient cow was the experimental unit; the physiological stage – PhS – (FOD, CUD, FRH or PkL), the management type – MT – (OMC or CMC), their interaction – PhS×MT – and the breed of the animal were the fixed effects. The variance-covariance structure between ‘time’ was assumed to have a first-order autoregressive correlation. Post hoc analyses were performed with the LSD test. Milk yield was considered an intervening variable and was therefore left out of the models.
The Mann–Whitney U-test was used (i) to compare control groups between each management type; and (ii) to compare, within the same management type, each of the stages of the periparturient period with the control group. The prevalences of subclinical ketosis were compared with the Fisher’s exact test.
Results
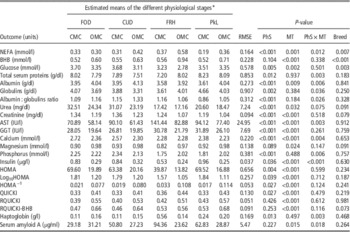
Table 3 shows the significance of the main effects on the different variables considered in the generalised linear mixed models; as well as the estimated means of the studied analytes according to the physiological stage and the management type.
Estimated means and significance of the main effects from the generalised linear mixed models of blood analytes and surrogate indices of insulin sensitivity

FOD=far-off dry (60 to 30 days before calving); CUD=close-up dry (29 to 3 days before calving); FRH=fresh (3 to 30 days in milk); PkL=peak of lactation (31 to 90 days in milk); CMC=conventionally managed cattle; OMC=organically managed cattle; RMSE=root mean square error; PhS=physiological stage; MT=management type; NEFA=non-esterified fatty acids; BHB=β-hydroxybutyrate; AST=aspartate aminotransferase; GGT=ɣ-glutamyl transpeptidase; HOMA=homeostatic model assessment; QUICKI=quantitative insulin sensitivity check index; RQUICKI=revised quantitative insulin sensitivity check index.
Generalised linear mixed models with repeated measurements were built for the blood variables as outcomes with the PhS, MT, their interaction (PhS×MT) and the breed of the animal as fixed effects.
* Estimated means calculated for the least significant difference.
Metabolic profile
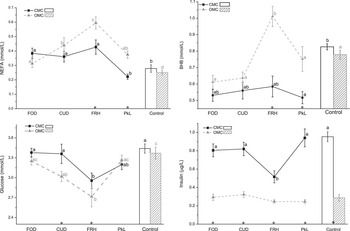
A significant effect of PhS, MT and PhS×MT was found on NEFA, with higher concentrations in OMC in the FRH and PkL stages (Figure 1). In both management types, the concentration of NEFA in the dry period (FOD and CUD) was higher than their respective control groups. On the other hand, BHB was influenced by the management type, with a higher concentration in OMC after calving (FRH and PkL) (Figure 1), but not by PhS, or PhS×MT. The periparturient stage and the MT showed an effect on glycaemia; where although the concentration of glucose achieved the lowest levels in both management types right after calving, with lower values for OMC, this decrease took place more progressively in OMC (Figure 1). The breed of the animal showed also a significant effect on the concentration of NEFA, BHB and glucose, with lower glucose and higher NEFA and BHB values (P<0.05) for the animals of the Holstein breed.
Mean values (±s.e.) of the concentration of non-esterified fatty acids (NEFA), β-hydroxybutyrate (BHB), glucose and insulin at the studied stages. Stages with a significant difference (P<0.05) between management systems are denoted with an asterisk (*). a,bValues with different superscripts differ significantly at P<0.05. CMC=conventionally managed cattle; OMC=organically managed cattle; FOD=far-off dry (60 to 30 days before calving); CUD=close-up dry (29 to 3 days before calving); FRH=fresh (3 to 30 days in milk); PkL=peak of lactation (31 to 90 days in milk). Control=animals between the 4th-5th month of pregnancy.

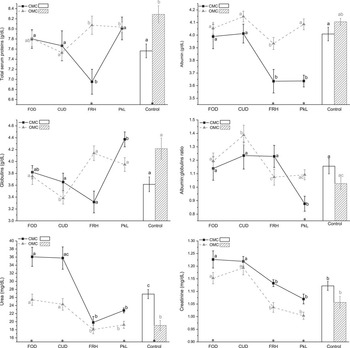
An effect of PhS and the PhS×MT was found on TSP, with a decrease in the concentration at FRH for CMC, reaching values lower than OMC at the same stage (Figure 2). Also, between the control groups, the concentration of TSP was lower in CMC; although during the dry period, periparturient OMC also showed lower levels than the control group for this system. The mixed model also revealed significant effects of PhS, MT and PhS×MT on albumin concentrations. For both management types, the concentration of albumin during FRH and PkL was lower than in any of the stages of the dry period. However, the mean values shown by CMC were lower than those of OMC (Figure 2). Globulins were influenced by the PhS and the PhS×MT. The concentration of this analyte was lower in CMC during FRH compared with the other periparturient stages or to the control group (Figure 2). Likewise, the albumin : globulins ratio was also affected by the PhS and the PhS×MT in the mixed model, where OMC showed lower levels in the lactating stages than at CUD, whereas in CMC only the mean value at PkL was lower than the control group (Figure 2). Both urea and creatinine were affected by the PhS and the MT, but not by their interaction. With the exception of FRH, at all of the studied stages, CMC had higher urea concentrations than OMC, with the serum concentration of this variable decreasing after calving (FRH and PkL) (Figure 2). Likewise, the creatinine concentration was also lower during the lactating stages compared with the dry period (Figure 2).
Mean values (±s.e.) of the concentration of total serum proteins, albumin, globulins, albumin : globulins ratio, urea and creatinine at the studied stages. Stages with a significant difference (P<0.05) between management systems are denoted with an asterisk (*). a,bValues with different superscripts differ significantly at P<0.05. CMC=conventionally managed cattle; OMC=organically managed cattle; FOD=far-off dry (60 to 30 days before calving); CUD=close-up dry (29 to 3 days before calving); FRH=fresh (3 to 30 days in milk); PkL=peak of lactation (31 to 90 days in milk); Control=animals between the 4th-5th month of pregnancy.

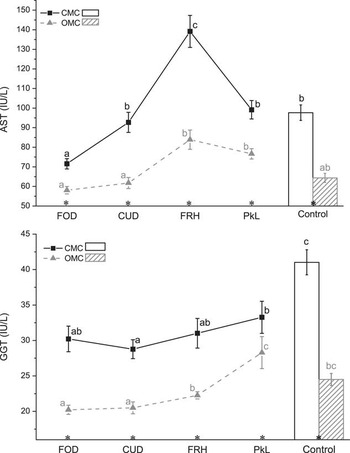
AST and GGT were affected by PhS and MT, whereas PhS×MT only affected AST. These serum enzyme activities were higher for CMC at all the studied stages and the control group. AST showed an increase after calving in both farming systems (Figure 3), while GGT activity in CMC remained stable throughout the periparturient period, with lower values than in the control group. However, in OMC, it increased significantly at the PkL stage, and the values of the lactating stages were similar to those obtained from the control animals (Figure 3).
Mean values (±s.e.) of the serum activity of the enzymes aspartate aminotransferase (AST) and ɣ-glutamyl transpeptidase (GGT) at the studied stages. Stages with a significant difference (P<0.05) between management systems are denoted with an asterisk (*). a,bValues with different superscripts differ significantly at P<0.05. CMC=conventionally managed cattle; OMC=organically managed cattle; FOD=far-off dry (60 to 30 days before calving); CUD=close-up dry (29 to 3 days before calving); FRH=fresh (3 to 30 days in milk); PkL=peak of lactation (31 to 90 days in milk); Control=animals between the 4th-5th month of pregnancy.

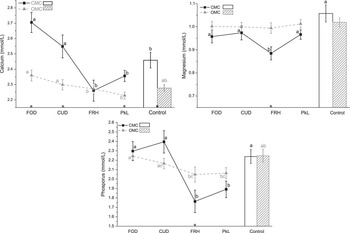
Calcium was the only of the studied minerals that was affected by PhS, MT and the PhS×MT, whereas no significant effect was found on magnesium (Figure 4) and phosphorus was affected by PhS and the PhS×MT, but not by MT. A significant drop in calcaemia was observed at the FRH stage in CMC, which was absent in OMC; although the concentration of calcium at this stage was similar between the two farming systems, CMC showed higher values at the other stages (Figure 4). Likewise, a drop in phosphorus was observed at the FRH stage only in CMC, with the concentration at FRH and PkL being significantly lower than during the dry period and the control group. However, in OMC, this mineral’s concentration remained stable throughout the transition period, although the values at FRH and PkL were also lower compared with the control group (Figure 4).
Mean values (±s.e.) of the serum concentrations of calcium, magnesium and phosphorus at the studied stages. Stages with a significant difference (P<0.05) between management systems are denoted with an asterisk (*). a,bValues with different superscripts differ significantly at P<0.05. CMC=conventionally managed cattle; OMC=Organically managed cattle; FOD=far-off dry (60 to 30 days before calving); CUD=close-up dry (29 to 3 days before calving); FRH=fresh (3 to 30 days in milk); PkL=peak of lactation (31 to 90 days in milk); Control=animals between the 4th-5th month of pregnancy.

Insulin sensitivity
PhS, MT and PhS×MT had a significant effect on the insulin concentration. The serum concentration of this hormone in OMC, despite being always lower than CMC, remained stable through the periparturient period, with similar values than those obtained from the control group. Conversely, CMC showed a drop in the insulin concentration right after calving, recovering the precalving concentration at PkL (Figure 1).
Regarding the surrogate indices of insulin sensitivity, PhS and MT had a significant effect on HOMA, its logarithmic transformation (log10HOMA) and reciprocal score (HOMA−1), and QUICKI. HOMA and log10HOMA were always higher in CMC than OMC, and a significant decrease was found at the FRH stage for CMC. On the other hand, HOMA−1 and QUICKI were always higher in OMC, and an increase of both was found at the FRH stage in CMC, while remaining stable for OMC. RQUICKI and RQUICKI-BHB were only significantly affected by the MT, with higher values for OMC at all of the studied stages.
Inflammatory response
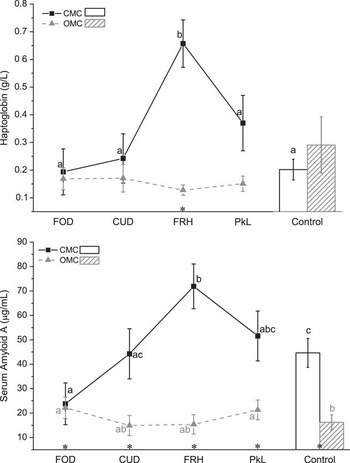
The PhS×MT interaction had a significant effect on the two positive acute phase proteins studied here, Hp and SAA. Hp was also affected by the PhS and SAA by the MT. In CMC, a transient rise in Hp was found at the FRH stage, while for OMC the values remained stable (Figure 5). The SAA concentration was similar between the two farming systems at FOD. However, in subsequent stages, the concentrations shown by CMC were higher than OMC, also achieving the highest values at the FRH stage (Figure 5).
Mean values (±s.e.) of the serum concentrations of the acute phase proteins haptoglobin and serum amyloid A at the studied stages. Stages with a significant difference (P<0.05) between management systems are denoted with an asterisk (*). a,bValues with different superscripts differ significantly at P<0.05. CMC=conventionally managed cattle; OMC=organically managed cattle; FOD=far-off dry (60 to 30 days before calving); CUD=close-up dry (29 to 3 days before calving); FRH=fresh (3 to 30 days in milk); PkL=peak of lactation (31 to 90 days in milk); Control=animals between the 4th-5th month of pregnancy.

Discussion
The NEFA concentration reflects the amount of adipose tissue breakdown taking place, while BHB is an indicator of the integrity of fat oxidation in the liver. Therefore, these analytes have been extensively used in the field as indicators of the energy balance and thereby as predictors of periparturient disease problems (McArt et al., Reference McArt, Nydam, Oetzel, Overton and Ospina2013, Ospina et al., Reference Ospina, McArt, Overton, Stokol and Nydam2013). The levels of both NEFA and BHB were significantly higher in OMC after calving compared with their CMC counterparts. However, mobilisation of fat reserves is a common feature following calving, and if the concentration of NEFA is limited to concentrations that can be fully metabolised for energy needs, there is no association with disease incidence (Sordillo and Raphael, Reference Sordillo and Raphael2013). Using group means for the evaluation of energy balance misrepresents the degree of NEB of the herd, and therefore the percentage of at-risk animals with serum concentrations of these parameters above established thresholds is a better practice to assess the real prevalence of excessive NEB in the herd (Ospina et al., Reference Ospina, McArt, Overton, Stokol and Nydam2013). The farm under conventional management showed a subclinical ketosis prevalence of 13.64% (3 out of 22 animals); being significantly lower (P=0.02) than in the OMC farms (45.0% (9/20) and 35.0% (7/20), respectively). This demonstrates that the prevalence of subclinical ketosis is above the alarm level (Ospina et al., Reference Ospina, McArt, Overton, Stokol and Nydam2013) in OMC, and although it could be only attributed to a possible effect of the farms themselves, previous studies have reported greater NEB in OMC (Hardeng and Edge, Reference Hardeng and Edge2001, Roesch et al., Reference Roesch, Doherr and Blum2005), and subclinical ketosis is frequently observed on organic dairy farms (Rutherford et al., Reference Rutherford, Langford, Jack, Sherwood, Lawrence and Haskell2009, Hayton, Reference Hayton2012).
Moreover, although glucose itself is not a good indicator of the energy balance due to its tight homeostatic control (Herdt, Reference Herdt2000), alongside NEFA and BHB, it provides further insights into the adaptation to NEB. As the prevalence of subclinical ketosis was higher in OMC, and glycaemia was lower after calving, the importance of adequate control of nutrition management in dry and fresh cows in OMC to prevent type I ketosis should be emphasised. In addition, the differences found between breeds, pointing towards a greater NEB in Holstein animals, might be a reflection of their higher genetic potential for milk yield, which increases their nutrient requirements; and it is one of the main reasons why the breeding programmes for CMC and OMC had to diverge (Harðarson, Reference Harðarson2002).
The activities of AST and GGT are discussed together as they are usually used to assess liver function (Van Saun, Reference Van Saun2009). Both enzymes were influenced by the physiological state of the animal and the management type, with CMC showing higher serum activities, especially after calving. This implies that the livers of OMC were exposed to a lower degree of injury throughout the transition period, although they had mobilised more fat deposits than CMC (as shown by the higher concentration of NEFA and BHB); the accumulation of triglycerides within the liver is associated with impaired function of the organ and an increase in the serum activity of these enzymes (Sejersen et al., Reference Sejersen, Sørensen, Larsen, Bendixen and Ingvartsen2012). Therefore, it seems that the fat mobilised by OMC was metabolised by the liver without excessive accumulation, indicating good adaptation to the onset of lactation.
The decrease in TSP right after calving in CMC was a consequence of the drop in the concentration of albumin, which might be associated with the greater hepatic damage shown at this stage, the use of albumin to support higher milk yield (Heinrichs et al., Reference Heinrichs, Jones and Bailey1997), and the greater inflammatory response observed (discussed at the end of this section). Albumin is considered a negative acute phase protein. In accordance with Piccione et al. (Reference Piccione, Messina, Alberghina, Giannetto, Casella and Assenza2011), the albumin : globulins ratio decreased throughout lactation in CMC as a consequence of the decrease in albumin and the increase in globulins. However, this pattern was not as pronounced in OMC, presumably due to a lower milk yield.
As creatinine remained within the reference values throughout the study, no impact of renal function on serum urea was expected and, thus, the urea levels in serum reflect the ammonia concentration in the rumen and the protein content in the diet. Uraemia was higher in CMC at all the studied stages, with the exception of FRH. Therefore, these results suggest that OMC were not suffering any disturbance in their protein metabolism during the periparturient period. Conversely, CMC were in a worse situation in this regard, due to an increased dietary concentration of CP in CMC, shown by a serum urea concentration >20 mg/dl in lactating animals, which could be detrimental for the reproductive performance of the animals (Russell and Roussel, Reference Russell and Roussel2007).
Although calcaemia was influenced by the management type, fresh cows showed similar levels between the two farming systems; it is at this stage where milk fever usually occurs. This disease has been reported to have a greater incidence in OMC (Hayton, Reference Hayton2012), but in this study, the degree of calcaemia right after calving was similar; which is in agreement with the study of Hardeng and Edge (Reference Hardeng and Edge2001), where the organic farming system was not a higher risk for milk fever. However, neither the sampling protocol used in this study, nor the one used in the study of Hardeng and Edge (Reference Hardeng and Edge2001) was conceived for the detection of subclinical hypocalcaemia, as the first 48 h after calving were not included and therefore new studies are needed for further clarification. Magnesium and phosphorus serum concentrations are sensitive to dietary intake (Herdt et al., Reference Herdt, Rumbeiha and Braselton2000), so at a glance, the presence of differences in the concentrations of these minerals between the two systems could be possible. However, in this study these two minerals were similar between the two management systems, with the drop of phosphorus after calving in CMC being a consequence of the increase of the animal’s requirements for this mineral for energy and lactation. In addition, the mean values of all the studied stages were well above the levels of concern pointed out by Van Saun (Reference Van Saun2009), further indicating that OMC are not at a higher risk of macromineral deficiency.
The significantly higher concentration of insulin in CMC might be a consequence of the also higher percentage of starch (31.2% v. 14.9% and 16.2%) in the diet (Gong et al., Reference Gong, Lee, Garnsworthy and Webb2002, Oba and Allen, Reference Oba and Allen2003). Insulin remained stable during the periparturient period in OMC, whereas in CMC a decrease was observed after calving. This decrease in the insulin concentration is a common feature in dairy cattle, aiming to redirect blood glucose towards the mammary gland; however, this depends upon the milk yield (De Koster and Opsomer, Reference De Koster and Opsomer2013). This decrease in insulin concentrations is in accordance with the study by Fall et al. (Reference Fall, Gröhn, Forslund, Essen-Gustafsson, Niskanen and Emanuelson2008), where under Swedish conditions, CMC even showed lower insulin activity than OMC in the first 4 days after calving. With regard to the responsiveness of tissues to insulin, surrogate indices of insulin sensitivity were used, although they are not the best methods available for this purpose. However, the hyperinsulinaemic/euglycaemic clamp test is a very time consuming and invasive procedure which is not suitable for use under field conditions or on a larger scale in epidemiological investigations (Muniyappa et al., Reference Muniyappa, Lee, Chen and Quon2008). The different indices provide similar but not identical results, so that more than one index should be used (Muniyappa et al., Reference Muniyappa, Lee, Chen and Quon2008). Some of these indices have already been applied in studies on dairy cows (Holtenius and Holtenius, Reference Holtenius and Holtenius2007; Balogh et al., Reference Balogh, Szepes, Kovacs, Kulcsar, Reiczigel, Alcazar, Keresztes, Febel, Bartyik, Fekete, Fesus and Huszenicza2008; Kerestes et al., Reference Kerestes, Faigl, Kulcsár, Balogh, Földi, Fébel, Chilliard and Huszenicza2009) and, in addition, some studies reported similar changes in the values for QUICKI, RQUICKI, RQUICKI-BHB and parameters of glucose tolerance tests (Balogh et al., Reference Balogh, Szepes, Kovacs, Kulcsar, Reiczigel, Alcazar, Keresztes, Febel, Bartyik, Fekete, Fesus and Huszenicza2008; Bossaert et al., Reference Bossaert, Leroy, De Campeneere, De Vliegher and Opsomer2009). However, as a consequence of the differences in glucose metabolism between dry and lactating cattle, due to the processes involved in nutrition partitioning for milk production, these indices should not be used for comparisons throughout the periparturient period and therefore are only used here for comparisons between the two management systems at the same stage.
High HOMA levels, and therefore also high log10(HOMA) and low HOMA−1 levels, reflect an increase in the levels of glucose, insulin or both, suggesting in humans a lower peripheral tissue insulin sensitivity. Conversely, high QUICKI, RQUICKI and RQUICKI-BHB values reflect lower concentrations of glucose, insulin and NEFA and BHB, when applicable, and hence suggest higher insulin responsiveness. Therefore, our results suggest that OMC show a greater responsiveness to insulin after calving, probably due to lower milk production, which prevents the animals reared under this management system from suffering diseases related to augmented insulin resistance.
Our results show that CMC had a greater inflammatory response after calving, with a remarkable increase in the levels of Hp and SAA in the FRH stage, while the concentration of these acute phase proteins remained stable throughout the periparturient period in OMC. Odhiambo et al. (Reference Odhiambo, Farooq, Iqbal, Mansmann, Zebeli, Dunn and Ametaj2013) also compared the concentration of Hp between OMC and CMC, reaching similar results, although they attributed these differences to the different composition of the diets. Notwithstanding, recent research has revealed that a certain degree of inflammation is not only a common feature after calving, but is adaptive rather than pathological, since some level of inflammation is actually required or beneficial to milk production and for successful transition period adaptation (Farney et al., Reference Farney, Mamedova, Coetzee, KuKanich, Sordillo, Stoakes, Minton, Hollis and Bradford2013; Yuan et al., Reference Yuan, Farney, Mamedova, Sordillo and Bradford2013). Therefore, it is understandable that the differences in the patterns of these inflammatory mediators between the two management systems could be attributable to both the adaptation to a higher milk production and the differences in the composition of the diets of CMC and OMC; although this point merits further research before it can be fully elucidated.
Conclusions
Under the conditions of this study, which reflects the common management practices of OMC and CMC in northwestern Spain, it was concluded that although organically managed dairy cattle showed a higher prevalence of subclinical ketosis, they experienced a smoother transition from gestation to lactation, without evidence of liver injury or a higher risk of suffering macromineral deficiencies. Therefore, more attention should be paid to the diet of close-up dry and fresh OMC to prevent NEB, as most of the practices commonly used in CMC for the treatment of this condition are forbidden in this farming system.
Acknowledgements
This study was supported by the Galician Government (Xunta de Galicia) under grants 10MRU261004PR and CN2012/327. The funding source played no role in the design of the study, collection, analysis and interpretation of data, or preparation or approval of the manuscript. The authors gratefully thank Lucía Casanova Iglesias for her technical assistance, José Antonio Fernández and Juan Antonio Moraña for their help during sampling, and the owners of the farms for allowing us to perform the study and for their patience.
A. Abuelo holds a FPU fellowship (Ref. AP2010-0013) from the Spanish Ministry of Education, Culture and Sports.