Introduction
The retreat and advance of glacier fronts has probably been used as a measure of climatic variations as long as humans have lived close to glaciated environments. The first recorded scientific studies were made two centuries ago with the emergence of the naturalist scholars. A systematic analysis of the annual mass budget of a glacier was made by Ahlmann (1927). Since then, glacier mass balance has been widely monitored (Haeberli and others, 1994). Statistical relations between mass balance and meteorological parameters have been investigated on several glaciers (Letréguilly, 1988; Pelto, 1988), and the physical relation by Holmgren (1971), Kuhn (1979) and Braithwaite (1995) among others.
Mass-balance variations can be associated with atmospheric circulation, thereby linking them to larger-scale atmospheric changes rather than just single meteorological parameters, Hoinkes (1968) used this method to show how glacier variations in Switzerland were linked to cyclonic and anticyclonic conditions. Alt (1978, 1987) found that synoptic analogues for extreme years of mass balance at the Queen Elizabeth Island ice caps, Canada, were more or less determined by the position of the Arctic Front. Yarnal (1984) found that two glaciers in southwestern Canada were differently sensitive to small-scale and large-scale synoptic patterns. Voloshina (1988) discussed how the position of the Siberian high creates an inverse relationship between the mass balances of glaciers in northern Scandinavia and the northern Urals. Walters and Meier (1989) showed that the strength of the Aleutian low plays an important role in determining the storm track and high mass balances in the Alaskan Range and the Cascade Range. McCabe and Fountain (1995) found that the winter balance of South Cascade Glacier correlated to the pressure difference between the Gulf of Alaska and the west coast of Canada.
Clearly these works show the potential of the relation between glacier mass balance and prevailing synoptic configurations. This relation is very important to understand when using historical mass-balance data from either glacier frontal variations or ice-core records in order to reconstruct atmospheric circulation of the past. One shortcoming of this method is that most glaciers have, from a statistical point of view, very short time series. The longest continuous mass-balance record, from Storglaciären, northern Scandinavia, is 50 years. We use the winter and summer balance data from Storglaciären to find the synoptic controls of the mass balance of this glacier.
Glaciological And Meteorological Data
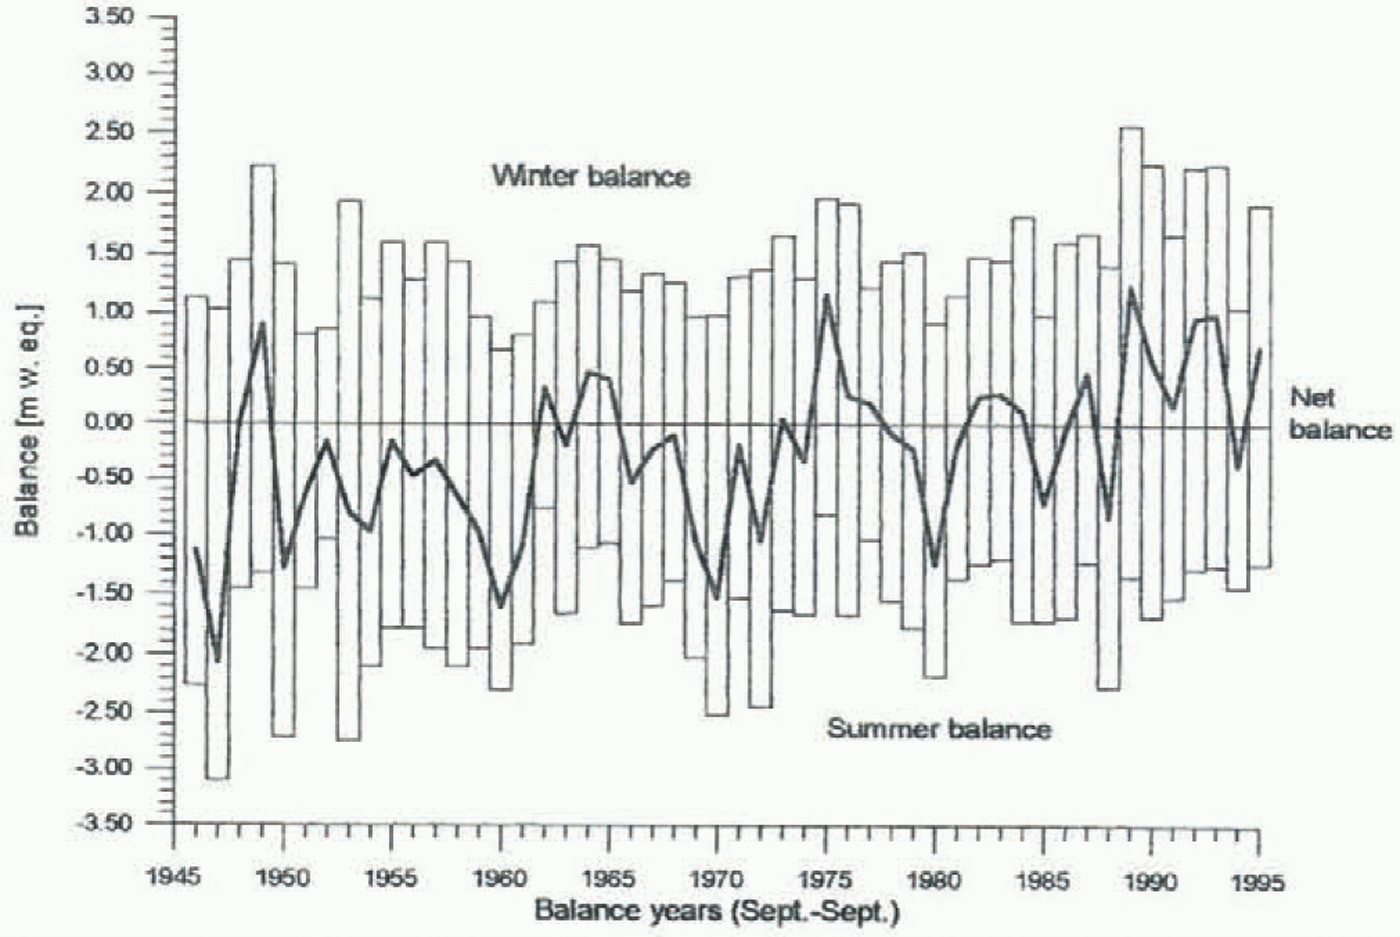
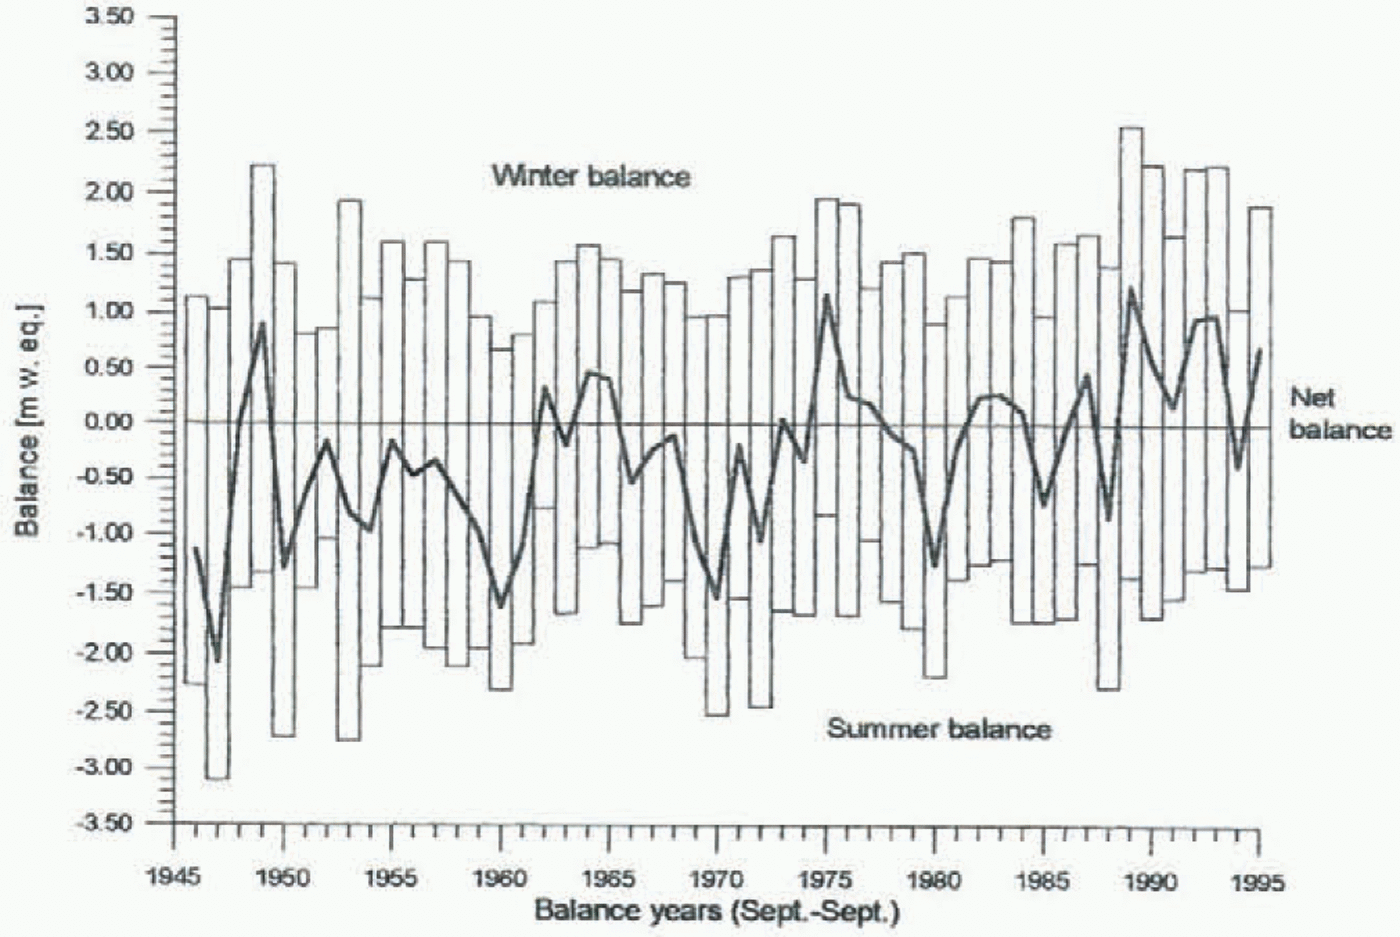
Mass balance of Storglaciären, 1946–95.
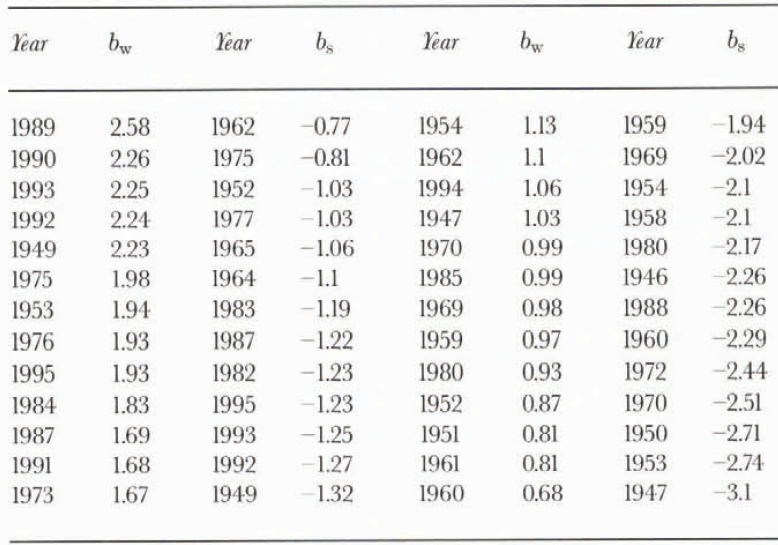
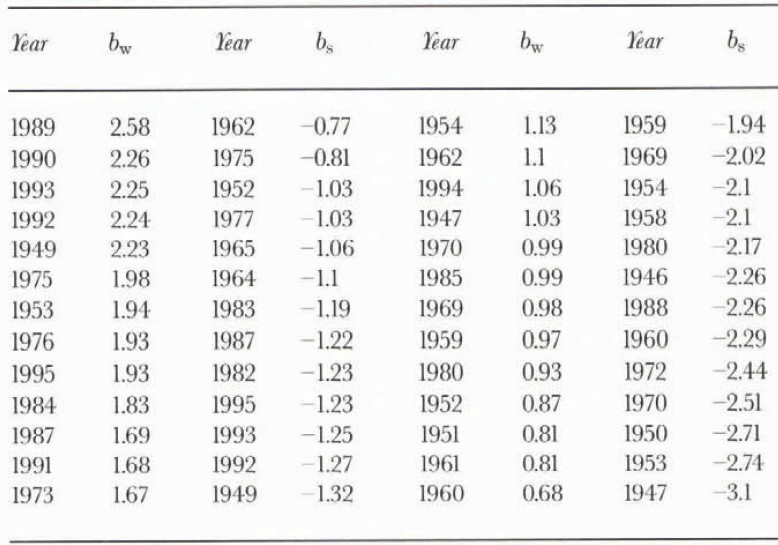
The 13 highest and lowest winter (bw) and summer balance (bs) years from Storglaciären Water fluxes and chemical weathering rates at Finsterwalderbreen
Storglaciären is a small mountain glacier (67∘55’ N, 18∘35’ E; 3.1 km2) in the northern part of the Scandinavian mountain range (Schytt, 1959), lying between 1200 and 1800 m a.s.l., with a mean equilibrium-line altitude (1946–90) of 1400 m a.s.l. (Grudd, 1992). The mass-balance record, available from Tarfala Research Station, is shown in Figure 1. The glacier is located just east of the divide of the mountain range, and experiences heavy orographic precipitation. A statistical investigation of the correlation between meteorological parameters and mass-balance data has been carried out by Holmlund (1987). Investigations of the link between physical parameters and ablation on the glacier showed that two-thirds of the melt was associated with radiative heat and one-third with turbulent heat during the summer of 1994 (Hock and Holmgren, 1996).
The separation between summer and winter balance periods is determined by air temperatures, where the period with averaged positive (Celsius) temperatures is the summer balance period (Grudd, 1992). The summer
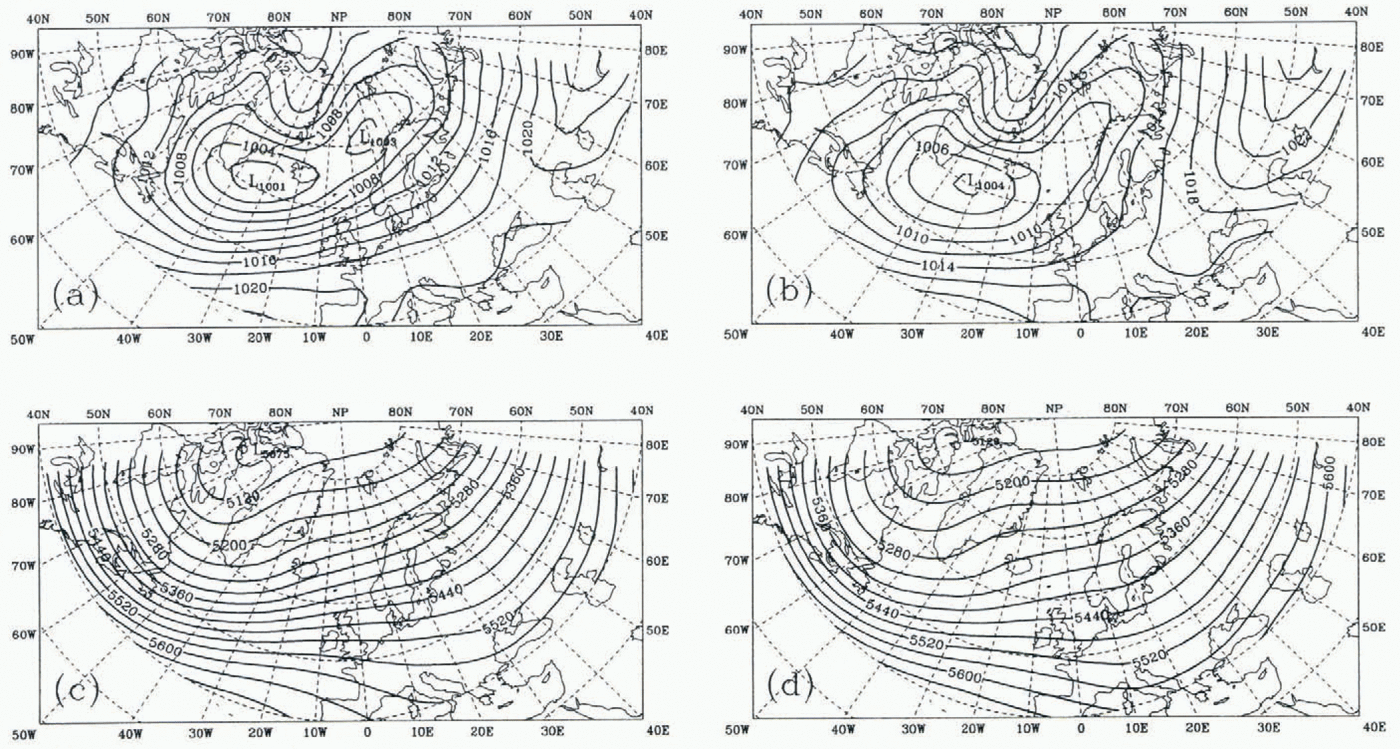
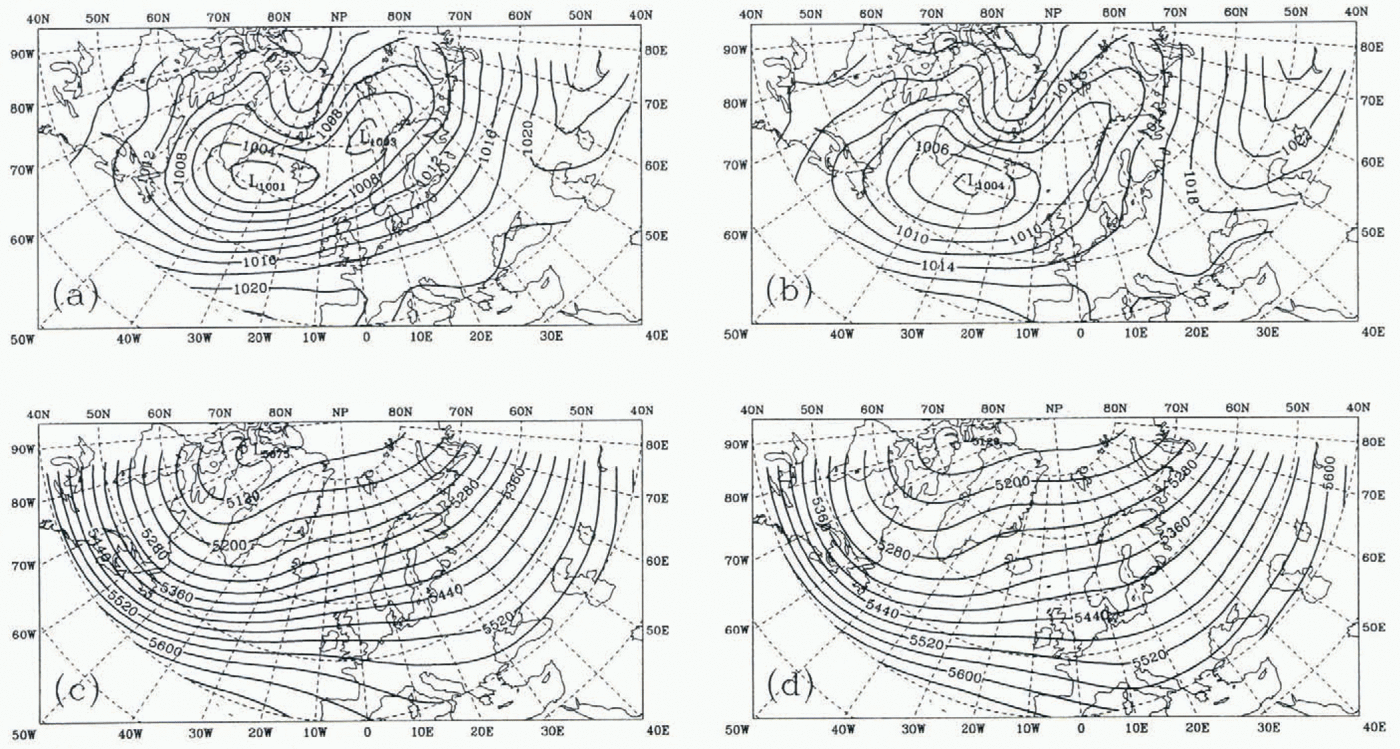
(a) SLP for high accumulation in winter, (b) SLP for low accumulation in winter, (c) 500 hPa height fot high accumulation in winter, (d) 500 hPa height for low accumulation in winter.
balance period usually starts in mid-May and persists to mid-September. We will use the period June–August to represent the ablation season. Technically the rest of the year is the winter balance period, but statistical studies of the relation between air-pressure indices and the mass balance of Storglaciären show that two air-pressure indices spanning the months January–May had a higher correlation with the winter balance of Storglaciären than when the period September–May was used (Pohjola and Rogers, 1996). This may be explained by the fact that most accumulation usually is brought by storms in late winter/spring on the glacier.
Northern Hemisphere gridded monthly mean sea-level pressure (SLP) and 500 h Pa geopotential heights are used to represent the atmospheric circulation. The data are available from 1946 to 1992 on a 5∘ by 5∘ grid over the North Atlantic 40∘ to 80∘ N and 80∘ W to 80∘ E. The winter balance data from 1946–95 were ranked from highest to lowest net accumulation on Storglaciären, as were the summer balance data (table 1). The mean SLP and 500 hPa heights are obtained for these sets of years, comprising the top and bottom quartiles of the ranked lists. Data for the years 1993–95 were not available for analysis. First, we present maps of both SLP and 500 hPa heights to show the mean vector wind fields during the mass-balance extremes. Then, we make pressure-difference maps in order to investigate where the largest atmospheric-circulation changes occur during those years.
Results (Atmospheric-Circulation Variability)
Winter period (accumulation months)
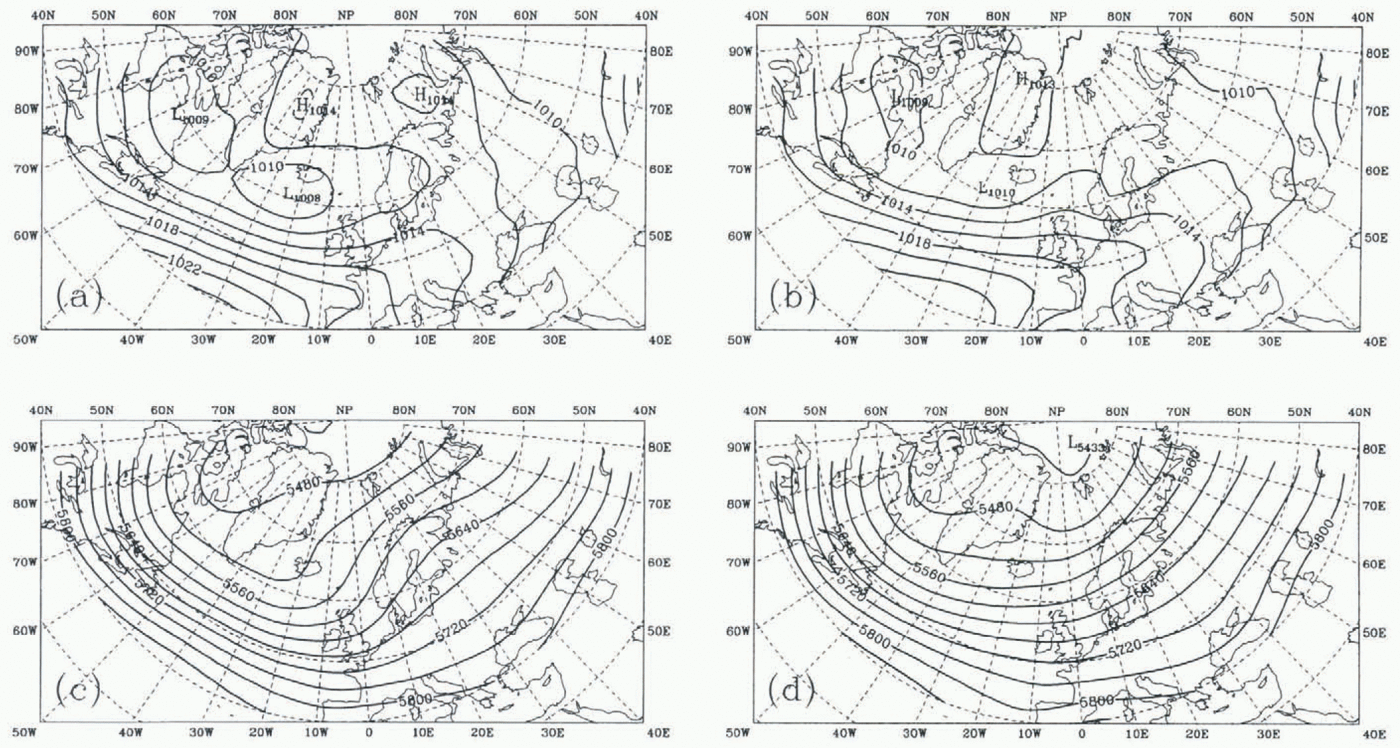
(a) SLP for summers with large ablation. (b) SLP for summers with small ablation, (c) 500 h Pa height for summers with large ablation. (d) 500 hPa height for summers with small ablation.
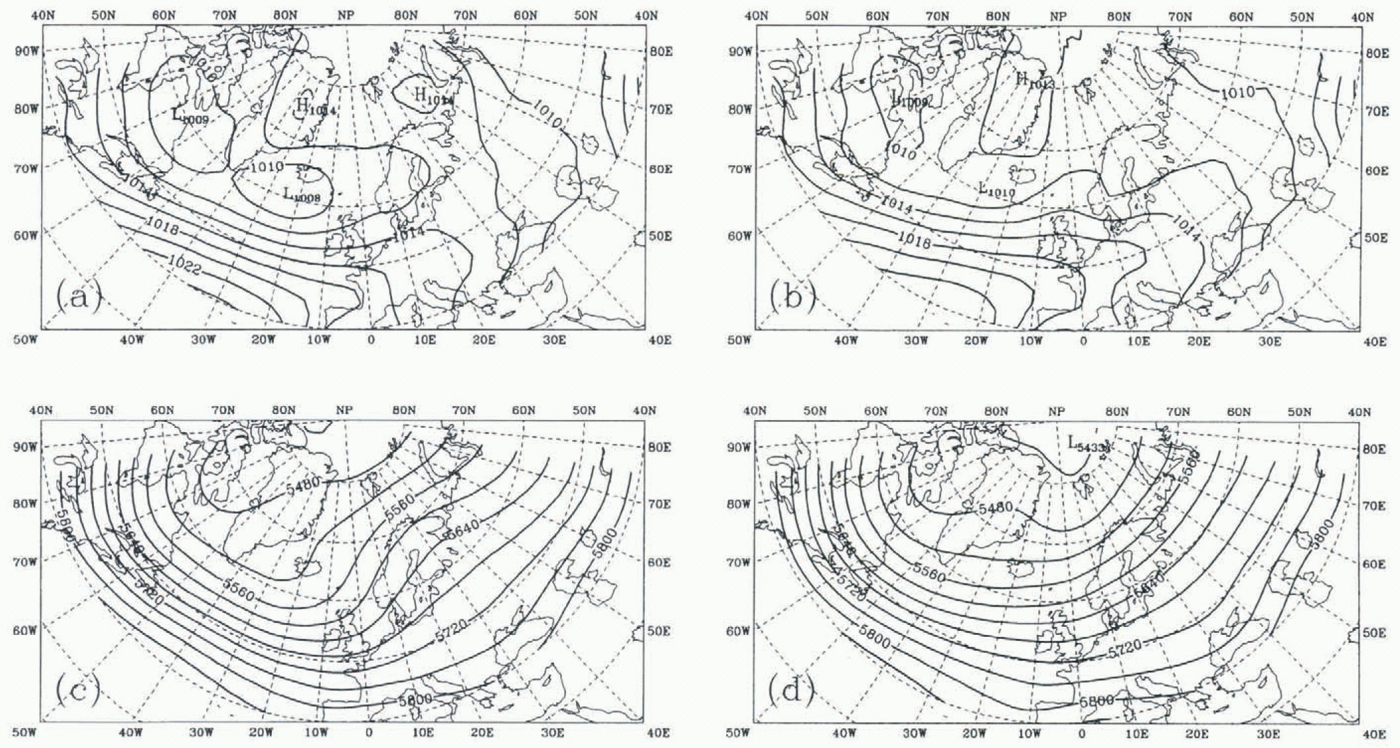
For the high-accumulation years the Icelandic low lies in the Denmark Strait with a central pressure under 1001 hPa (Fig.2a). A deep trough extends northeastward from Iceland, however, with a secondary low of about 1004 hPa over the Norwegian Sea. The isobars south of the secondary low indicate a strong westerly maritime flow into northern Europe that brings mild winters and much precipitation to the area. In low-accumulation years both the Icelandic low and the low-pressure trough over the Norwegian Sea are weaker (Fig. 2b). The isobars are now oriented parallel to the Scandinavian coast, and the averaged Siberian anticylone extends to the northwest toward Europe.
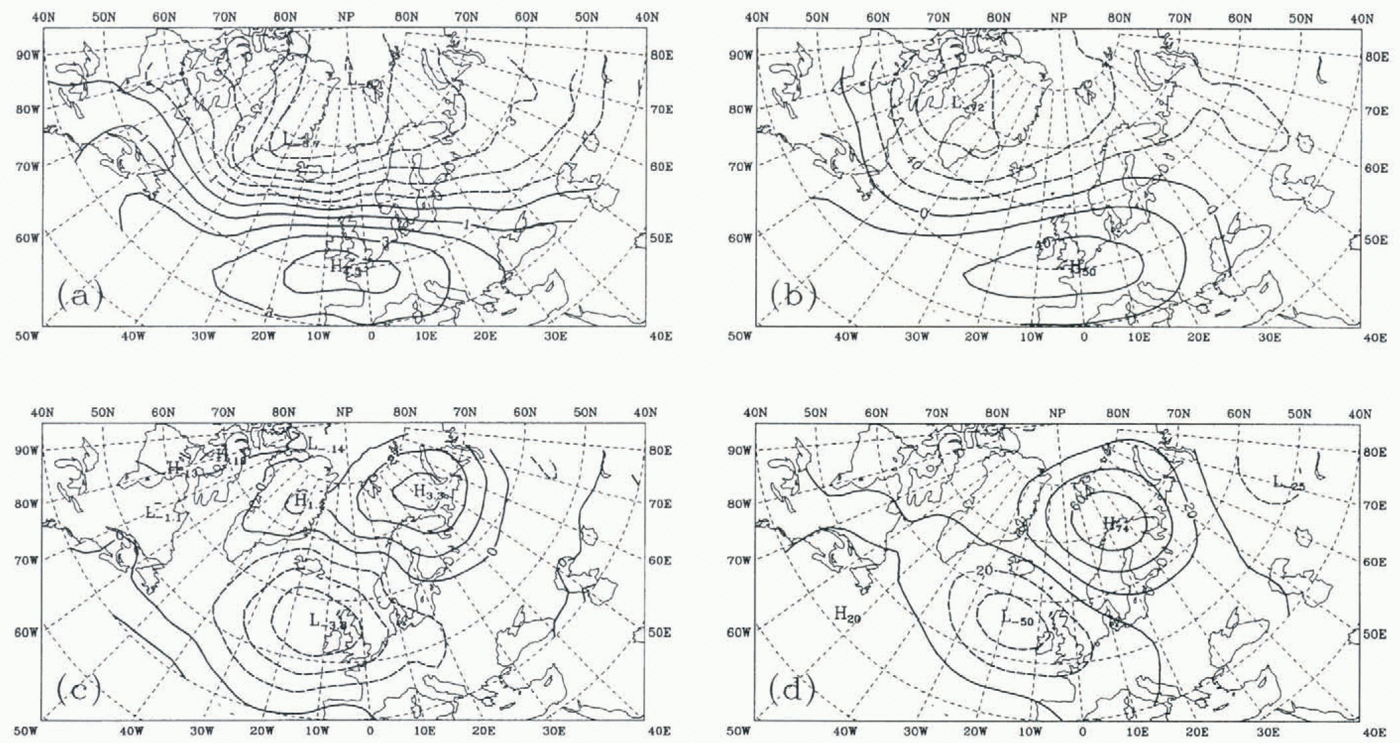
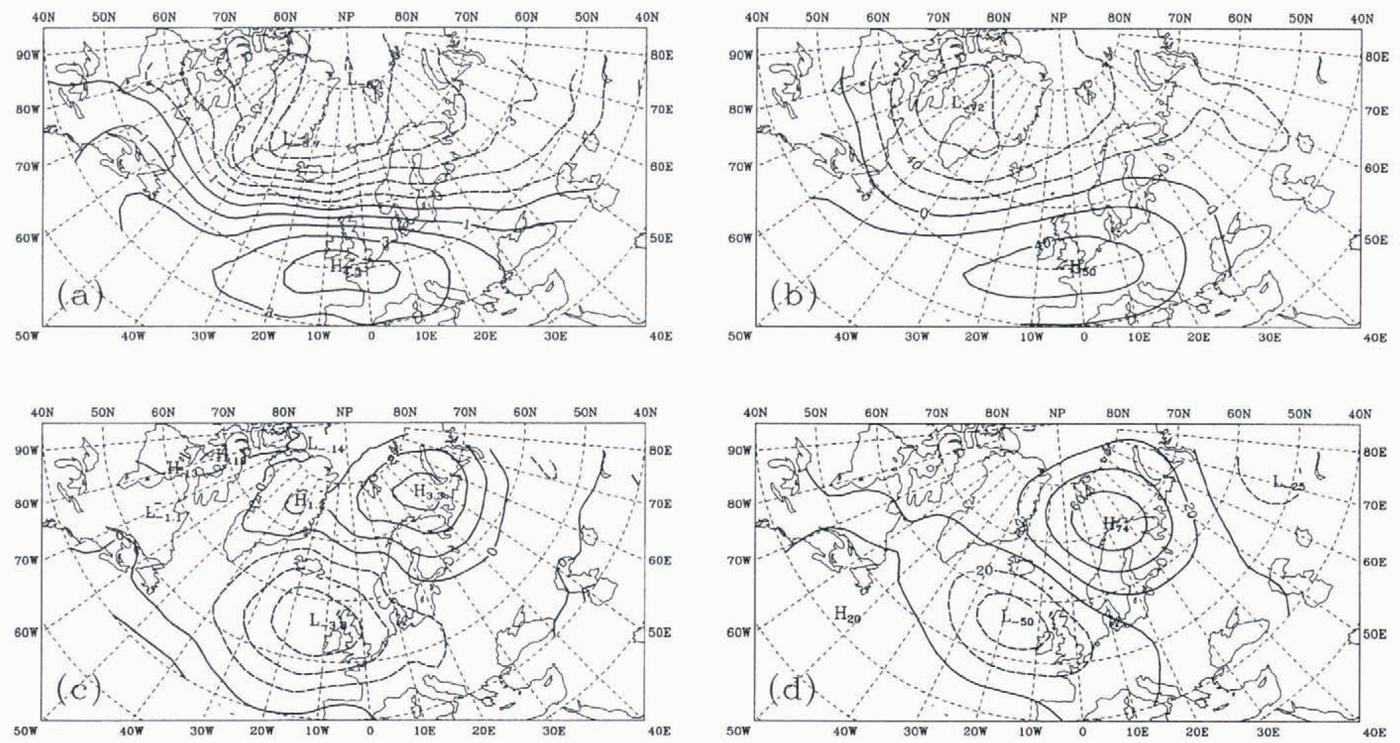
(a) Differences in SLP between high-and low-accumulation winters. (b) Differences in 500 hPa height between high and low -accumulation winters. (c) Summer SLP differences in ablation. (d) Summer 500 hPa height differences in ablation.
These two maps show interplay between three dynamic cells: the Iceland low, the Siberian high and the Azores high, where a strong air-pressure gradient between Azores and Iceland in conjunction with a weak Siberian high favours high winter balance (precipitation). Conversely, a stronger and westward-extended Siberian high and weaker Iceland low and Azores high favour low winter accumulation.
The mean 500 hPa heights exhibit subtle variations during the high- and low-accumulation years. High-accumulation years (Fig. 2c) exhibit a stronger gradient across the northernmost Atlantic than occurs in the low-accumulation years (Fig. 2d). These maps suggest a more intense cyclonic activity over the Norwegian Sea during years of higher winter balances.
Summer period (ablation months)
The summers with highest ablation on Storglaciären are characterized by a SLP trough extending from southern Greenland to the Gulf of Bothnia (Fig. 3a), with relatively high pressure located over the Barents Sea. In summers with low ablation, a pronounced ridge of high pressure occurs over the British Isles northward to southern Norway (Fig. 3b), but there is an absence of high pressure in the Barents Sea.
The 500 hPa map (Fig. 3c) for high-ablation cases shows a strong southwesterly flow parallel to the Scandinavian coast, extending from a northwest–southeast oriented trough between Iceland and the British Isles to a similarly oriented ridge extending from Svalbard to the northern coast of Norway at 25∘ E longitude. The 500 hPa map indicates that a warm high-pressure ridge prevails over northern Scandinavia during high-ablation summers. The low-ablation summers (Fig. 3d) are characterized by a trough west of Scandinavia in the northeastern Atlantic, extending along the Greenwich meridian. The west-southwesterly geostrophic flow extends far into northern Europe, indicating a strong maritime flow.
Pressure-difference maps
The net mean differences, obtained by subtracting SLP during low-accumulation winters (Fig. 2b) from SLP during high-accumulation winters (Fig. 2a), exhibit a strong gradient across the southern Norwegian Sea and Scandinavia, lying between areas of positive SLP differences over the British Isles and negative differences over eastern Greenland and Svalbard (Fig. 4a). The signs of the mean SLP differences in figure 4a are the same as those of the departures from normal mean pressure in the high-accumulation cases, and show the spatial extent of the enhanced pressure gradient over the northern Atlantic. The signs of the pressure departures reverse in the low-accumulation cases, and net weakening of the westerlies occurs in conjunction with below-normal pressure over the British Isles. The net mean 500 hPa height differences (Fig. 4b) are similar to those of SLP, showing an enhanced height gradient in high-accumulation years and a weakened gradient in low-accumulation years. The main difference between figure 4a and b is that the northernmost (negative) center of height differences in figure 4b is west of Greenland, while it is east of Greenland in the SLP data. This indicates that western Greenland is unusually cold, while mild maritime flow occurs in Scandinavia (e.g. Van Loon and Rogers, 1978).
The net summer mean SLP differences (Fig. 4c) are negative over the United Kingdom and positive over the Barents Sea, reflecting the sign of the departures from normal mean pressure of the high-ablation cases (Fig. 3a). The net geostrophic wind-flow anomaly occurring between these pressure difference centers is southeasterly, indicating a continental flow originating in eastern Europe. The signs of the SLP centers are switched in low-ablation cases, with anomalous high pressure over the British Isles and low pressure over the Barents Sea producing stronger than usual maritime northwesterly flow into Scandinavia (Fig. 4c).
The general spatial distribution of the mean 500 hPa height differences (Fig. 4d) is similar to that for summer SLP (Fig. 4c), and the implication is that the 500 hPa westerlies are weakened in high-ablation cases and strengthened in low-ablation cases, especially in the area of strongest height gradient south of Storglaciären. The positive 500 hPa difference center in figure 4d is west of its location in figure 4c, lying over both the ridge crest found in figure 4c and Storglaciären.
Discussion
The mean pressure differences of Figure 4 indicate a warmcore ridge occurs in the large-ablation years with maximized temperature anomalies in the vicinity of Storglaciären. A reverse cold-core low is implied in low-ablation summers when the signs on the difference charts are reversed. This accounts for the high correlation observed between air temperatures and summer ablation (Holmlund, 1987). The warm ridge in high-ablation summers is probably accompanied by clear skies and abundant solar radiation receipt near Storglaciären. The influence of thermal advection in the high- and low-ablation summers is also apparent. Note that a southeasterly sea-level geostrophic flow over Storglaciären might be inferred from the 1012 hPa isobar in figure 3a, with a southwesterly 500 hPa flow observed aloft (Fig. 3c). Conversely, a northwesterly surface flow is inferred over Storglaciären around the 1012 hPa isobar in figure 3b, while a west-southwesterly maritime flow occurs at 500 hPa (Fig. 3d). Thus the winds veer with height over Storglaciären in high-ablation years, and they are backing with height in the low-ablation summers, suggesting the presence of warm air advection and cold air advection, respectively.
Comparing the results for winter and summer, it is apparent that enhanced maritime flow is associated with both the high-accumulation winters and the low-ablation summers, bringing mild and moist maritime air to northern Scandinavia in winter but colder than usual air masses in summer. Conversely, a weakened westerly flow with an increased tendency for enhanced easterly or southeasterly winds of continental origin is suggested for low-accumulation winters and high-ablation summers. Glacier growth is favoured during periods of enhanced maritime flow prevailing in both winter and summer, while reduced maritime influence is linked to net loss of the glacier, due to drier winters and warmer summers.
In the mass-balance record of Storglaciären, eight of the winters from 1982 to 1995 are among the 13 years of highest winter accumulation (table 1), while six of the summers are among those with the lowest summertime ablation. This shows the change in the synoptic patterns during the last two decades that are also reported from many other sources (e.g. Rogers, in press). The recent tendency for high accumulation is in keeping with Hurrell’s (1995) observation that the moisture flux over the North Atlantic Ocean has increased since 1980, and Rogers and Mosley-Thompson’s (1995) observation that cyclones are more frequently extending to high latitudes in the Arctic in winter.
The correlation between the summer and winter mass balances is generally rather low, as is the correlation between the strength of the circulation in winter and summer. Nonetheless, over the period since 1980 there has been a clear tendency toward increased zonal maritime flow in winter, as well as an increase in maritime flow in summer. This has sustained Storglaciären and other Scandinavian glaciers during a period of time when most glaciers worldwide are undergoing retreat.
Conclusions
Mass-balance records of glaciers can be used to investigate the coupling between variations in the mass balance and the atmospheric circulation. General differences in the atmospheric flow were found to be linked to the extremes of the mass-balance record from Storglaciären. High net balances were favoured by stronger westerlies (more maritime influence over northern Scandinavia). Low net balances occurred during years with more continental easterly air flow, where the Siberian/Barents Sea high-pressure cell was unusually strong.
The mass-balance record also shows that the mass-balance extremes have been increasingly frequent during the last two decades, suggesting that northern Scandinavia has experienced an increased maritime influence by a stronger and more persistent westerly air flow.
Acknowledgements
This work is supported by the U.S. National Oceanic and Atmospheric Administration Office of Global Programs — Atlantic Climate Change Program, under grant NA56GP0213, and a postdoctoral grant from the Swedish Natural Science Research Council. We are grateful to H. Grudd, P. Holmlund, P. Jansson and T. Schneider at Tarfala Research Station for providing data. Thanks are also due to W. Karlén of Stockholm University, J. Kohler at the Norwegian Water Resources and Energy Administration (NVE) and E. Mosley-Thompson and other colleagues at the Byrd Center for stimulating discussions. C. -C. Wang assisted in producing the pressure diagrams. We are grateful for comments from B. Holmgren, which improved the final version of the paper. This is contribution No. 1005 from Byrd Polar Research Center.