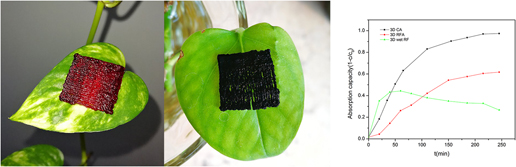
I. INTRODUCTION
The three dimensional (3D) direct writing technology has great potentials and advantages in the fabrication of complex 3D microstructure. This technology exhibits the advantages of simple equipment, adjustable composition, low cost, high efficiency, and potentially high resolution.Reference Zhu, Han, Duoss, Golobic, Kuntz, Spadaccini and Worsely1 Lewis’ group devolved a lot of novel 3D direct writing equipment and inks with various chemical compositions.Reference Compton and Lewis2–Reference Vorndran, Klammert, Ewald, Barralet and Gbureck8 In 2015, Worsley’s group developed the graphene-based colloid ink for direct writing. This technique showed the exquisite structure and unique properties of the periodic graphene aerogel microlattices. This is perhaps the first report concerning the direct writing ink with the primary size about 10 nm. The introduction of the nanoscale microstructure of aerogels into the periodic microlattices may induce novel functions or applications for board interests.Reference Compton and Lewis2–Reference Walker and Lewis15
Graphene-based colloid is a solid–liquid hybrid system, showing relatively high viscosity, good mechanical properties, and high formability.Reference Kim, Zhao, Lee and Liu16–Reference Jakus, Secor, Rutz, Jordan, Hersam and Shah20 Moreover, the ink normally exhibits the perfect character of non-Newtonian fluids. This fluid property is suitable for direct ink writing.Reference Liao21 Thus, almost all of the relative reports are focused on the direct writing of graphene-based ink.Reference Zhu, Liu, Qian, Han, Duoss, Kuntz, Spadaccini, Worsley and Li18–Reference Guo, Cai, Sun, He, Wu, Zhang, Wang and Zhang26 The traditional sol–gel colloids may have great potentials for 3D direct writing of the support, adsorbent and filter for biologicalReference Wang, Li, Lu, Gu, Wang, Sun, Zhang, Li and Zhang22,Reference Zhang, Alloul, He, Zhu, Verde, Li, Wei and Guo25 or environmental applicationsReference Guo, Cai, Sun, He, Wu, Zhang, Wang and Zhang26 because of their nanoscale size effect, high surface area, adjustable composition, and relatively low cost. In this paper, we designed an aged resorcinol-formaldehyde (RF) sol–gel ink for direct ink writing of the microlattices. The suitable conditions and rheological behaviors for direct ink writing were got via the adjustment of the aging time for RF sol. Moreover, to improve the formability, the fresh microlattices were strengthened by HCl atmosphere, which acted as the surface catalysis. We use the nanostructure of the sol ink for 3D direct printing. But nanostructured ink has low viscosity and poor formability. To improve the formability, the fresh microlattices were strengthened by surface catalysis with HCl atmosphere. The printed sample itself had millimeter-scale diffusion channels and a lot of micron-scale pores after supercritical drying and carbonization. So the sample had excellent adsorption properties. The RF aerogel and carbonized RF aerogel samples exhibited a good capacity of quick adsorption of Dulbecco’s modified eagle medium (DMEM), indicating the potential application for cell supports.
II. EXPERIMENTAL
A. Materials
Resorcinol (R, C6H4(OH)2), formaldehyde solution (37 wt%, F, HCHO, AP), ethanol (≥99.7%, EtOH), acetone (CH3COCH3, AP), hydrochloric acid (34.46 wt%, HCl), carbonic acid anhydride (Na2CO3, CP), and the deionized water were purchased from Sinopharm Chemical Reagent Co., Ltd. (Beijing, China) and used as received. DMEM/high glucose were purchased from GE Healthcare Life Sciences HyClone Laboratories (Beijing, China) and used as received.
B. Preparations
1. Preparation of RF ink
The RF sol–gel ink was prepared via the sol–gel process. First, 9.71 g of resorcinol was added into 72.46 mL of deionized water. The mixture was stirred for 30 min using a magnetic stirrer. After that, 3.526 mL of 0.05 sodium carbonate aqueous solution was added to the resorcinol solution as the catalyst. Finally, 13.41 mL of 37 wt% formaldehyde solution was added into the resulting solution and stirred for 30 min. The RF colloid was put into the 60 °C oven for 4 h, and the 80 °C oven for another 1 h.
2. Layout of the 3D printing system
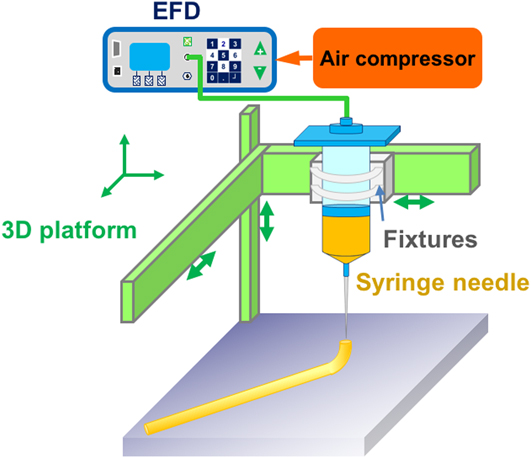
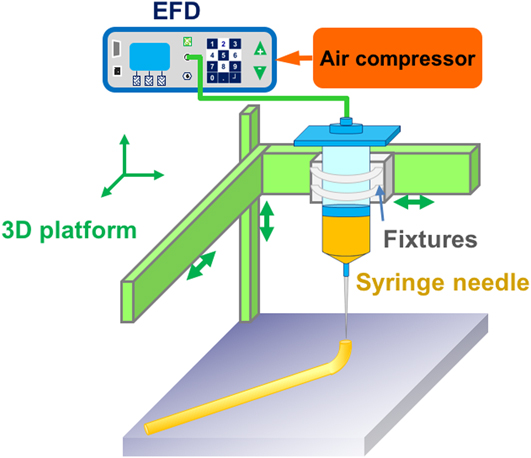
The 3D printing platform was set up by air compressor, EFD glue dispenser, and Einstart 3D printer, as mentioned in the references. The printing precision of the printer is 0.15–0.35 mm, the model building size is 160 × 160 × 160 mm, the inner diameter of the needle is 0.41 mm, and the printing speed is 30–150 mm/s. The glue dispenser uses Ultimus V high precision compensation type dispenser (Nordson EFD, Providence, Rhode Island), the glue rate is more than 600 dot glue cycles per minute, and the time of dispensing could be adjusted from 0.0001 to 9.9999 s. We removed the print nozzle and heating system of the Einstart 3D printer (Shining 3D, Hangzhou, China), fixed the syringe (30 cm3), and used the EFD dispensing machine to print.Reference Morisette, Cesarano, Lewis and Dimos27 The layout of printing instrument is shown in Fig. 1.Reference Bellec, Royon, Bousquet, Bourhis, Treguer, Cardinal, Richardson and Canioni28
Layout of direct writing 3D printing system.
3. Preparation of the sample
The RF ink was added into the 3D printing system for printing. During the printing process, the T type Ruhr needle was used and the inner diameter of the needle was 0.41 mm. Then, the samples with the size of 35 × 35 × 15 mm were printed. The printed samples were not strong enough to be self-supporting for a long time.Reference Liu, Haubold, Rutkowski, Oschatz, Hübner, Werheid, Ziegler, Sonntag, Liu, Zheng, Herrmann, Geiger, Terlan, Gemming, Borchardt, Kaskel, Czyrska-Filemonowicz and Eychmüller29,Reference Shi, Shi, Ullah, Li, Revin and Yang30 Inspired by the reference concerning the preparation of acid-catalyzed RF samples, we sprayed a certain concentration of hydrochloric acid on the sample to help it be strengthened rapidly. After that, the samples were washed with acetone for three days (two times a day) to remove residual water and solvents. The samples were then dried by supercritical carbon dioxide, and the 3D-printed RF aerogels were derived (31 °C, 7.3 MPa). Finally, 3D-printed RF aerogels were pyrolyzed at 1000 °C under nitrogen atmosphere with a rate of 300 mL/min to derive the 3D-printed carbon aerogels.Reference Wang, Du, Zhang, Zhou and Shen31,Reference Du, Zhou, Zhang and Shen32 The heating process consisted of six steps with the heating rate of 1 °C/min. Step 1: room temperature (25 °C) heated to 100 °C, and then maintained for 60 min. Step 2: 100 °C heated to 200 °C, maintained for 60 min. Step 3: 200 °C heated to 400 °C, maintained for 180 min. Step 4: 400 °C heated to 600 °C, maintained for 60 min. Step 5: 600 °C heated to 1000 °C, maintained for 180 min. Step 6: 1000 °C dropped to room temperature. The microlattices of supercritical dried RF aerogels and resulting carbonized aerogels were marked as 3D RFA and 3D CA hereafter, respectively.
C. Characterization
The morphology of the 3D-printed RF aerogel and carbon aerogel were observed by scanning electron microscopy (SEM; Philips-XL30FEG, Thermo Fisher Scientific Inc., Hillsboro, Oregon). The samples were fractured at room temperature and sputter coated with gold before the SEM observation. The surface area of the sample was calculated by the Brunauer–Emmett–Teller (BET) method, and pore size distribution for the micropores and mesopores was determined by using the BJH theory. The shear rate and viscosity of the RF sol ink were tested by using a rheometer (Anton Paar MCR-102, Anton Paar, Graz, Austria) at room temperature (25 °C). An UV-Vis-NIR spectrophotometer (JASCO V-570, JASCO, Kyoto, Japan) was used to measure the absorbance of cell culture media soaked in three samples at different times.
D. Adsorption test
The cell culture medium (DMEM/High Glucose, 7 mL; GE Healthcare Life Sciences HyClone Laboratories, Beijing, China) was immersed in the samples of 3D wet RF, 3D RFA, and 3D CA. Every 20–30 min, the relative concentration was measured by calculating the absorbance of cell cultures. Beer’s law was used to calculate the relative concentrations of cell culture solutions at different times to analyze three samples’ adsorption capacity.
III. RESULTS AND DISCUSSION
A. Viscosity–shear rate analysis
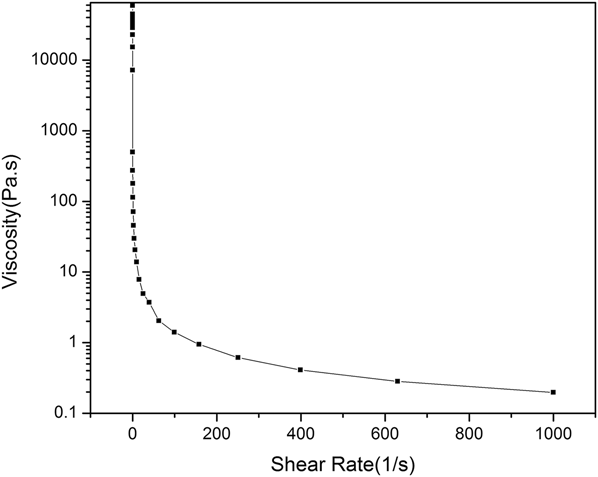
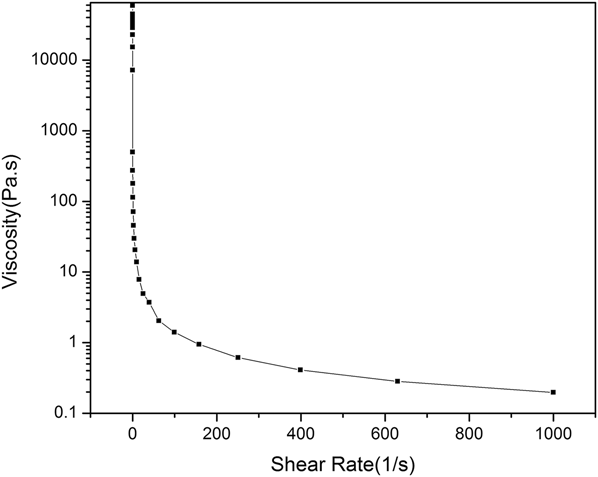
Here, the aged RF sol–gel ink was designed for direct ink writing. The suitable conditions and rheological behaviors were especially important for direct ink writing. We found the suitable ratio of reagents and the aging time for RF ink. As shown in Fig. 2, the viscosity of the RF ink decreases with the increase of the shear rate, indicating the behaviors of the non-Newtonian fluid.Reference Compton and Lewis2 The greater the shear rate is, the smaller the viscosity is. Given the pressure would determine the shear rate according to Poiseuille’s law, the higher pressure leads to the lower viscosity and ultimately better flow ability. With the shear rate of 10–1000 s−1, the viscosity of RF ink ranges from 0.197 to 13.8 Pa s. This range is suitable for 3D direct writing.
Relationship between the shear rate and the viscosity of the RF ink.
B. Morphology analysis
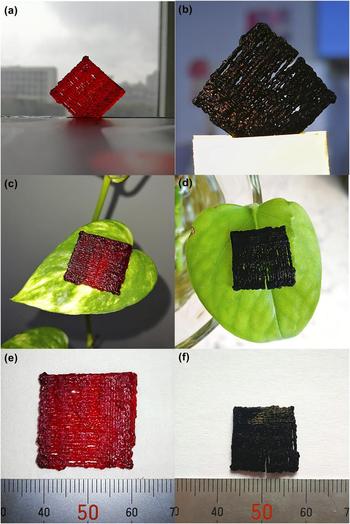
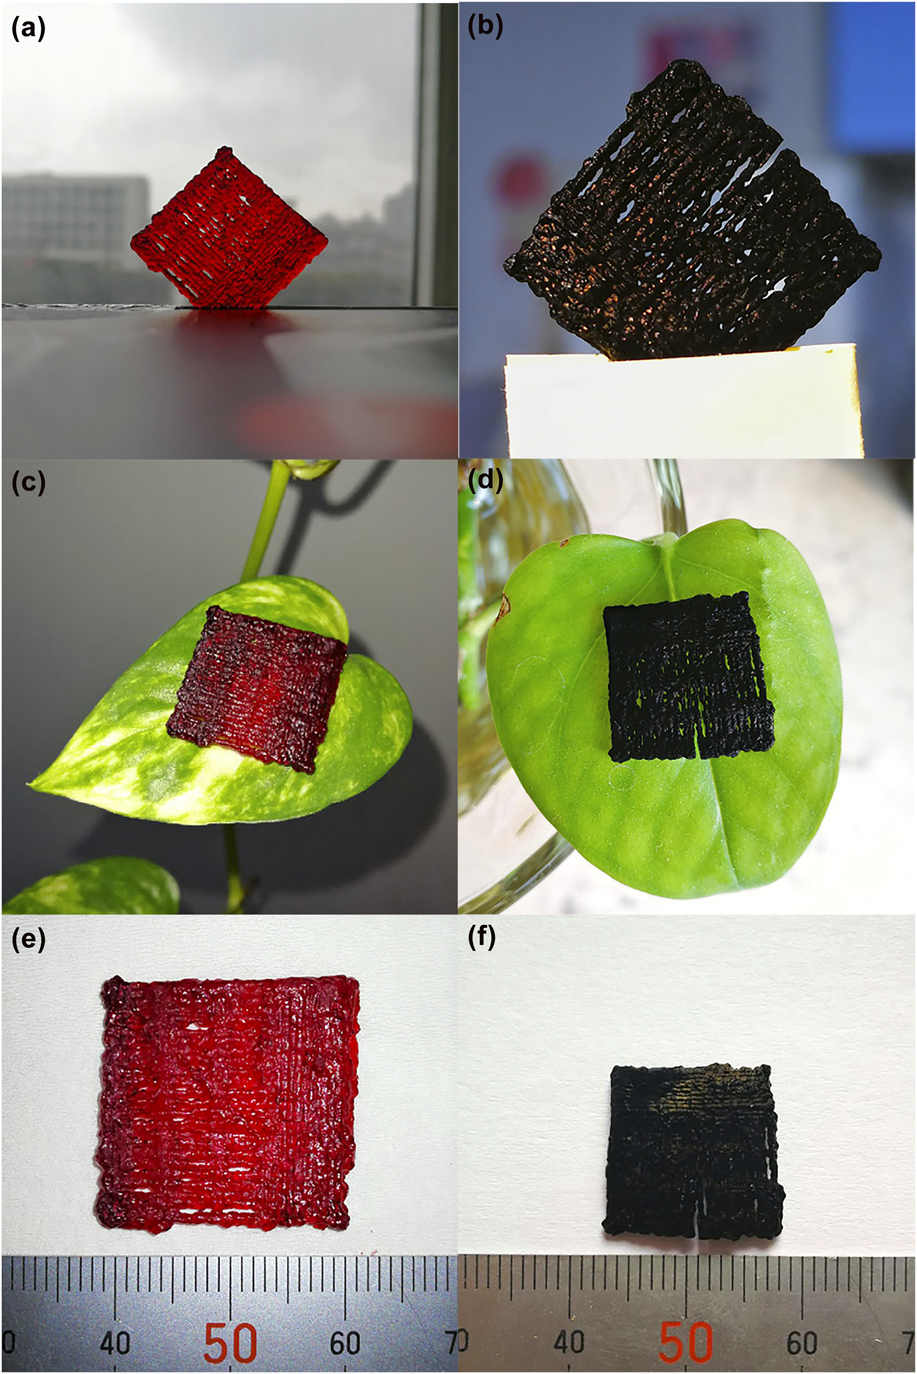
Figure 3 showed the structure of 3D RFA and 3D CA microlattices. During the solvent replacement, the width of RF wet gel microlattices decreased from 35 to ∼22 mm. After supercritical drying and carbonization, the width of 3D RFA and 3D CA was about 22 mm (almost without shrinkage) and 18 mm, respectively [Figs. 3(e) and 3(f)]. As shown in Figs. 3(a) and 3(c), 3D RFA was red and transparent. The colors of the leaf could be easily recognized through the sample [Fig. 3(c)]. As shown in Figs. 3(b) and 3(d), 3D CA was black, opaque, and even difficult to be focused, similar to reflection behavior of normal carbon aerogels.Reference Du, Zhou, Zhang and Shen32–Reference Sun, Du, Yu, Shen, Huang, Tang and Zhou35 After supercritical drying, the density of the sample was about 617 ± 71 mg/cm3. After carbonization, the density of the sample was about 340 ± 23 mg/cm3. The sample was very light, which could be easily put on a leaf [Figs. 3(c) and 3(d)].
Photographs of the samples 3D RFA (a), (c), and (e) and 3D CA (b), (d), and (f).
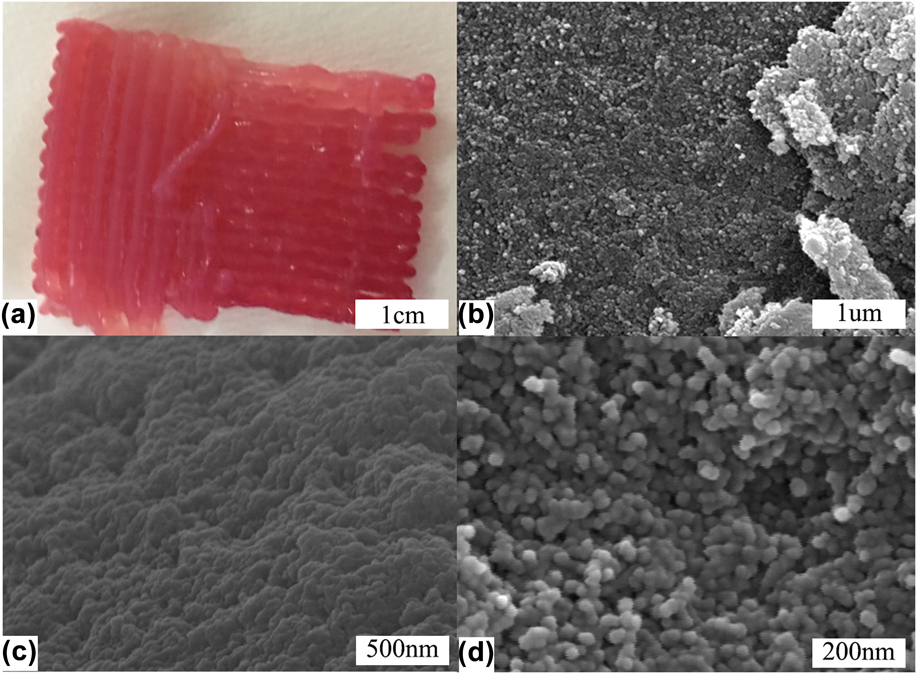
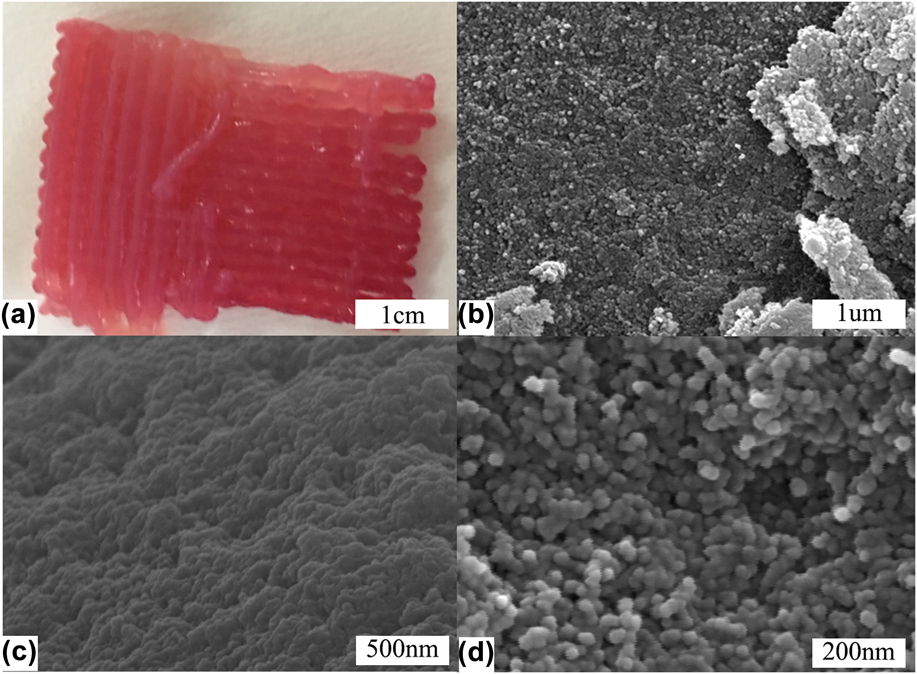
As shown in Fig. 4(a), the woodpile structure of 3D RF wet gel could be clearly observed. Figures 4(b)–4(d) are the morphologies of 3D RFA. It showed that 3D RFA was nanoporous materials with homogeneous nanoscale skeletons and coherent opening pore structure. The size of secondary particles was about 30–40 nm.
(a) Photographs of 3D RF wet gel; (b), (c), and (d) 3D SEM micrographs of 3D RFA.
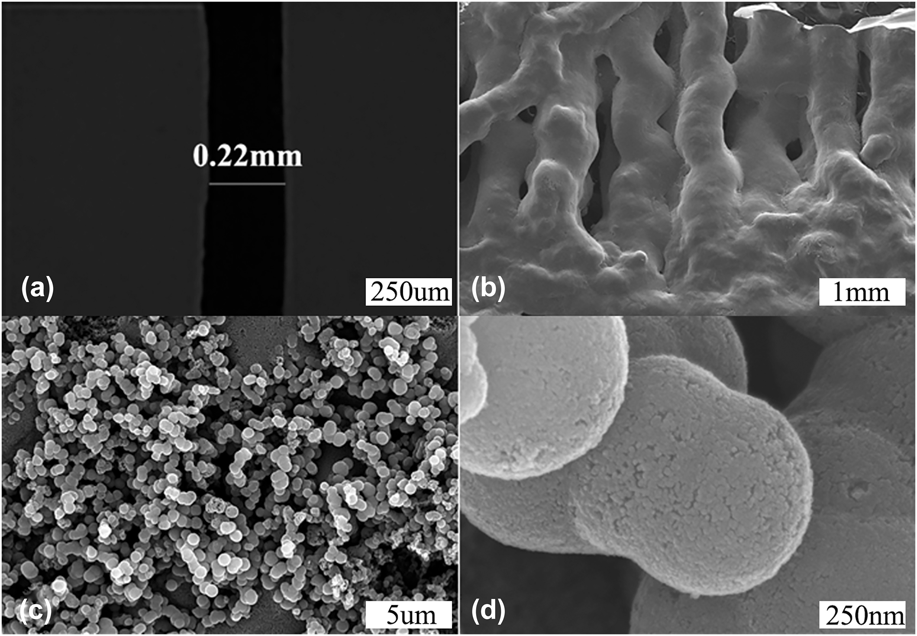
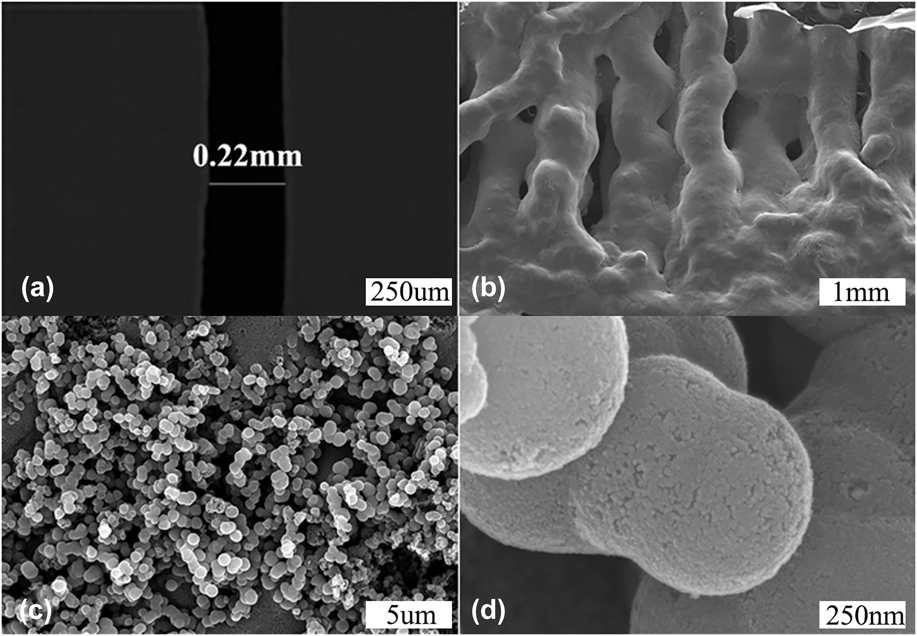
However, as shown in Fig. 5, the particle size became much larger (about 500–600 nm) after carbonization. There was a fine nanoscale structure on the surface of the particles (<50 nm), indicating the agglomeration of the secondary particles of 3D RFA. The agglomeration behavior may be the driving force for the shrinkage of the microlattices. As shown in Fig. 5(a), the diameter of the CA sample reached 0.22 mm, indicating a linear shrinkage ratio of 33% compared to the diameter of the pinhole (0.33 mm). Figure 5(b) shows that 3D CA microlattices had a woodpile structure. This kind of hierarchical structure may be unique for the absorption. The millimeter-scale pore could facilitate the mobility of adsorbate [Fig. 5(b)], while the micron-scale pore may enlarge the contact area of CA and solution [Fig. 5(c)]. Moreover, the hierarchical submicron-scale sphere may provide the active site and large specific surface area [Fig. 5(d)], which is beneficial to the adsorption performances.
(a) Optical micrograph of 3D CA; (b), (c), and (d) SEM micrographs of 3D CA.
C. Pore structure analysis
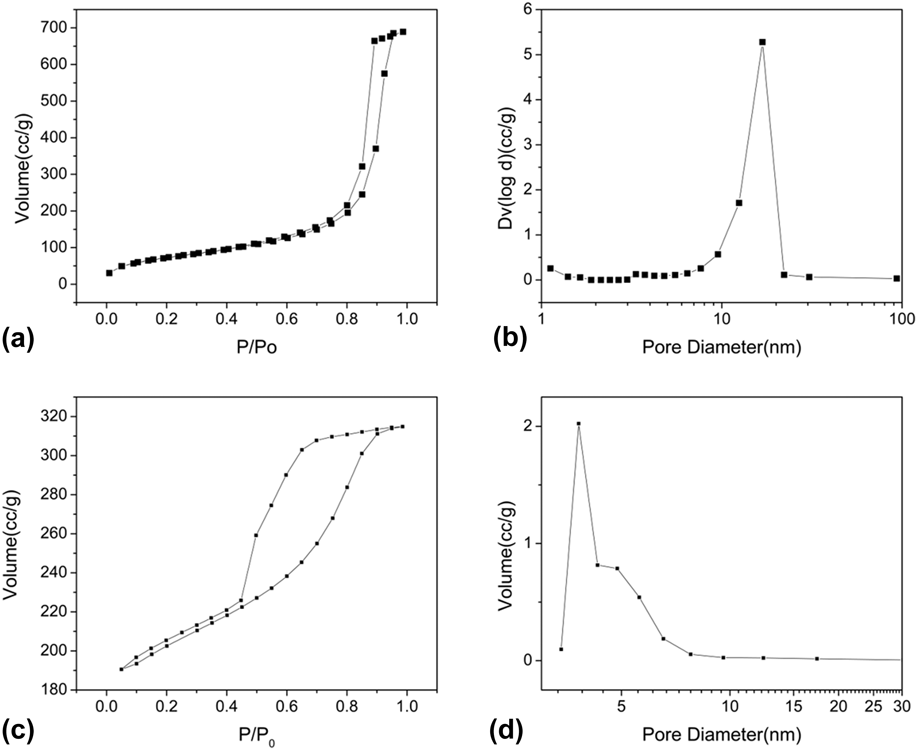
Figures 6(a) and 6(c) are the nitrogen absorption/desorption isotherm of 3D RFA and 3D CA. In Fig. 6(a), we can find that there are few volume adsorptions in the lower relative pressure area, which indicates that there are few micropores in 3D RFA. There is not a lot of volume adsorption in the lower relative pressure region of Fig. 6(c), indicating that the micropore content of the treated samples is decreased. At the same time, according to the classification of the physical adsorption isotherm proposed by International Union of Pure and Applied Chemistry (IUPAC), both Figs. 6(a) and 6(c) exhibit typical hysteresis loops, indicating the presence of mesopores. However, the width of the hysteresis loop in Fig. 6(c) is wider, indicating that the 3D CA greatly increases the number of mesopores. To better characterize the pore size distributions of these two samples, we use the BJH model. It is shown from Fig. 6(b) that the sample has a peak at ∼17 nm, indicating that there are a lot of large mesopores, which is in accordance with the isothermal curve. It is shown from Fig. 6(d) that the sample has no adsorption peak at less than 2 nm, demonstrating that 3D CA does not contain micropores. The peak located at 3.7 nm reveals that the existence of a large number of small mesopores, corresponding well with the isotherm. According to the reference of the literature studies, the sample’s pore size is slightly larger than the adsorbed particle’s diameter, which is most conducive to absorption. The 3D CA sample has a large number of small mesopores (3.7 nm) and without micropores, which just can efficiently adsorb phenol red indicator (∼2 nm).Reference Liu, Shen, Liu, Yang and Du36–Reference Huang, Sumpter and Meunier38 The specific surface area of 3D CA and 3D RFA are 631 and 265 m2/g, indicating that 3D CA may exhibit unique adsorption property.
Isotherm of (a) 3D RFA and (c) 3D CA; pore-size distribution of (b) 3D RFA and (d) 3D CA.

D. Adsorption analysis
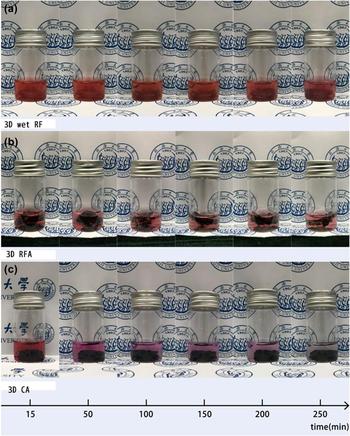
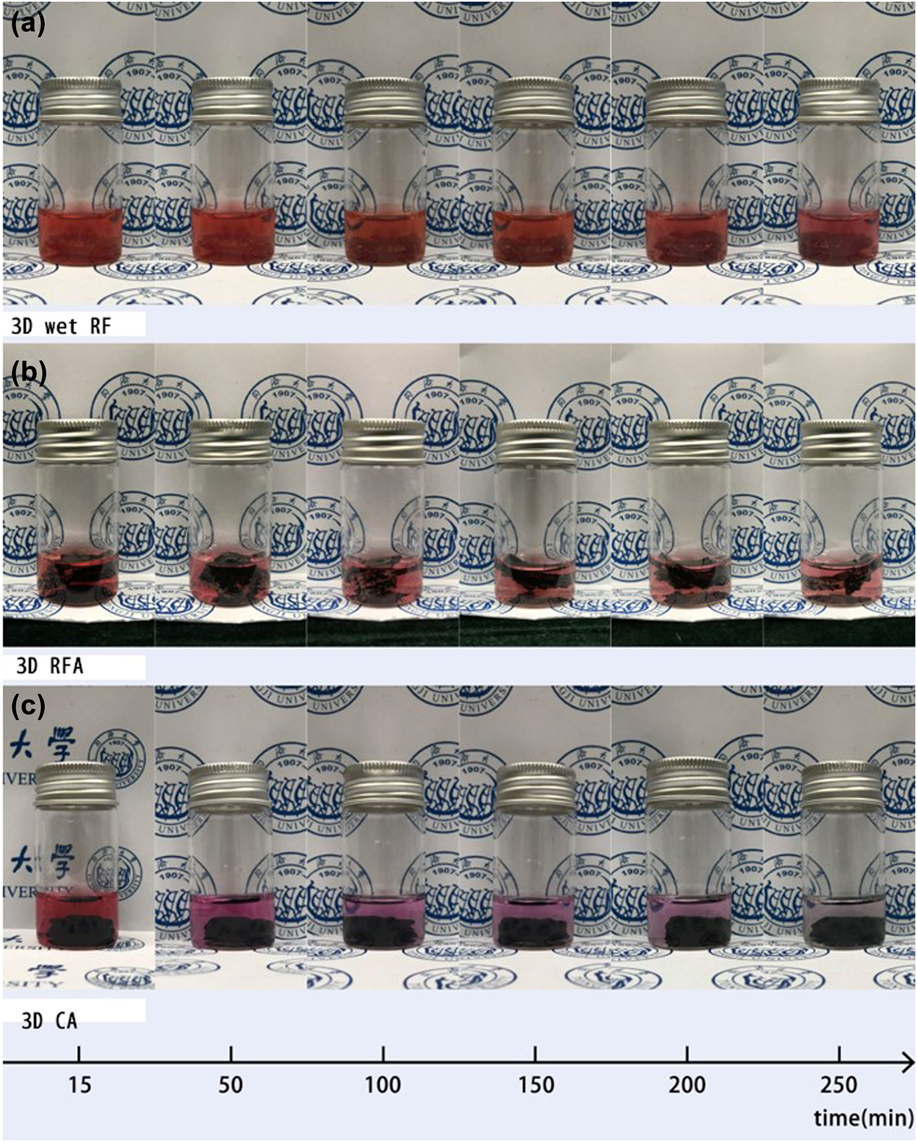
Finally, we analyzed the adsorption property of the samples. The cell culture medium was supplemented with the indicator phenol red, so we could observe the color change of the culture medium clearly. Figure 7 shows the color change of three samples during the adsorption process. It is clear that the color of Fig. 3 in Fig. 7(c) changes from dark red to light pink and finally becomes transparent, indicating its unique adsorption capacity. At the same time, 3D RFA only leads to a slight color change [Fig. 7(b)], while 3D wet RF microlattices almost remain unchanged [Fig. 7(c)], indicating a relatively bad adsorption property. In view of the high specific surface area of the sample, adsorption mode mainly belongs to physical adsorption. The results of SEM and nitrogen absorption/desorption isotherm show that 3D RFA and 3D CA are nanoporous materials with millimeter-scale diffusion channels and a lot of micron-scale pores. The millimeter-scale diffusion channels can help the adsorbate to flow into the channel. The micron-scale pores adsorb the phenol red indicator. 3D printing can increase the specific surface area of the sample. So that the samples can get more contact with the adsorbate and improve the adsorption speed.
The adsorption photographs of (a) 3D wet RF, (b) 3D RFA, and (c) 3D CA.
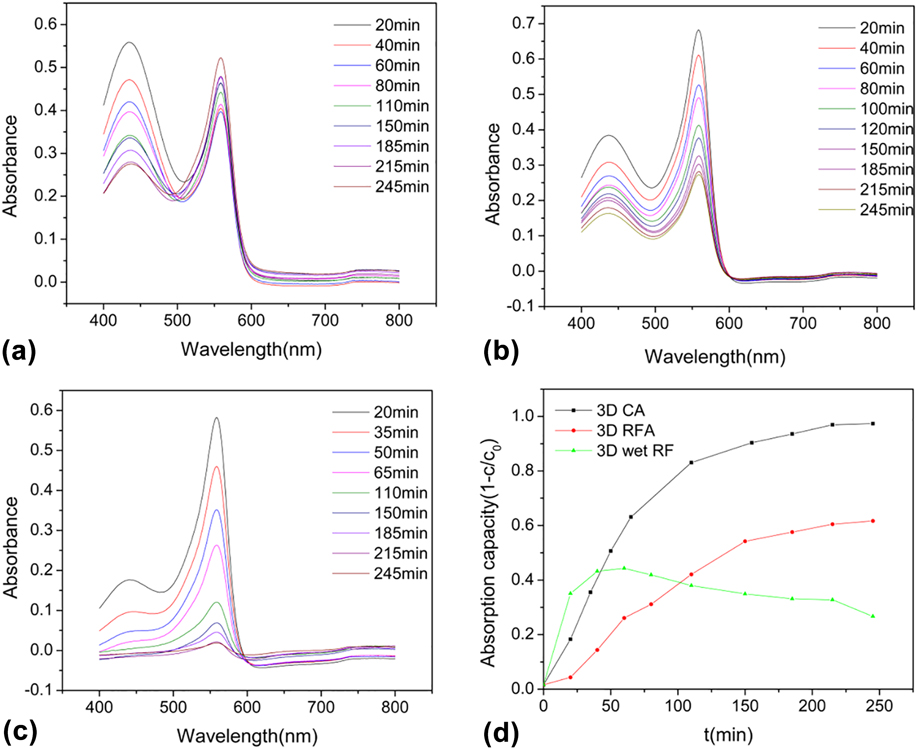
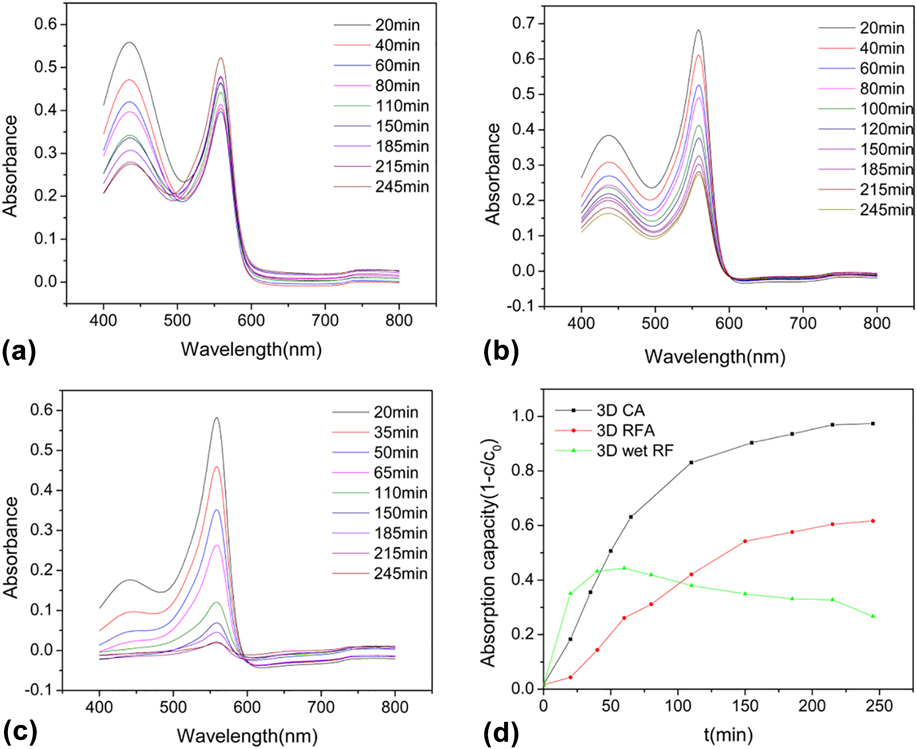
We further characterize the absorbance curves of adsorbed cell culture solution by using an UV-Vis-NIR spectroscope. As shown in Figs. 8(a)–8(c), two peaks exist at 558 and 436 nm. The peak at 558 nm was selected for analysis. The relative concentration is 0.2C 0, 0.33333C 0, 0.4C 0, 0.5C 0, 0.66667C 0, 0.8C 0 (C 0 is the original concentration of DMEM). Thus, we can make a calibration curve (Table SI and Fig. S1), in which the fitting equation is A = 0.71304C/C 0 − 0.02544, with the correlation coefficient R 2 of 0.99526. After soaking three samples into the cell culture solution, the absorbance of the soaking solution was measured every 20–30 min. According to Bill’s law,Reference Ren, Shi, Zhu, Zhang, Bi and Zhang39–Reference Su, Shao, Qin, Guo and Wu49 its concentration can be calculated. So, we can get C/C 0 − t map [Fig. 8(d)]. As can be seen from Fig. 8(d), 3D CA exhibits the best adsorption capacity and almost reaches saturation after about four hours of adsorption, similar to the results from Fig. 7.
The absorbance spectra of (a) 3D wet RF gel, (b) 3D RFA, and (c) 3D CA; (d) the adsorption capacity versus time curves of 3D wet RF gel, 3D RFA, and 3D CA.
Adsorption kinetic studies can provide valuable information on the mechanism of the adsorption process. To further elucidate the mechanism of the adsorption process, the pseudo-first-order and pseudo-second-order kinetic models were used. The experiment was performed at the initial phenol red indicator concentration of 8.1 mg/L. Figure 8 shows a very high adsorption value of 90%. The maximum amount of phenol red indicator adsorbed reaches to 0.497 mg/g. It is observed that the calculated qe values of the two kinetic models are all close to the experimental qe value (0.497 mg/g). High correlation coefficient (R 2) is found for the pseudo-second-order kinetics model.Reference Ai, Zhang, Liao, Wang, Li, Meng and Jiang50 Adsorption kinetics was controlled by the adsorption mechanism and rate-limiting step of the process.
In general, the adsorption of the phenol red indicator onto the adsorbent can occur through three consecutive steps: (i) the external diffusion stage depicting macropore (microlattice channel) or interparticle diffusion; (ii) the gradual adsorption until equilibrium is reached, where the adsorption is controlled by intraparticle diffusion; (iii) adsorption of phenol red indicator on the interior surface of the adsorbent (micro lattice channel). The third step is a fast and nonlimiting step in the adsorption process. The adsorption rate can be limited by the first and the second steps. So the microlattice channel is beneficial to the adsorption performances.
To further identify the processes of the adsorption of the phenol red indicator onto 3D CA, we apply the Weber’s intraparticle diffusion model. The parameters of Weber intraparticle diffusion model are shown in Table SIII. It can be seen in Fig. S3. The plot presents multilinearity suggesting that two steps exist in the adsorption process.Reference Ma, Chang, Zheng, Zhao and Ma51–Reference Hameed, Din and Ahmad54 The first linear region is the stage of the diffusion of phenol red indicator from solution to the external surface of 3D CA (microlattice channel diffusion). And the second linear region belongs to the stage of intraparticle diffusion of phenol red indicator through abundant voids of cross-linked 3D CA nanoscale skeleton. A number of millimeter channels increased by 3D printing can make the particles faster to the adsorbed mesopores. This ingenious combination helps improve the efficiency of adsorption and save raw materials. The 3D CA sample fully adsorbed the phenol red indicator in 250 min. It is easy to find that the k i,1 is almost four times larger than k i,2, indicating that the nanoscale skeleton diffusion is a gradual process. In Fig. S3, the plot can be divided into two stages and the two straight lines do not pass through the origin, which reveals that intraparticle diffusion is not the sole rate-limiting step in the adsorption process. The adsorption mechanism usually is controlled by interparticle diffusion and intraparticle diffusion. The higher specific surface area, appropriate hierarchical structure, and surface condition may attribute to the unique adsorption capacity of 3D CA, showing its potential for applying as the cell support.
IV. CONCLUSION
In this article, we explored a traditional RF sol–gel ink that can be used for 3D printing. We also built a printing platform. After that, we printed out microlattices with HCl atmosphere. The diameter of the sample after carbonization reached 0.22 mm. At the same time, three different processing samples were sorbent for DMEM adsorption test. In the experiment, we observed 3 groups of samples’ absorption spectrum and found that the absorption peak appeared at 558 nm and the three groups had different degrees of the adsorption effect. The final adsorption capacity of the 3D CA sample was close to 1 and the adsorption rate was the fastest in the meantime. Combined with the previous morphology and pore structure analysis, we found that the 3D CA sample had a good chain structure and a lot of millimeter-scale pores, the particle diameter was about 500 nm, and the porosity was higher than 3D RFA. At the same time, we found that in the BET analysis, 3D CA had more mesopores, which played a significant role in improving the adsorption effect. Thus 3D CA showed the best adsorption performance. Meanwhile, 3D printed structure made more micro lattice channels. Beyond that, the samples were aerogel, the skeleton structures were nanoscale and had many large pores. We can see clearly that the adsorption effect of 3D CA and 3D RFA is better than 3D wet RF. Lastly, the carbon aerogel nontoxic nature shows its potential for applying as the cell supports.
Supplementary Material
To view supplementary material for this article, please visit https://doi.org/10.1557/jmr.2018.104.
ACKNOWLEDGMENTS
We thank the financial support from the National Key Research and Development Program of China (2017YFA0204600) and Science and Technology Innovation Fund of Shanghai Aerospace, China (SAST201469). We would like to thank Prof. Lili Qin from Tongji University for her assistance.