


Prolactin (PRL) is a protein hormone released by the anterior pituitary that was originally named for its ability to promote lactation in response to the sucking stimulus. The role of PRL as a lactogenic agent in rodents has been well established (Neville et al., Reference Neville, McFadden and Forsyth2002). However, its role in the mammary gland of dairy cows remains controversial. The controversy arises from the fact that inhibiting PRL release with 80 mg/d bromocriptine (a dopamine agonist that suppressed PRL release) treatment for 2 d did not affect milk yield in dairy cows (Smith et al., Reference Smith, Beck, Convey and Tucker1974), but long-term suppression of PRL release by quinagolide significantly decreased the milk production of dairy cows (Lacasse et al., Reference Lacasse, Ollier, Lollivier and Boutinaud2016).
To clarify whether the inconsistent effect of PRL suppression in dairy cow lactation is due to the different experiment methods or different treatment time in vivo, and further clarify the role of PRL in dairy cow mammary gland during lactation, we cultured purified bovine mammary epithelial cells (BMECs) and treated them with PRL. The gene expression profile in BMECs was analyzed using RNA sequencing (RNA-seq) technology. Previous studies have successfully utilized sequencing technology to examine the changes of gene expression in mammary tissues of dairy cows during different physiological stages. Numerous differentially expressed genes (DEGs) and signaling pathways involved in mammary gland development and lactation have been identified (Lin et al., Reference Lin, Lv, Jiang, Zhou, Song and Hou2019). Our approach eliminates potential interference from other cell types or milking-induced PRL release in vivo, and thereby provides new evidence relating to the role of PRL in maintaining lactation in dairy cow mammary gland.
Materials and methods
The mammary epithelial cells were obtained from mammary tissues of 3 healthy lactating Holstein cows, as mentioned in a previous study (Lin et al., Reference Lin, Duan, Lv, Yang, Liu, Gao and Hou2018). The Northeast Agricultural University's Animal Experimentation Committee (approval number: 2019-2; Harbin, China) gave its approval to all animal experiments. The primary BMECs were cultured in DMEM/F 12 medium supplemented with 10% FBS, 100 U/ml penicillin, 100 mg/ml streptomycin, 5 μg/ml insulin, and 1 μg/ml hydrocortisone. Cytokeratin 18 (CK18) was measured in cells by immunofluorescence to ensure cell purity (Fig. 1a). The purified BMECs were incubated with 5 μg/ml PRL, as previously reported (Zhou et al., Reference Zhou, Jiang, Shi, Song, Hou and Lin2020) for 24 h. Then cells were collected for total RNA or protein extraction. Western blot was used to detect β-casein expression upon PRL stimulation RNA-Seq was conducted with RNA from PRL-treated cells and control cells. The DEGs analysis was performed using read count and DESeq software. Gene ontology (GO) enrichment analysis of DEGs was performed using the GOseqR software package. The DEGs significantly enriched in Kyoto Encyclopedia of Genes and Genomes (KEGG) pathways were examined using KOBAS 3.0. Detailed methodological information is provided in the online Supplementary File.
The effect of RPL on milk protein synthesis in bovine mammary epithelial cells. (a) The expression of Cytokeratin 18 (CK18) in bovine mammary epithelial cells, CK18 (green), DAPI (blue). Scale bar: 30 μm. (b) The protein expression of β-casein in bovine mammary epithelial cells. (c) The relative fold of β-casein was quantified by gray scale scan. Data were reported as the mean ± se from three independent experiments, ** P < 0.01.

Results and discussion
Previous studies in dairy cows have shown that mammary alveolar epithelial cells retain the ability of hormone-inducible milk protein gene expression. PRL, even in the absence of insulin and hydrocortisone, induces significant amounts of milk protein mRNA (Choi et al., Reference Choi, Keller, Berg, Park and Mackinlay1988). In the present study, we observed that PRL treatment markedly increased the protein level of β-casein in cultured BMECs (Fig. 1b and c), suggesting our cell model is suitable to investigate the role of PRL in maintaining lactation.
We utilized RNA-seq technology to detect the expressed genes induced by PRL in BMECs. A total of 375 DEGs, including 165 up-regulated and 210 down-regulated genes (online Supplementary Tables S1 and S2), were harvested in PRL-treated group compared to the control group based on a false discovery rate (FDR) <0.05. GO enrichment analysis of the up-regulated genes identified 29 relevant GO items. These up-regulated GO terms were mainly associated with positive regulation of the glycolytic process, the cell migration process and the protein biosynthetic process (Fig. 2a). Conversely, GO enrichment analysis of the down-regulated genes revealed 24 significant GO terms. These terms were primarily involved in the negative regulation of biological processes and cytokine receptor activity (Fig. 2b). The up-regulated GO terms suggested that PRL stimulation upregulated the utilization of glucose as well as enzymes related to milk fat and milk protein biosynthesis. It appeared that PRL plays a galactopoietic role in BMECs by improving anabolism and energy utilization.
Gene Ontology analysis and KEGG enrichment bubble chart of differentially expressed genes. (a) The up-regulated genes in Gene Ontology analysis. (b) The down-regulated genes in Gene Ontology analysis. The ordinate represents the GO terms, the abscissa represents the number of genes. The length of column represents the number of genes contained in the particular class, the longer the column indicate the more genes. Different colors represent -log10 (P-value), the redder the color, the smaller the -log10 (P-value). (c) 7 significant up-regulated pathways in KEGG enrichments. (d) 6 significant down-regulated pathways in KEGG enrichments. The ordinate represents the KEGG pathways and the abscissa represents the rich factor. The size of circles represents the number of genes contained in the particular class, the larger the circle indicate the more genes. The different colors represent the -log (P-value), the redder the circles indicate the higher -log (P-value).
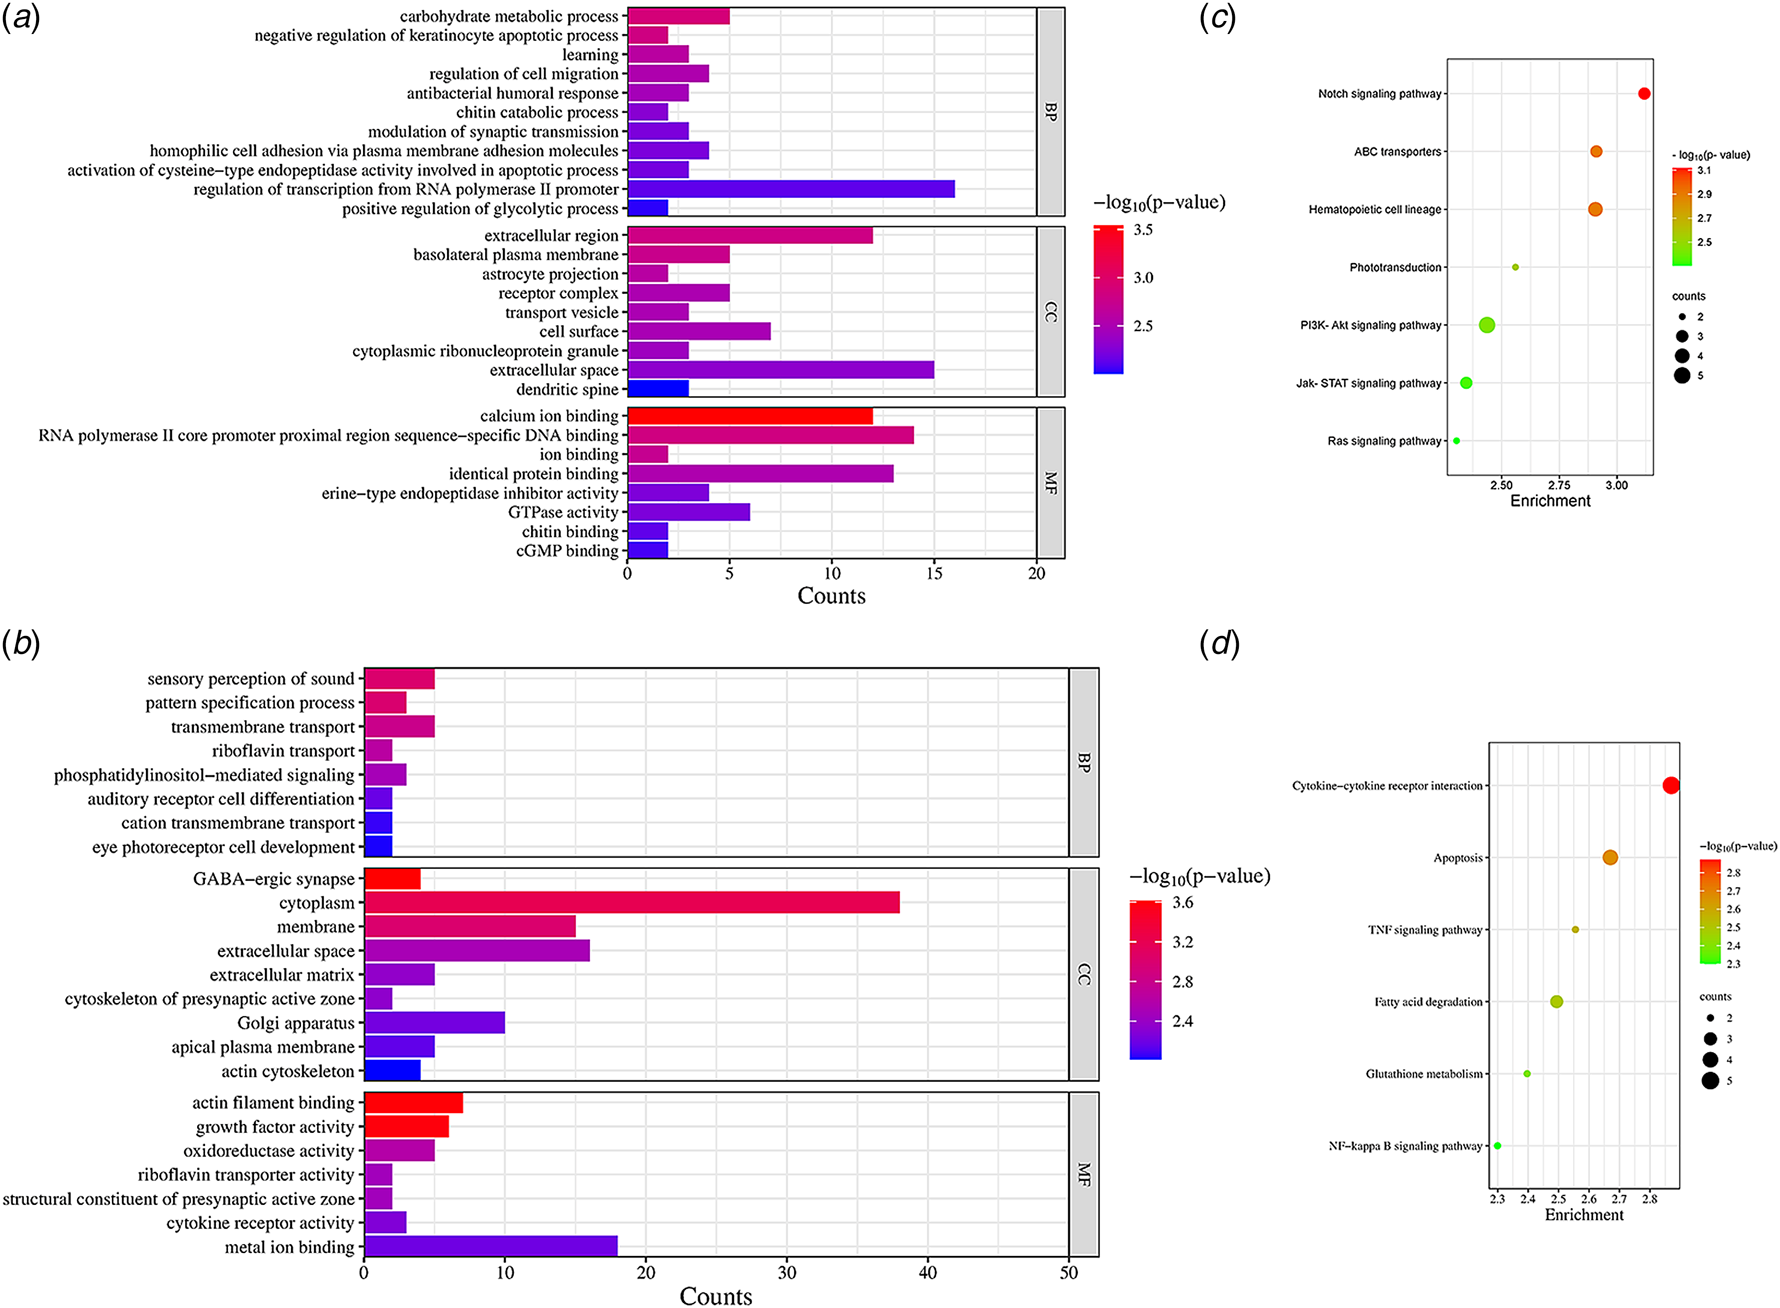
KEGG signaling pathway enrichment analysis revealed 7 significant pathways with up-regulated genes (Fig. 2c), and 6 pathways with down-regulated genes (Fig. 2d). As shown in Fig. 2c and d, the Rap1, Notch, Ras and JAK-STAT signaling pathways were up-regulated, while the apoptosis pathway was down-regulated. The JAK2-STAT5 signaling pathway is the well-demonstrated pathway responsible for PRL activation in mammary tissues. A study in human mammary epithelial cells MCF-12A showed that PRL up-regulated β-casein expression by activating the JAK2-STAT5 signaling pathway through binding to the long isomers of the prolactin receptor on cell membranes (Chiba et al., Reference Chiba, Kimura, Takahashi, Morimoto, Sanbe, Ueda and Kudo2014). The up-regulation that we observed in BMECs is agreement with the galactopoietic role of PRL in lactation. Rap1 and Ras, small molecule GTP-binding proteins, stimulated cell proliferation and differentiation by activating the ERK1/2 signaling pathway via the Raf protein (Yonezawa et al., Reference Yonezawa, Haga, Kobayashi, Katoh and Obara2008). Up-regulation of Rap1 and Ras that we observed suggests that PRL signaling may increase and maintain the number of differentiation epithelial cells in vitro, which is important for maintaining lactation. Previous studies have reported that the Notch signaling pathway activated AKT and inhibited apoptosis in human mammary epithelial cells (Meurette et al., Reference Meurette, Stylianou, Rock, Collu, Gilmore and Brennan2009). Consistent with this, our data also showed that PRL could activate the Notch signaling pathway to prevent cell death. Moreover, we observed that PRL stimulation down-regulated apoptosis, that coincided with the function of PRL in maintaining BMEC survival by suppressing the activation of apoptosis signaling. Furthermore, KEGG also revealed an enrichment of the ABC transporter pathway. This pathway involves the transmembrane transport of lipids or lipid-related complexes, which is dependent on ATP catabolism for energy.
In conclusion, our study demonstrated that PRL has a positive effect on the expression of genes related to lactation in BMECs. This study provides new evidence about the molecular regulatory mechanisms that occur during PRL-stimulated lactation in dairy cows, enabling further investigation of the mechanisms underlying PRL related galactopoiesis in dairy cows.
Supplementary material
The supplementary material for this article can be found at https://doi.org/10.1017/S0022029924000554
Acknowledgments
This work was supported by grants from the National Natural Science Foundation of China (31771453 to Y. L., and 32402707 to Y. Y.), the Postdoctoral Funding (88657500) and the Young Talents Project of the Northeast Agricultural University (54970212,China). The authors declare no competing financial interest.



