



1. Introduction
A plume consists of light fluid that rises in an ambient fluid having relatively larger density or, equivalently, of a dense fluid that descends in a lighter ambient fluid, these cases being physically equivalent in a Boussinesq fluid. In most environmental and industrial circumstances, plumes are turbulent and so entrain ambient fluid as they rise or descend. This serves both to reduce the density contrast between the plume and ambient fluid and also to lower the vertical speed of the plume with distance from its source. Morton, Taylor & Turner (Reference Morton, Taylor and Turner1956) derived an elegant model predicting the vertical change in volume and momentum fluxes (and consequently the change in radius, vertical velocity and buoyancy) of a statistically steady turbulent axisymmetric plume in a stationary, uniform density ambient fluid. Their model assumed that the radial speed of ambient fluid being drawn into the plume at a particular height was proportional to the vertical speed of the plume itself at that height. As such, the ambient fluid played a passive role by supplying fluid, but otherwise had no dynamic influence on the plume evolution. Observations of plumes emanating from hydrothermal vents in the oceanic abyss (Lupton et al. Reference Lupton, Delaney, Johnson and Tivey1985) as well as those associated with deep convective wintertime mixing in high-latitude seas (MEDOC Group 1970; Clarke & Gascard Reference Clarke and Gascard1983; Schott & Leaman Reference Schott and Leaman1991) motivated laboratory experiments (Maxworthy & Narimousa Reference Maxworthy and Narimousa1994; Whitehead, Marshall & Hufford Reference Whitehead, Marshall and Hufford1996; Fernando, Chen & Ayotte Reference Fernando, Chen and Ayotte1998) and simulations (Jones & Marshall Reference Jones and Marshall1993; Pal & Chalamalla Reference Pal and Chalamalla2020) that examined the influence of background rotation upon convection from a localized or distributed source. In studies of convection from a localized source, it was predicted that if the ambient fluid was sufficiently deep, then the Rossby number associated with the fluid in the plume (measuring the importance of inertia to the Coriolis acceleration) would become order unity at a distance  $H_f\equiv (B_0/f^3)^{1/4}$ from an effective point source, in which
 $B_0$ is the buoyancy flux and
 $f$ is the Coriolis parameter, equal to twice the background angular rotation frequency:
 $f=2\varOmega$ (Jones & Marshall Reference Jones and Marshall1993; Fernando et al. Reference Fernando, Chen and Ayotte1998). Beyond this point, the plume exhibited noticeable anticyclonic rotation as it ceased to expand radially. In addition to suppressing ambient fluid entrainment, rotation suppressed three-dimensional turbulent motions, effectively laminarizing the plume beyond the distance
 $H_f$ (Speer & Marshall Reference Speer and Marshall1995). The resulting column of dense rotating fluid was prone to baroclinic instability, resulting in the breakup of the column into eddies.
In the case of deep-ocean convection, the ratio of the width to the depth of the convecting region is large, and so one may not expect the dynamic influence of the ambient fluid to be significant. However, the 2010 Deepwater Horizon accident in the Gulf of Mexico has inspired renewed interest in the dynamics of rotating plumes. Over the course of 87 days, oil was continuously discharged at the ocean floor, rising as a plume from an effective point source. The pathway of oil toward the surface was influenced by the multiphase composition of the effluent, the ambient stratification and likely by the Earth's rotation (Fabregat Tomàs et al. Reference Fabregat Tomàs, Dewar, Özgökmen, Poje and Wienders2015; Deremble Reference Deremble2016; Fabregat Tomàs et al. Reference Fabregat Tomàs, Poje, Özgökmen and Dewar2016, Reference Fabregat Tomàs, Deremble, Wienders, Stroman, Poje, Özgökmen and Dewar2017; Frank et al. Reference Frank, Landel, Dalziel and Linden2017, Reference Frank, Landel, Dalziel and Linden2021). Through numerical simulations examining a moderate Rossby number plume impinging upon a stratified layer, Fabregat Tomàs et al. (Reference Fabregat Tomàs, Poje, Özgökmen and Dewar2016) noted that rotation acted over time to set up an adverse vertical pressure gradient within the plume that caused the fluid near the source to be deflected from the vertical and consequently to precess anticyclonically. This deflection and anticyclonic precession was also observed in laboratory experiments of saline plumes (Frank et al. Reference Frank, Landel, Dalziel and Linden2017) and bubble plumes (Frank et al. Reference Frank, Landel, Dalziel and Linden2021) in a rotating uniform density ambient fluid. They found the mean precession frequency to be approximately  $0.2f =0.4\varOmega$.
The observation of the deflection and precession of a rotating plume suggests the ambient flow near the plume may play a more dynamic role in the plume evolution than simply being a source of entrained fluid. In part, the radial flow of ambient fluid toward the entraining plume would be deflected by Coriolis forces so as to set up a cyclonic circulation around the plume, which could act to suppress entrainment (Helfrich & Battisti Reference Helfrich and Battisti1991; Fernando et al. Reference Fernando, Chen and Ayotte1998). In a recent numerical examination of laminar rotating plumes emanating from the base of a cylindrical domain, Martins, Pereira & Pereira (Reference Martins, Pereira and Pereira2020) noted inward spiralling motion toward the source in the bottom boundary layer of the domain. Such spiralling motion is anticipated at all depths surrounding a turbulently entraining plume. Furthermore, because a plume differentially entrains fluid with depth, the radial motion of the ambient is expected to have vertical shear. However, the relatively slow far-field ambient motion is strongly influenced by rotation, which has the effect of suppressing vertical shear. Therefore the ambient flow is horizontally divergent, and this necessarily should lead to vertical motion in the vicinity surrounding the plume. These motions and their consequent impact upon the plume evolution near the source are examined in detail here. In particular, we show that, under some circumstances, the ambient cyclonic circulation that builds up around the plume can act effectively to reduce the local Rossby number so as to quasi-laminarize the plume first near the source and then extending far from the source to form a coherent vortex, which we refer to as a ‘tornado’. For example, figure 1 shows snapshots taken from two experiments of rotating plumes, one in which a tornado forms (figure 1a) and one with similar parameters in which the plume ultimately precesses with no tornado formation (figure 1b). Generally, in experiments for which the plume started to precess, no tornado eventually formed. However, if a tornado did develop before the plume began to precess, then it would persist typically for a minute. The formation of tornados occurred most often in experiments and simulations of ‘lazy’ plumes meaning that the momentum flux relative to the buoyancy flux at the source was smaller than that of a pure plume (Hunt & Kaye Reference Hunt and Kaye2005).
Side-view snapshots of rotating plume experiments in which the dyed plume (a) develops into a tornado (four left-most panels) and (b) begins to precess without forming a tornado (three stacked images on the right). The experiment shown in (a) has the parameters given by C1 in table 1. Each image in (a) shows an area around the plume that is 30 cm wide and 80 cm deep with the nozzle at the top of each frame. The experiment shown in (b) has the same parameters as C1 except that the source reduced gravity,  $g_0^{\prime }=47\ \mbox {cm}\ {\mbox {s}}^{-2}$, is
 $4\ \mbox {cm}\ {\mbox {s}}^{-2}$ smaller. Only the flow to a depth 15 cm below the source is shown in these cases. In both experiments the background rotation is
 $\varOmega =0.4\ {{\mbox {s}}^{-1}}$. In (a) the horizontal dark feature near the top of the images shows where the surface (seen from below) intersects the rear wall of the tank.

Parameters and analysis results for experiments in which a tornado was observed: fluid depth below nozzle ( $H_0$), background rotation (
 $\varOmega$, whose units,
 ${{\mbox {s}}^{-1}}$, denote radians per second), source mean velocity (
 $w_0$), source reduced gravity (
 $g_0^{\prime }$), source Rossby number (
 ${\textit {Ro}}_0$), source buoyancy parameter (
 ${\mathcal {B}}_0$), source Reynolds number (
 $\textit {Re}_0$), depth predicted by (2.15) where rotation directly influences the corresponding pure plume (
 $H_f$), time for onset of tornado (
 $T_t$), distance of tornado centroid from
 $z$-axis (
 $r_c$), maximum azimuthally averaged azimuthal velocity of tornado (
 $U_{\theta t}$) and radius from centroid where
 $U_{\theta t}$ is largest (
 $b_{\theta t}$). In starred experiments, the tornado developed only briefly before being deflected off axis and devolving back into a turbulent flow. In the daggered experiments, the plume descends into a two-layer fluid with a fresh water upper layer depth
 $H_1=8$ cm and saline fluid below. Dashes indicate that measurements were unavailable.

The paper is organized as follows. Some basic theoretical concepts for plumes and rotational effects are reviewed in § 2. In § 3, the set-up and analysis of experiments are described with some quantitative results presented therein, specifically the characterization of which source parameters could result in tornado formation. The details of the numerical simulations and the analysis of their results are given in § 4. In light of the experiment and simulation analyses, in § 5 we schematically illustrate the processes involved with the evolving plume and eventual tornado formation, should it occur, and we provide general conditions leading to possible tornado formation. Conclusions are provided in § 6.
2. Theoretical preliminaries
Here, we review theories essential for the interpretation and analysis of the experiments and simulations. The transient dynamics of the starting plume has no influence on the eventual deflection and possible formation of a tornado developing near the source, as evident in figure 1(a) and shown later by way of numerical simulations. For this reason, we begin with the theory for established plumes. First we review the theory for statistically steady pure and lazy plumes in a stationary ambient. Thereafter we consider the influence of rotation upon plumes and the surrounding ambient fluid.
2.1. Plume theory
In the absence of rotation, the properties of a statistically steady pure plume can be estimated from the Morton–Taylor–Turner (MTT) model of Morton et al. (Reference Morton, Taylor and Turner1956). For convenience, we suppose the plume consists of buoyant fluid rising from a localized source.
In a uniform density ambient fluid, the reduced gravity,  $g^\prime$, and vertical velocity,
 $w$, of the plume are here assumed to have a Gaussian structure with radius, r, from the centreline such that
 \begin{equation} w(z,r) = w_c(z)\exp({-}r^2/b^2),\quad g^\prime(z,r) = g_c^{\prime}(z)\exp({-}r^2/b^2), \end{equation}
in which  $b=b(z)$ is a measure of the plume width (assumed to be the same for both
 $w$ and
 $g^\prime$) that changes with vertical distance,
 $z$, from the source, as shown in figure 2(a). The centreline velocity,
 $w_c$, and reduced gravity,
 $g_c^{\prime }$, as well as
 $b$ satisfy the coupled equations (Morton et al. Reference Morton, Taylor and Turner1956)
 \begin{equation} \frac{\textrm{d}}{\textrm{d}z} ( b^2 w_c ) = 2 \alpha b w_c,\quad \frac{\textrm{d}}{\textrm{d}z} ( b^2 w_c^2 ) = 2 b^2 g_c^{\prime}, \quad B_0 \equiv \frac{1}{2} {\rm \pi}b^2 w_c g_c^{\prime} = \mbox{const.}, \end{equation}
respectively representing conservation of mass, momentum and buoyancy. In the last equation the buoyancy flux,  $B_0$, is unchanging with distance from the source because the ambient fluid has uniform density. The entrainment constant,
 $\alpha$, can vary depending on whether the flow is a jet (
 $g_c^{\prime }=0$) or plume, with a typical value for the latter being
 $\alpha \simeq 0.1$. A pure plume with a finite-sized source at
 $z=0$ can be modelled as originating from a point source of buoyancy below the nozzle at
 $z=-Z_v$, as illustrated schematically in figure 2(a). A self-similar solution of (2.2a–c) can be found by recasting the equations in terms of a new vertical coordinate
 $Z =z+Z_v$, so that
 $Z=0$ at the point source. Thus we find the following:
 \begin{equation} b=\frac{6\alpha}{5} Z,\quad w_c = \left(\frac{25}{12{\rm \pi}}\frac{1}{\alpha^2}\right)^{1/3} B_0^{1/3} Z^{{-}1/3},\quad g_c^{\prime} = \frac{2}{3} \left(\frac{25}{12{\rm \pi}}\frac{1}{\alpha^2}\right)^{2/3} B_0^{2/3} Z^{{-}5/3}. \end{equation}
The corresponding volume and momentum fluxes obey the respective power laws
 \begin{equation} \left.\begin{gathered} Q(Z) = {\rm \pi}b^2 w_c = 3 \left[\frac{12{\rm \pi}}{25}\alpha^2\right]^{2/3} B_0^{1/3} Z^{5/3},\\ M(Z) = \frac{1}{2}{\rm \pi} b^2 w_c^2 = \frac{3}{2} \left[\frac{12{\rm \pi}}{25}\alpha^2\right]^{1/3} B_0^{2/3}Z^{4/3}. \end{gathered}\right\}\end{equation}
Schematic showing the variables used to describe (a) a pure plume ( $\mathcal {B}_0=1$) and (b) a lazy plume (
 $\mathcal {B}_0\gg 1$) for a finite source of radius
 $b_0$ situated at
 $z=0$.

A plume originating from a nozzle of finite radius,  $b_0$, with volume flux
 $Q_0$ has mean vertical velocity at the source of
 $w_0 = w_{c0} = Q_0/({\rm \pi} b_0^2)$, in which
 $w_{c0}=w_c(z=0)$. The corresponding source Reynolds number,
 $\textit {Re}_0\equiv w_0 b_0/\nu$, is assumed to be sufficiently large (
 $\textit {Re}_0\gtrsim 100$) that the flow is turbulent. Here,
 $\nu$ is the kinematic viscosity of the source fluid, which differs negligibly from that of the ambient fluid. The source buoyancy relative to the source momentum is assessed by the source buoyancy parameter,
 ${\mathcal {B}}_0$, (sometimes referred to as a source Richardson number) defined by (e.g. see Hunt & Kaye Reference Hunt and Kaye2005)
 \begin{equation} {\mathcal{B}}_0 \equiv \frac{5}{4\alpha} \frac{g_{c0}^{\prime} b_0}{w_0^2}, \end{equation}
in which  $g_{c0}^{\prime } = g_c^{\prime }(z=0)$. In experiments, the fluid leaving the source has constant reduced gravity,
 $g_0^{\prime }$, across the source of radius
 $b_0$. This is related to the centreline reduced gravity of a Gaussian plume at the source by
 $g_0^{\prime }=g_{c0}^{\prime }/2$. The flow from a finite-sized source is equivalent to that of a pure plume if
 ${\mathcal {B}}_0=1$, in which case the nozzle opening is located at a distance
 $Z_v=5b_0/(6\alpha )$ above the virtual point source, so that
 $Z=z+Z_v$ (see figure 2a).
If  ${\mathcal {B}}_0>1$, the plume is said to be ‘lazy’. In this circumstance there is a deficit of momentum compared to buoyancy relative to their ratio in a pure plume (Caulfield Reference Caulfield1991; Hunt & Kaye Reference Hunt and Kaye2001, Reference Hunt and Kaye2005). For a lazy plume, the vertical velocity initially increases upon leaving the nozzle as the plume adjusts its momentum flux relative to its buoyancy flux through reducing or even suppressing entrainment until the local,
 $z$-dependent plume buoyancy parameter,
 \begin{equation} {\mathcal{B}}_{{p}}(z) \equiv \frac{5}{4\alpha} \frac{g_c^{\prime} b}{w_c^2}, \end{equation}
approaches that of a pure plume:  ${\mathcal {B}}_{{p}}\rightarrow 1$. The maximum vertical velocity,
 $w_{c,{max}}$, is reached at a distance from the source where
 ${\mathcal {B}}_{{p}}=5/4$, so that
 \begin{equation} w_{c,{max}} = \frac{4^{2/5}}{5^{1/2}} \frac{{{\mathcal{B}}_0}^{1/2}}{({\mathcal{B}}_0-1)^{1/10}} w_0 \simeq 0.78 \frac{{{\mathcal{B}}_0}^{1/2}}{({\mathcal{B}}_0-1)^{1/10}} w_0. \end{equation}
The location,  $z_v$, of the virtual origin of the far-field pure plume is situated above the source if
 ${\mathcal {B}}_0$ is sufficiently large; its location is close to where
 $w_c(z)=w_{c,{max}}$.
An alternate definition of the effective source vertical velocity,  $w_{0,{eff}}$, is used in the analysis of the numerical simulations of lazy plumes presented here. The location of the virtual origin of the far-field pure plume is calculated by performing Gaussian fits to the azimuthally averaged perturbation density to measure
 $b(z)$. Far from the source, the flow behaves like a pure plume so that
 $b(z)$ increases linearly with distance from the source. The distance between the source and the virtual origin,
 $z_v$, is thus found by extrapolating linear fits to
 $b(z)$ toward the source to where
 $b=0$. We define the effective source to be located a distance
 $Z_v= 5b_0/(6\alpha )$ above the virtual origin. This is where the equivalent pure plume has the same radius,
 $b_0$, as the source (see figure 2b). To get the vertical velocity at the effective source, the volume and momentum fluxes are measured as functions of
 $Z\equiv z-z_v$ and fit to power laws far above
 $Z=0$. Using (2.4), the vertical velocity at the effective source is given by
 \begin{equation} w_{0,{eff}} = 2 M(Z=Z_v)/Q(Z=Z_v).\end{equation}
In practice, the prediction (2.7) is found to be close to the measured estimate using (2.8). On this basis, we suppose  $w_{c,{max}}\simeq w_{0,{eff}}$ and use (2.8) to characterize the effective source vertical velocity.
In the case of extremely lazy plumes,  ${\mathcal {B}}_0\gg 1$, Hunt & Kaye (Reference Hunt and Kaye2005) derived approximate formulae for the change with
 $z$ of fluxes near the source. In particular, they showed that the vertical velocity increases with distance
 $z$ from source according to
 \begin{equation} w_c \simeq w_0 (1 + 4 g_c^{\prime} z/w_0^2)^{1/2}, \end{equation}
a result that could be derived from the MTT equations (2.2a–c) by setting the entrainment coefficient,  $\alpha$, to zero, in which case
 $g_c^{\prime }$ is constant. Hence, even for a moderately lazy plume, entrainment is expected to be reduced between the source and
 $z=z_{v}$, if not suppressed altogether if
 ${\mathcal {B}}_0\gg 1$.
2.2. Effects of rotation
Assuming axisymmetry, the equations for continuity and radial and azimuthal momentum conservation for an inviscid fluid are given, respectively, by
 $$\begin{gather} \frac{1}{r}\frac{\partial (r u_r)}{\partial r} +\frac{\partial w}{\partial z} = 0, \end{gather}$$
 $$\begin{gather}\frac{\partial u_r}{\partial t} ={-} u_r \frac{\partial u_r}{\partial r} - w \frac{\partial u_r}{\partial z} + f u_\theta + \frac{1}{r} {u_\theta}^2 - \frac{\partial P}{\partial r}\simeq f u_\theta + \frac{1}{r} {u_\theta}^2 - \frac{\partial P}{\partial r}, \end{gather}$$
 $$\begin{gather}\frac{\partial u_\theta}{\partial t} ={-} w \frac{\partial u_\theta}{\partial z} -(f +\zeta) u_r \simeq{-}f u_r, \end{gather}$$
in which  $f=2\varOmega$ is the Coriolis parameter, defined in terms of the background angular velocity
 $\varOmega$. Here, we have defined
 $P\equiv p/\rho _a$ to be the dynamic pressure normalized by the ambient fluid density, and
 $\zeta =[\partial _r (ru_\theta )]/r$ to be the vertical component of vorticity. The right-most approximations in (2.11) and (2.12) assume that outside the plume the advection terms and vertical vorticity are negligible, consistent with the Rossby number characterizing the ambient flow being small (Vallis Reference Vallis2006). These approximations are confirmed by analysis of numerical simulations.
The relative importance of the Coriolis force acting on an eddy within the plume having size of the order  $b$ and speed of the order of the centreline vertical velocity,
 $w_c$, is typically assessed by a
 $z$-dependent Rossby number defined as (Speer & Marshall Reference Speer and Marshall1995; Fernando et al. Reference Fernando, Chen and Ayotte1998)
 \begin{equation} {\textit{Ro}}(z)\equiv \frac{w_c(z)}{f\kern0.06em b(z)}. \end{equation}
Above the virtual origin (possibly lying above the source if the plume is sufficiently lazy),  ${\textit {Ro}}(z)$ decreases with distance from the source as
 $w_c$ decreases and
 $b$ increases with increasing
 $z$. Where the Rossby number is large, we may assume that Coriolis forces negligibly influence the turbulent motions in the plume. Therefore, an explicit estimate of the Rossby number associated with a pure plume is found by substituting (2.3a–c) into (2.13)
 \begin{equation} {\textit{Ro}}(Z) = \frac{5}{6\alpha f} \left(\frac{25}{12{\rm \pi}}\frac{1}{\alpha^2}\right)^{1/3} \frac{B_0^{1/3}}{Z^{4/3}} \approx 33.7 \frac{B_0^{1/3}}{f\ Z^{4/3}}, \end{equation}
in which  $Z$ is the distance from the virtual origin (see figure 2a). In the second expression we have taken
 $\alpha \approx 0.1$. Although (2.14) is formally valid only where
 ${\textit {Ro}}(Z)\gg 1$, it implicitly provides an estimate of the distance above the virtual origin where rotation begins to influence the motion within the plume, namely where
 ${\textit {Ro}}(Z) \sim 1$.
Experiments by Fernando et al. (Reference Fernando, Chen and Ayotte1998) showed that the radius of a plume ceased to widen after reaching a critical distance from the virtual origin
 \begin{equation} H_f \simeq (5.5 \pm 0.5) \left(\frac{B_0}{f^3}\right)^{1/4}. \end{equation}
Substituting this into (2.14) gives the corresponding Rossby number at this distance to be approximately  ${\textit {Ro}}_c\simeq 3.4$. Thus, at least during its initial evolution, rotation has negligible influence upon the plume at distances where
 ${\textit {Ro}}\gg {\textit {Ro}}_c$.
Although turbulence and entrainment into the plume are unaffected by rotation where the Rossby number is sufficiently large, swirl may nonetheless accumulate in the plume. Here we define the swirl,  $q$, to be the ratio of the maximum azimuthally averaged azimuthal velocity,
 $U_{\theta }(z,t)$, to the centreline vertical velocity,
 $W_c(z,t)$, within the plume. (Capital letters are used to emphasize that these are time- as well as height-dependent fields.) If we suppose that the approximation in (2.12) holds close to the edge of the plume then, at least during its early evolution when the vertical velocity is nearly constant in time,
 $q$ should increase linearly with time according to
 \begin{equation} q\equiv U_\theta/W_c \sim \alpha_{{B}} f t, \end{equation}
in which  $\alpha _{{B}}$ is an entrainment coefficient. For a lazy plume,
 $\alpha _{{B}}$ should increase with
 $z$ from a reduced value where
 ${\mathcal {B}}_{{p}}\gg 1$ near the source to the usual
 $\alpha \simeq 0.1$ where the flow acts more like a pure plume (though at sufficiently small distances such that
 ${\textit {Ro}}\gg {\textit {Ro}}_c$). Corresponding to the increase in swirl, there should be a linear increase in time of the characteristic vertical vorticity,
 $\zeta_{\theta} \sim 2U_\theta /b_\theta$, within the plume, in which
 $b_\theta$ is the radius at which the azimuthal velocity equals
 $U_\theta$. Thus we define a plume Rossby number that depends on time as well as
 $z$
 \begin{equation} \textit{Ro}_{{p}}(z,t) = \frac{|(U_\theta,W_c)|}{(f+\zeta_{\theta}) b_\theta}, \end{equation}
in which  $|(U_\theta ,W_c)| = (U_\theta ^2+W_c^2)^{1/2}$. We expect the entrainment of swirl into the plume given by (2.16) should hold at sufficiently small distances and short times that
 $\textit {Ro}_{{p}}\gg {\textit {Ro}}_c$.
Provided  $\textit {Ro}_{{p}}$ is large, an estimate of the time at which the vorticity in the plume becomes comparable to
 $f$ is
 $b_\theta /(2\alpha _{{B}} w_c)\propto B_0^{-1/3} Z^{4/3}$. Close to the source this time is relatively short, and so there should be a range of times for which
 $f$ can be neglected in the denominator of (2.17) while
 $\textit {Ro}_{{p}}$ remains large. In this case, the plume Rossby number is simply represented in terms of the swirl by
 $\textit {Ro}_{{p}} \simeq (1+q^2)^{1/2}/(2q)$. By extrapolation, the condition
 $\textit {Ro}_{{p}}\simeq {\textit {Ro}}_c$ gives a critical condition on the swirl for which rotation (including vorticity) significantly influences the plume:
 $q = q_c\simeq 0.15$. By crude extrapolation of (2.16) using
 $\alpha _{{B}}\simeq 0.1$, this occurs in a relative time
 $ft \simeq 1.5$, or about a tenth of a period of background rotation. The time is expected to be longer near the source of a lazy plume where
 $\alpha _{{B}}$ in (2.16) is smaller.
Consideration of the plume alone is insufficient to encapsulate this problem. This is because the inhibition of vertical motion in the plume where  $\textit {Ro}_{{p}}\sim {\textit {Ro}}_c$ results in radial outflows that affect the evolution of the surrounding ambient fluid. This in turn affects the flow surrounding the source. For example, the radial velocity field surrounding a non-rotating pure plume is given by
 \begin{equation} u_r(r,Z) ={-}\alpha \frac{b w_c}{r} \propto \frac{Z^{2/3}}{r}, \quad r\gg b(Z). \end{equation}
The inverse radial dependence of the radial velocity follows immediately from (2.10) if one assumes there is no vertical strain in the ambient fluid. This flow exhibits vertical shear, which is inhibited in the presence of strong background rotation, as assessed by the spatial- and time-dependent ambient Rossby number
 \begin{equation} \textit{Ro}_{{a}}(r,z,t) = \frac{\overline{|\boldsymbol{u}_h|}}{f r}, \end{equation}
in which  $\boldsymbol {u}_h = (u_r,u_\theta )$ and the overline denotes azimuthal averaging. As will be shown, the vorticity and vertical velocity in the ambient fluid are negligible compared respectively with
 $f$ and
 $|\boldsymbol {u}_h|$, and so are not included in the definition of
 $\textit {Ro}_{{a}}$. Clearly
 $\textit {Ro}_{{a}}$ is smaller with increasing radius
 $r$ due both to the presence of
 $r$ in the denominator and also due to the decrease in the horizontal velocity with radial distance, as in (2.18). Far from the plume where the flow is slow and the corresponding ambient Rossby number is small, the flow is expected to be nearly invariant in the vertical. Near the plume, vertical shear is expected due to the differential horizontal entrainment with
 $z$, as in (2.18). Furthermore, the radial pressure gradient is not expected to be negligible because it changes in response to Coriolis and centripetal forces. As a consequence of all these effects, we will show that there is vertical strain in the ambient fluid, which modifies the power law dependence of
 $u_r$ upon
 $r$ from the inverse relationship in (2.18). We will also show that the magnitude of
 $u_r$ well outside the plume at fixed
 $r$ and
 $z$ increases linearly in time, in contrast with non-rotating plumes for which
 $u_r$ is time independent. Hence, from (2.12), the ambient azimuthal velocity increases quadratically in time, in contrast with the linear increase in time of the azimuthal velocity within the plume, as predicted by (2.16).
3. Laboratory experiments
Although the theory above and simulations which follow describe an upward propagating plume of buoyant fluid, in laboratory experiments it is convenient to inject negatively buoyant (saline) fluid downward into a fresh water ambient fluid in solid body rotation, as illustrated in figure 3. Under the Boussinesq approximation, the dynamics governing the evolution of an upward-advancing buoyant plume and a downward-advancing negatively buoyant plume are the same.
Schematic showing the set-up of the laboratory experiments and indicating symbols used to represent the experiment parameters. The reservoir position here corresponds to the M and C experiments; for the A and L experiments, the reservoir was instead situated below the tank and fluid was fed by means of a peristaltic pump.

The experiments were performed in four institutions (designated by ‘A’ – U. Alberta, ‘C’ – U. Cambridge, ‘L’ – ENS de Lyon and ‘M’ – U. Aix-Marseille). The tank geometries, injection methods and visualization tools differed at each institution, with details of each set-up being described in Appendix A.
Of the nearly 300 experiments that were performed, a tornado was found to develop in 56 instances. In the other experiments, the plume eventually deflected from the vertical and began to precess (e.g. see Frank et al. Reference Frank, Landel, Dalziel and Linden2017). Table 1 lists the 32 distinct parameters of experiments in which tornados formed. The other 24 experiments resulting in tornado formation had identical parameters to some of those listed in table 1. The manifestation of a tornado was found to be repeatable particularly in the L-experiments. This is believed to be a consequence of the long (2 h) spin-up times and the cylindrical inner tank geometry, both of which ensured solid body rotation was achieved well before the start of an experiment (Greenspan & Howard Reference Greenspan and Howard1963).
3.1. Ambient motion induced by the plume
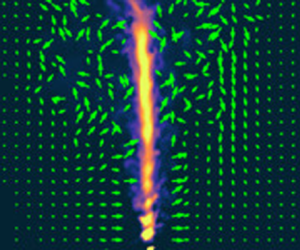
Images from two experiments with and without rotation are shown in figure 4. Here, the plume is visualized by fluorescent dye and the ambient motion is visualized by streaks caused by particles (hollow glass microspheres) passing through a vertical laser light sheet oriented beneath the plume source. Whereas in the non-rotating case (figure 4a) the ambient flow is primarily horizontal toward the plume as expected, the flow in the rotating case for which no tornado developed (figure 4b) exhibits strong vertical circulations associated with the deflection of the plume from the vertical. At the time shown in figure 4(b) the plume is deflected leftward and behind the laser light sheet. In the vertical plane of the light sheet, the ambient flow is carried leftward and upward along the right flank of the deflected plume. This observation may seem surprising since background rotation is expected to inhibit, not enhance vertical motion. It is clear that, with rotation, the ambient fluid does not simply respond to the plume as a localized vertical line sink where the horizontal velocity converges.
Side view of M-experiments with  $H_0=21.5$ cm,
 $Q_0=0.26\ {\mbox {cm}}^3\ \mbox {s}^{-1}$,
 $\rho _0=1.067\ \mbox {g}\ {\mbox {cm}}^{-3}$ and (a) with no background rotation at
 $t=60$ s and (b) with
 $\varOmega =0.33\ {{\mbox {s}}^{-1}}$ at
 $t=20$ s. The left panels show a vertical cross-section through the plume illuminated by a laser light sheet. Velocity vectors computed by PIV are superimposed provided the speed was less than
 $1\ \mbox {cm}\ \mbox {s}^{-1}$. The right panels show particle streak images composed by averaging successive frames over time ((a)
 $50\leqslant t\leqslant 60\ \textrm {s}$; (b)
 $20\leqslant t\leqslant 25\ \textrm {s}$). The horizontal band near
 $z=-6\ \textrm {cm}$ in each plot is the remnant of the horizontal laser light sheet whose image was mostly removed by a filter on the side-view camera.

3.2. Azimuthal flow around a tornado
Figure 5 shows the particle image velocimetry (PIV) computed vertical and horizontal velocity fields from three L-experiments. In these experiments the background rotation is clockwise as seen from above ( $\varOmega <0$). Because the plume was not dyed in the L-experiments, the location of the plume in the vertical (top row) and horizontal (middle row) is instead visualized by a grey scale showing the measured speed of the flow. Arrows indicate the motion of the surrounding ambient fluid.
Velocities measured using PIV in three L-experiments showing (a) no tornado formation in weak background rotation and moderate volume flux (left column), (b) tornado formation in moderate background rotation and moderate volume flux (Expt L10, middle column) and (c) no tornado formation in moderate background rotation and large volume flux (right column). In all experiments  $H_0=21\ \textrm {cm}$ and
 $\rho _0=1.066\ \mbox {g}\ {\mbox {cm}}^{-3}$. The top row shows velocity (green arrows) and speed (grey scale) from vertical cross-sections at
 $t=25\ \textrm {s}$ after the start of an experiment. The velocity magnitude and speed for all three panels are indicated at the bottom of the top-middle plot. Arrows are plotted only if their magnitude is less than
 $0.6\ \mbox {cm}\ \mbox {s}^{-1}$. Likewise, the middle row shows velocity and speed from horizontal cross-sections 6 cm below the source at
 $t=25\ \textrm {s}$. These plots are shifted so that the velocity is plotted about the centroid of the speed at
 $(x_c,y_c)$. The bottom row shows radial time series of the azimuthal velocity which is azimuthally averaged about the centroid. For
 $0\leqslant r\lesssim 1\ \textrm {cm}$, zero values are assigned to data where the standard deviation of the azimuthal average exceeds the mean value.

In the experiment with relatively low rotation (figure 5a), the plume at  $t=25\ \textrm {s}$ was in the process of being deflected from the vertical axis with strong vertical and radial motions being evident near the source. At a distance 6 cm from the source, the cyclonic (clockwise) horizontal flow around the plume remained approximately axisymmetric, although the radial time series of the azimuthal flow (bottom row) shows that its radial extent broadened substantially after the plume was deflected off axis shortly after 25 s. In contrast, in the experiment with the same source volume flux but three times the background rotation, the plume transformed into a tornado after 17 s. The maintenance for up to 60 s of large azimuthal vorticity associated with the tornado is evident in the radial time series of
 $u_\theta$ (figure 5b, bottom): after 25 s the radial extent of the peak in
 $u_\theta$ remains approximately constant while the peak value increases moderately in time. Despite the coherent structure of the vortex, strong radial and vertical circulations are evident in the vertical cross-section at
 $t=25\ \textrm {s}$. Eventually these motions resulted in the breakdown of the tornado. In the experiment with the same background rotation as that in figure 5(b), but with double the source vertical velocity, the plume became significantly deflected from the vertical axis at
 $t=25\ \textrm {s}$. While the ambient motion in the vertical plane appeared to be turbulent, there remained a coherent azimuthal flow around the centroid of the plume, although the radial time series (figure 5c, bottom) shows the flow was relatively weak and broadened radially over time.
3.3. Parameter regime for tornado formation
In experiments for which a tornado occurred, analyses were performed, with results given in table 1. It was often observed that the fluid from the source was deflected off axis shortly before the formation of the tornado and that when the tornado did form, its axis was displaced from the  $z$-axis overlying the source. The time,
 $T_t$, when the tornado first began to develop near the source was determined somewhat subjectively by watching movies of the experiments, and identifying when the flow leaving the nozzle became columnar in structure. Generally,
 $T_t$ was found to be longer in experiments with slower rotation. Although there was some variation, in part due to the somewhat subjective assessment of
 $T_t$, typically we found that the tornado-formation time was approximately a half-period of background rotation:
 $T_t\sim 3/\varOmega$.
The radial displacement from the  $z$-axis,
 $r_c=|\boldsymbol {x}_c|$, of the tornado as a function of vertical distance from the source was measured by locating the centroid of the speed measured by horizontal PIV. This value was averaged over times between
 $5$ and 10 s after the unambiguous formation of the tornado. Typical displacements were found to be of the order
 $r_c\simeq 1\ \textrm {cm} = 5b_0$. Once formed, however, the tornado exhibited little horizontal variation in its location. The strength of the tornado was assessed by the maximum azimuthally averaged azimuthal velocity,
 $U_{\theta t}$. In some experiments, particularly those with small
 $r_c$, the strength increased approximately linearly in time for tens of seconds. In experiments that ran for long times, a tornado typically persisted for about a minute before collapsing to form a turbulent plume deflected from the vertical axis. Tornados that formed at distances larger than
 $r_c=1\ \textrm {cm}$ from the
 $z$-axis typically had smaller maximum azimuthal velocity,
 $U_{\theta t}$ and larger radius,
 $b_{\theta t}$, where this maximum was attained. (Here and elsewhere the ‘
 $t$’ subscript refers to measurements of the tornado.)
Although these diagnostics provide some qualitative insight into the properties of the tornados, they are limited by the measurements which were too noisy near the tornado core to extract reliable information about the radial structure of the azimuthal velocity. As shown in numerical simulations below, the actual radius,  $b_{\theta t}$, of the tornado was closer to that of the nozzle radius, and the radial displacement of the tornado axis from the
 $z$-axis above the source was less than
 $3b_0$.
Although identical experiments could be run with a tornado appearing in one and not in the other, there appeared to be a ‘sweet spot’ of parameters for which a tornado was more likely to occur. Figure 6 shows regime diagrams indicating parameters resulting in tornado formation in at least one experiment (circles) or not at all (crosses). Both for moderate plume density (figure 6a) and high plume density (figure 6b), it appeared as though a tornado was less likely to occur if the source vertical velocity or background rotation was too large. Of course, no tornado occurred if there was no background rotation. The reason for the increased likelihood of tornado for certain parameters is elucidated through the analysis of numerical simulations and discussion that follow.
Regime diagrams showing parameters for which a tornado was well established for long time (circles), began to form before being disrupted within 5 s (squares) and for which a tornado never formed even in repeat experiments (crosses), as observed in L-experiments with source density (a)  $\rho _0=1.066\ \mbox {g}\ {\mbox {cm}}^{-3}$ and (b)
 $\rho _0=1.13\ \mbox {g}\ {\mbox {cm}}^{-3}$. The dashed lines indicate values of
 $w_0$ for which
 ${\mathcal {B}}_0=1$.

4. Numerical simulations
Large-eddy simulations on a fixed, finite-volume grid were performed using the open-source code OpenFOAM. So as to focus here on the results, the set-up, analysis and quality checks of the numerical simulations are given in Appendix B. Here we first present snapshots and qualitative analyses of three simulations run with the same parameters as the experiments shown in figure 5. Quantitative analyses are performed of these and other simulations, with data given in table 2.
Parameters and analyses of simulations, giving the background rotation ( $\varOmega$), source velocity (
 $w_0$) and reduced gravity (
 $g_0^{\prime }$), source Rossby number (
 ${\textit {Ro}}_0$), buoyancy parameter (
 ${\mathcal {B}}_0$) and Reynolds number (
 $\textit {Re}_0$), location of the virtual origin of a pure plume above the source (
 $z_v$), effective vertical velocity of the pure plume (
 $w_{0,{eff}}$), power law exponents for radial decay at
 $t=10\ \textrm {s}$ of the radial (
 $p_r$) and azimuthal (
 $p_\theta$) velocity respectively given by (4.1) and (4.2), normalized rate of change of radial velocity at
 $(z,r)=(2,3)\ \textrm {cm}$ defined in (4.3) (
 $\dot {c}_r$), normalized second time derivative of azimuthal velocity at
 $(z,r)=(2,3)\ \textrm {cm}$ defined in (4.4) (
 $\ddot {c}_{\theta }$), normalized rate of change of azimuthal velocity within the plume at
 $z=2\ \textrm {cm}$ defined in (4.6) (
 $c_{\alpha }$), time when plume is first deflected off axis (
 $T_d$) and the time of initial formation of the tornado (
 $T_t$) if it occurs.

4.1. Qualitative results for three simulations
We begin with an overview of three simulations with rotation rate, source velocity and source reduced gravity identical to the experiments presented in figure 5 except that in the simulations the background rotation is counterclockwise ( $\varOmega >0$) and the source is positively buoyant originating from the bottom. As in the experiments with no tornado formation evident (figure 5a,c), the simulations resulted in the plume eventually being deflected off axis and remaining turbulent if
 $\varOmega =0.1\ {{\mbox {s}}^{-1}}$ and
 $w_0=5.7\ \mbox {cm}\ \mbox {s}^{-1}$ (S1), and if
 $\varOmega =0.3\ {{\mbox {s}}^{-1}}$ and
 $w_0=11.4\ \mbox {cm}\ \mbox {s}^{-1}$ (S10). A tornado formed in the simulation with
 $\varOmega =0.3\ {{\mbox {s}}^{-1}}$ and
 $w_0=5.7\ \mbox {cm}\ \mbox {s}^{-1}$ (S7). For each simulation, figure 7 shows vertical cross-sections through the plume of the in-plane velocity and density perturbation (top row of plots), and it shows horizontal cross-sections of horizontal velocity and vertical vorticity (bottom row of plots). While the full vertical extent of the domain is shown in the top plots, only half the lateral extent is shown in all the plots.
Corresponding to the experiments shown in figure 5, snapshots at  $t=25\ \textrm {s}$ from simulations (a) S1, (b) S7 and (c) S10 having
 $|g_0^{\prime }|=65\,\mbox {cm}\ {\mbox {s}}^{-2}$ and rotation and source velocity as indicated in the top row of plots: (top row) in-plane velocity
 $(v,w)$ (arrows) and perturbation density (colour) in the
 $(y,z)$-plane; (bottom row) horizontal velocity (arrows) and vertical component of vorticity,
 $\zeta$, (colour) in a horizontal plane at
 $z=2$ cm (a height chosen to be close to the effective virtual origin for lazy plumes). In all cases, arrows are shown only if their magnitude is less than
 $1\ \mbox {cm}\ \mbox {s}^{-1}$. The scale of the arrows in all plots is indicated above the bottom-left plot.

In simulation S1 (figure 7a), which had source Rossby number  ${\textit {Ro}}_0=143$, the structure of the plume at
 $t=25\ \textrm {s}$ (
 $0.4$ of a rotational period) was qualitatively similar to that in a non-rotating fluid: the plume remained centred about the vertical axis and widened as the buoyancy decreased with height due to ambient fluid entrainment. Except near the turbulent eddies in the plume and near the top of the domain, the ambient motion was predominantly horizontal with a cyclonic (counterclockwise) circulation around the plume (figure 7a, bottom) as a consequence of entrainment drawing the rotating ambient fluid radially inward. In this simulation, the plume was found to deflect from the vertical axis at
 $T_d=28\ \textrm {s}$.
In stark contrast, simulation S7 (figure 7b) shows that the plume transformed into a tornado, doing so at time  $T_t\simeq 17\ \textrm {s}$. This simulation was run with the same parameters as experiment L10 (figure 5b). In that experiment a tornado also formed, but around 20 s. The simulated tornado was characterized by a tight, vertically extended core of fluid whose density changed little with height up to
 $z\simeq 15\ \textrm {cm}$. The vertical cross-section shows that the ambient velocity is primarily horizontal up to
 $z\simeq 5\ \textrm {cm}$ from the source at
 $t=25\ \textrm {s}$, with an apparent rightward velocity component over the bottom
 ${\simeq }5\ \textrm {cm}$ to either side of the tornado. This occurs in part because some entrainment continues to take place, but also because the centre of the vortex is displaced in the negative
 $x$-direction from the
 $z$-axis above the source (see figure 7b, bottom) so that the flow in the
 $x=0$ plane captures some of the anticyclonic azimuthal flow going around the tornado. Despite the presence of moderate rotation, there are significant vertical as well as horizontal motions in the ambient fluid well outside the tornado above
 $z\simeq 5\ \textrm {cm}$. The horizontal cross-section (figure 7b, bottom) shows strong cyclonic motion surrounding a localized core of positive vertical vorticity having a radius
 $b_{\theta t}\simeq 0.3\ \textrm {cm}$. The maximum vorticity is
 $67\ {{\mbox {s}}^{-1}} = 112 f$. We further note the occurrence of quasi-periodic perturbations to the columnar vortex between
 $z\simeq 1$ and
 $6\ \textrm {cm}$ (figure 7b, top). These may be a consequence of inertial waves trapped within the vortex, as has been observed in experiments of decaying rotating turbulence generated by oscillating grids (Hopfinger, Browand & Gagne Reference Hopfinger, Browand and Gagne1982; Davidson, Staplehurst & Dalziel Reference Davidson, Staplehurst and Dalziel2006; Staplehurst, Davidson & Dalziel Reference Staplehurst, Davidson and Dalziel2008). However, a detailed examination of these disturbances lies beyond the focus of our study.
In the simulation with the same background rotation but with twice the vertical velocity at the source (S10), the plume first deflected significantly off-axis at  $T_d=14\ \textrm {s}$ and remained deflected at
 $t=25\ \textrm {s}$, as shown in figure 7(c). Although the ambient flow outside the plume is primarily horizontal below
 $z\simeq 5\ \textrm {cm}$, the
 $y$-velocity is positive on either side of the plume as a consequence of the centroid of the disturbance being shifted to the second quadrant. The vertical vorticity at
 $z=2\ \textrm {cm}$ is no longer coherent and single-signed, although a near-axisymmetric azimuthal flow surrounds the centroid of the plume.
4.2. Time series analyses of the plume evolution
In order to gain insight into the dynamics governing the plume and ambient fluid evolution, vertical time series were constructed of the density normalized dynamic pressure,  $P_c$, and vertical velocity,
 $W_c$, at the centroid of the flow, and of the maximum azimuthally averaged azimuthal velocity,
 $U_\theta$, about the centroid. The centroid itself, which can change position with height and time, was determined from the magnitude of the vertical vorticity field associated with the flow. After constructing the time series, MatLab's ‘rlowess’ method was used to smooth the data by averaging over 1 s in time and 1 cm in the vertical. This procedure helped to filter out fast- and fine-scale motions so as to focus on the statistically quasi-steady evolution of the fields. The results, corresponding to the three simulations in figure 7, are shown in figure 8. These fields are normalized using the effective source velocity,
 $w_{0,{eff}}$, defined by (2.8).
Vertical time series corresponding to the three simulations shown in figure 7 (S1 left, S7 middle, S10 right), showing fields evaluated about the plume centroid at  $(x_c(z,t),y_c(z,t))$: (a–c) dynamic pressure, (d–f) vertical velocity, (g–i) maximum azimuthally averaged azimuthal velocity and (j–l) the plume Rossby number as given by (2.17). In the plots of
 $P_c/w_{0,{eff}}^2$, dashed lines indicate where the pressure is half its minimum value at
 $t=1\ \textrm {s}$. In the plots of
 $W_c/w_{0,{eff}}$, dashed lines indicate where the vertical velocity is half its maximum value at
 $t=1\ \textrm {s}$. In all plots, the crosses on the time axes represent the time,
 $T_d$, when the plume first deflected off axis. In the middle column of plots, the circle on the time axis indicates the time,
 $T_t$, when tornado formation was first evident. The arrow below the time series in (k) indicates the enhanced reduction in the Rossby number close to the source at early times compared with its value around the virtual origin at
 $z\simeq 2\ \textrm {cm}$. Note that the range of time in the first column of plots is twice that of the second and third columns.

The vertical time series of  $P_c$ show the front of the starting plume rising past
 $z=15\ \textrm {cm}$ in the first two or three seconds of the simulation. The rise time depended upon the source buoyancy. (Note that the apparently steeper slope of the front of the starting plume in figure 8(a,d,g,j) is due to the time axis extending to 40 s, rather than 20 s in figure 8(b,c)). The pressure decreased rapidly in the vertical from the source to
 $z\simeq 2\ \textrm {cm}$, close to the location of the lazy plume virtual origin. It is over this distance that the relatively low momentum of the lazy plume adjusts to become closer to that of a pure plume. Above the virtual origin the pressure increased with height corresponding to the decrease in the vertical velocity, as expected for a pure plume. The right and upward streaks in the pressure time series correspond to unfiltered turbulent eddies rising upward through the ascending plume. Unlike a plume with no background rotation, as time progressed the vertical extent of the low-pressure region above the virtual origin became smaller as is evident, for example, in figure 8(b) by the converging dashed lines indicating where the pressure is half the minimum pressure at
 $t=1\ \textrm {s}$. The vertical extent of the low-pressure region decreased more rapidly in simulations S7 and S10, which had faster background rotation (figure 8b,c). The corresponding increasing dominance of an adverse vertical pressure gradient approaching the source in time was likewise noted in the simulations of rotating plumes in (non-uniformly) stratified fluid by Fabregat Tomàs et al. (Reference Fabregat Tomàs, Poje, Özgökmen and Dewar2016).
The low-pressure region vanished altogether at the critical time  $T_d\simeq 28\ \textrm {s}$ in simulation S1 (figure 8a), at
 $T_d\simeq 14\ \textrm {s}$ in simulation S7 (figure 8b) and at
 $T_d\simeq 13\ \textrm {s}$ in simulation S10 (figure 8c). At these times the plumes deflected from the vertical axis at the source. After these times, in the first and last cases the pressure became somewhat homogeneous with height, corresponding to the source fluid being deflected significantly away from the vertical. In the middle case (figure 8b), shortly after the low-pressure region vanished the pressure near the source decreased rapidly once more and the vertical extent of the low-pressure region then extended well above the source after time
 $T_t\simeq 18\ \textrm {s}$ corresponding to the formation of a tornado having azimuthal velocity in cyclostrophic balance with the radial pressure gradient.
The descent toward the source over time of relatively higher pressure coincided with a decrease in the vertical velocity within the plume (figure 8d–f). In particular, the positive vertical strain near the source vanished at the deflection time  $T_d$, at which time the vertical velocity near the virtual origin was approximately
 $0.5w_{0,{eff}}$. This dynamics lies in stark contrast with non-rotating plume theory. Not only was the evolution of the rotating plume unsteady, but the system evolved from one having decreasing vertical velocity with height above the virtual origin to one in which the vertical velocity was near uniform with height at the time when the pressure low vanished.
The change in the centreline pressure and vertical velocity can be attributed to the increase of azimuthal velocity in the plume, as shown by the time series of  $U_\theta$ in figure 8(g–i). Entrainment of the rotating ambient fluid surrounding the plume efficiently increased the azimuthal velocity within the plume by way of angular momentum conservation. As
 $U_\theta$ increased, a greater vertical strain was required in order to change both the radial and azimuthal velocities. If the buoyant flow possessed insufficient potential energy to supply the requisite kinetic energy, then vertical motion became inhibited.
As a measure of the importance of azimuthal flows in influencing the plume dynamics, figure 8(j–l) shows time series of the plume Rossby number,  $\textit {Ro}_{{p}}$, defined by (2.17). Associated with the growth of
 $U_\theta$ in the plume is the increase in characteristic vertical vorticity
 $\zeta_{\theta} \equiv 2U_\theta /b_\theta$. Even though at early times the vertical velocity was much larger than
 $U_\theta$,
 $\zeta_{\theta}$ quickly became much larger than
 $f$, so that
 $\textit {Ro}_{{p}}\simeq W_c/U_\theta = 1/q$ rapidly reduced. This reduction occurred most rapidly well above the source because ambient fluid was carried radially inward over a larger distance, owing to the larger plume radius. This resulted in a larger spin-up due to angular momentum conservation.
Also evident in our simulations of lazy plumes was a more rapid decrease in the plume Rossby number close to the source as compared with the change in the plume Rossby number moderately above the height of the virtual origin (around  $z\simeq 2\ \textrm {cm}$). This was particularly evident in simulation S7 (indicated by the arrow below figure 8k), which had higher source buoyancy parameter (
 ${\mathcal {B}}_0=5.0$) than that in simulation S10 with the same background rotation (
 ${\mathcal {B}}_0=1.3$).
4.3. Time series analyses of the ambient flow surrounding plume
The evolution of the ambient fluid motion around the plume is examined by constructing vertical time series of the radial, azimuthal and vertical velocities that are azimuthally averaged around a radius  $r_a=3\ \textrm {cm}$ from the centroid of the flow. This radius was chosen to be close to the boundary at
 $z=15\ \textrm {cm}$ between the turbulent plume and ambient fluid at early times in the simulations. The resulting time series are shown in figure 9 for the same three simulations with snapshots shown in figure 7.
Vertical time series corresponding to the three simulations shown in figure 7 (S1 left, S7 middle, S10 right), showing azimuthally averaged normalized velocities at  $r_a=3\ \textrm {cm}$: (a–c) radial velocity, (d–f) azimuthal velocity and (g–i) vertical velocity. In the plots of
 $u_r/w_{0,{eff}}$, the thick contour indicates where the radial velocity is zero and solid and dashed contours are plotted at intervals of
 $0.01$. In the plots of
 $u_\theta /w_{0,{eff}}$, black contours are plotted at intervals of
 $0.2$; the thick contours indicate where the azimuthal velocity is zero. The yellow contours in this plot indicate where the ambient Rossby number is
 $0.1$ (thick line) and
 $0.5$ (thin line). In the plots of
 $w/w_{0,{eff}}$, contours are plotted at
 $-0.01$ (dashed),
 $0$ (thick solid) and
 $0.01$ (solid). Note that the range of time in the first column of plots is twice that of the second and third columns.

As the front of the starting plume rose, the ambient fluid was first pushed radially outward around its head, but the flow then reversed to be drawn into the plume itself. The inward radial flow was generally faster further above the source and fluctuated as successive eddies rose upward through the plume. Of course, theory predicts the radial entrainment velocity ( $\propto W_c$) is smaller with increasing height above the virtual origin. However, as given by (2.18), at a fixed radius outside the plume the radial inflow is larger with height.
In all simulations, the radial and azimuthal velocities initially exhibited vertical shear. However, approaching the time,  $T_d$, at which the plume was deflected from the vertical, azimuthal velocity contours became nearly vertical for
 $z\gtrsim 0$. Contours of the ambient Rossby number,
 $\textit {Ro}_{{a}}$ (defined by (2.19)), are superimposed on the vertical time series of
 $u_\theta$ (figure 9d–f). If
 $u_r$ was neglected in the definition of
 $\textit {Ro}_{{a}}$, the contours would coincide with lines of constant
 $u_\theta$. It is clear that well above the source (
 $z\gtrsim 5\ \textrm {cm}$) at early times the radial velocity contributes significantly to increase the ambient Rossby number beyond
 $0.1$ (thick yellow contour in figure 9d–f). Close to the source, the Rossby number remained smaller for longer times leading to the vertical shear being reduced more rapidly there.
These considerations lead to a complicated evolution of the ambient vertical velocity field (figure 9g–i). As the front of the starting plume passed a given height it induced a downward velocity in the surrounding ambient. Thereafter, below  $z\simeq 5\ \textrm {cm}$ a net upward flow developed, increasing upward from zero at
 $z=0$, reaching a maximum and then decreasing again. The corresponding vertical strain near
 $z=0$ acted to reduce the vertical shear of
 $u_r$ and
 $u_\theta$.
4.4. Temporal evolution of flow near the source before plume deflection
Corresponding to the three simulations examined above, figure 10(a–c) plots the radial dependence at  $z=2\ \textrm {cm}$ (close to the lazy plume virtual origin) and
 $t=10\ \textrm {s}$ of the most significant forcing terms in the radial and azimuthal momentum equations (2.11) and (2.12). Specifically, these are the radial pressure gradient (
 $\partial P/\partial r$), the Coriolis accelerations (
 $\kern0.06em f u_\theta$ and
 $-f u_r$) and the centripetal acceleration (
 $u_\theta ^2/r$). For simulation S1 (
 $\varOmega =0.1\ {{\mbox {s}}^{-1}}$), the radial pressure gradient dominated over the Coriolis and centripetal accelerations at
 $t=10\ \textrm {s}$ (
 $0.16$ of a rotational period) so that the inward radial flow increased in time. Conversely, in the simulations with
 $\varOmega =0.3\ {{\mbox {s}}^{-1}}$, the acceleration due to the radial pressure gradient was in near balance with the Coriolis acceleration (
 $\textit {Ro}_{{a}}\ll 1$) for
 $r\gtrsim 3\ \textrm {cm}$, and with the centripetal acceleration (
 $\textit {Ro}_{{a}}\gg 1$) for
 $r\lesssim 1\ \textrm {cm}$. Due to the vertical strain in the ambient fluid, the azimuthally averaged radial velocity field did not decay with radius as
 $r^{-1}$, as would be required by (2.10) with
 $\partial w/\partial z=0$. Instead, it decayed as
 \begin{equation} u_r \propto r^{{-}p_r}, \end{equation}
with  $p_r\simeq 0.33$ in simulation S1 and
 $p_r\simeq 0.5$ in simulations S7 and S10. The radial profile of azimuthal velocity also exhibited power law behaviour near the plume according to
 \begin{equation} u_\theta \propto r^{{-}p_\theta}, \end{equation}
although  $p_\theta$ was typically larger than
 $p_r$. The power law exponents for all simulations are given in table 2. Generally
 $p_r<1$ and
 $p_\theta <1$ except in the simulation of a jet (S4) and the simulations with the fastest rotation (S11 and S12), for which
 $p_r\simeq 1$.
For the three simulations shown in figure 7, analyses showing the following: (a–c) log–log plots of the azimuthally averaged radial profiles at  $t=10\ \textrm {s}$ and
 $z=2\ \textrm {cm}$ of the density normalized pressure gradient (thick blue), centripetal acceleration (dashed), the Coriolis acceleration in the radial momentum equation (solid black) and the Coriolis acceleration in the azimuthal momentum equation (solid red); (d–f) time evolution at
 $r_a=3\ \textrm {cm}$ and at three different heights (as indicated in (d)) of the normalized azimuthally averaged radial and azimuthal velocities; (g–i) time evolution within the plume at
 $z=2\ \textrm {cm}$ of normalized maximum vertical vorticity (
 $\zeta _\theta \equiv 2U_\theta /b_\theta$, black), maximum vertical velocity (red) and the maximum azimuthally averaged azimuthal velocity (green). In the top row dotted lines are the offset best-fit lines to
 $fu_\theta$ (black) and
 $fu_r$ (red) with numbers indicating the slope and associated error. In the middle row the red dotted lines show the offset best-fit line to
 $u_r(t;z=2\ \mbox {cm},r=3\ \mbox {cm})/w_{0,{eff}}$ over the time range indicated, with numbers giving the slope. In (d–i), the crosses and circles on the time axes respectively indicate when the plume first deflected and when it first transformed into a tornado.

This analysis was also performed by extracting at  $t=10\ \textrm {s}$ radial profiles taken at
 $z=1$ and
 $z=3\ \textrm {cm}$ (not shown). The results showed that the computed power law exponents,
 $p_r$ and
 $p_\theta$, did not vary significantly with height for
 $z=2\ (\pm 1)\ \textrm {cm}$. However, the magnitude of the radial and azimuthal flows did increase in time. The time evolution of the azimuthally averaged ambient flow at
 $r=r_a=3$ and
 $z=2\ \textrm {cm}$ is plotted in figure 10(d–f) for the three simulations considered above. These show that the inward radial flow increases linearly in time according to
 \begin{equation} u_r(r_a=3\ \mbox{cm},t)/w_{0,{eff}} \simeq{-}\dot{c}_r f t, \end{equation}
in which  $\dot {c}_r$ is an empirically determined constant. In all simulations (see table 2), we find
 $\dot {c}_r \simeq 0.0020\pm 0.0005$. Because the Coriolis term,
 $-fu_r$, is the dominant driving force in the azimuthal momentum equation (2.12), the azimuthal velocity is expected to increase quadratically in time according to
 \begin{equation} u_\theta(r_a=3\ \mbox{cm},t)/w_{0,{eff}} \simeq \ddot{c}_{\theta} (f t)^2/2, \end{equation}
in which  $\ddot {c}_{\theta }$ is an empirically determined constant. This constant is found to be comparable to
 $\dot {c}_r$, as expected (see table 2).
Combining these results, a crude representation of the evolution of the ambient flow around  $z=2\ \textrm {cm}$ (near the virtual origin) is
 \begin{equation} \frac{u_r(r,t)}{w_{0,{eff}}} \simeq{-}\dot{c}_r\ (ft) \left(\frac{r}{r_a}\right)^{{-}p_r}, \quad \frac{u_\theta(r,t)}{w_{0,{eff}}} \simeq \frac{1}{2}\ddot{c}_{\theta} (ft)^2 \left(\frac{r}{r_a}\right)^{{-}p_\theta}. \end{equation}
Figure 10(g–i) examines the time evolution of the centreline vertical vorticity, the maximum azimuthally averaged azimuthal velocity and its associated vorticity within the plume at  $z=2\ \textrm {cm}$. This shows that
 $W_c$ remains constant even as
 $U_{\theta }$ increases until
 $q=U_{\theta }/W_c\simeq 0.15$, consistent with our prediction that rotation significantly influences the plume if the swirl exceeds the critical value
 $q_c\simeq 0.15$ (see § 2.2). Particularly for lazy plumes, until close to the time of plume deflection the maximum azimuthal velocity was found to increase approximately linearly in time according to
 \begin{equation} U_\theta/w_{0,{eff}} \simeq c_{\alpha} ft. \end{equation}
In most simulations,  $c_{\alpha } = 0.03 (\pm 0.01)$. The largest value
 $c_{\alpha } \simeq 0.04$ was measured in the simulation with largest source buoyancy parameter (
 ${\mathcal {B}}_0=9.9$) and the smallest value
 $c_{\alpha }\simeq 0.012$ was measured in the simulation of a jet (
 ${\mathcal {B}}_0=0$). This suggests that the linear increase in time of
 $U_\theta$ within the plume, as opposed to the quadratic increase in the surrounding ambient, was strongly influenced by the reduction in entrainment into lazy plumes, with entrainment being further reduced as the surrounding fluid acquired greater azimuthal velocity. This assertion is supported by comparing (4.6) with (2.16), showing that the estimated entrainment coefficient,
 $\alpha _{{B}}\sim c_{\alpha }$, is approximately a third of the value expected for a pure plume. The positive vertical strain near the source of lazy plumes acted to increase the absolute vorticity both of the fluid that was entrained and of the fluid leaving the source. Plumes that were closer to being pure near the source had zero or negative vertical strain associated with the decrease in mean vertical velocity with height. So, while their relative entrainment of the surrounding azimuthal flow was larger, the associated vorticity within the plume was reduced.
4.5. Plume deflection
In all cases, the vertical velocity in the plume at  $z=2\ \textrm {cm}$ began to decrease when
 $w_{0,{eff}}/(\zeta_{\theta} b_0) \sim 4$, which nearly coincides with the critical Rossby number,
 ${\textit {Ro}}_c=3.4$, at which rotation was found in experiments by Fernando et al. (Reference Fernando, Chen and Ayotte1998) to constrain vertical motion in a plume. The decrease is associated with the change in pressure within the plume due to the increasing surrounding azimuthal flow.
Near the plume the ambient flow is in near cyclostrophic balance so that the radial pressure gradient is approximately equal to the centripetal acceleration,  $u_\theta ^2/r$ (figure 10b,c). Hence, the pressure surrounding the plume near the source decreases as a fourth power of time. Using (4.5a,b), a semi-empirical estimate of the pressure surrounding the plume around the virtual origin is given by
 \begin{equation} \frac{P}{{w_{0,{eff}}}^2} \sim{-}\frac{\ddot{c}_{\theta}^2}{8p_\theta} (ft)^4 \left(\frac{r}{r_a}\right)^{{-}2p_\theta}, \end{equation}
in which  $r_a=3\ \textrm {cm}$ and, based on measurements of lazy plume simulations, we estimate
 $p_\theta \simeq 0.7$ and
 $\ddot {c}_{\theta }\simeq 0.003$. Around the time of a half-rotation period, for which
 $ft\simeq 6$, this expression evaluated at
 $r=b_0$ gives
 $P/{w_{0,{eff}}}^2 \simeq -0.05$, which is comparable to the pressure at the source. This suggests the plume deflection occurs not just due to the build-up of an adverse vertical pressure gradient but also because the ambient flow ultimately reverses the radial pressure gradient near the source on a time of the order
 $T_d\sim 6/f$.
4.6. Tornado structure and stability
In the four simulations for which a stable tornado formed, the flow and structure of the tornado were measured at a time 5 s after the tornado first began to develop such that it extended beyond 10 cm above the source. At each height the velocity fields were computed from an azimuthal average around the centroid of the vertical vorticity field associated with the flow, from which were extracted at each height the maximum vertical velocity,  $W_{ct}$, the maximum azimuthal velocity,
 $U_{\theta t}$, and the width,
 $b_{\theta t}$, where the azimuthal velocity was largest. The resulting vertical profiles are plotted in figure 11.
Vertical profiles of normalized fields associated with a tornado in simulations for which a stable tornado appears showing (a) maximum azimuthal velocity, (b) radial extent, (c) centreline vertical velocity and (d) radial distance of the centroid from the  $z$-axis. The parameters for each simulation, with values in cgs units, are indicated in (a).

In all four cases  $U_{\theta t}$ moderately decreased with height between
 $1$ and
 $10$ cm above the source and, consistent with the suppression of three dimensional turbulent motions,
 $U_{\theta t}$ was smaller than
 $w_{0,{eff}}$, the effective source vertical velocity. The radial extent of the tornado,
 $b_{\theta t}$, was approximately twice the source radius,
 $b_0$, showing an increase with height that was much smaller than that associated with a turbulent plume.
The maximum vertical velocity generally increased with height at least up to  $z=5\ \textrm {cm}$, consistent with the vortex being stretched. Between the four simulations with a tornado there was significant variation in typical values of
 $W_{ct}$ (figure 11c). This can be explained by the plot in figure 11(d) showing the radial distance,
 $r_c$, of the centroid of the tornado from the
 $z$-axis as a function of height. In simulations where the tornado was most closely aligned above the source such that
 $r_c\simeq b_0$, the maximum azimuthal and vertical velocities were largest and the radius of the tornado was smallest. However, in simulations where the fluid from the source was deflected by a significant radial distance before the tornado formed (
 $r_c\simeq 2b_0$), the radius was larger and the velocities smaller. A similar observation was made for tornados that formed in laboratory experiments.
The stability of the tornado is assessed through examining its associated swirl. In studies of the stability of a columnar Gaussian (Batchelor) vortex having both azimuthal and axial flow (Batchelor Reference Batchelor1964; Delbende, Rossi & Le Dizès Reference Delbende, Rossi and Le Dizès2002) the swirl is defined by  $q_t^\star \equiv \varGamma /(2{\rm \pi} b_t W_{ct})$, in which
 $b_t$ is the radius of the tornado,
 $W_{ct}$ is the centreline vertical velocity and
 $\varGamma$ is the (constant) circulation outside the tornado. Numerous theoretical studies of the temporal and absolute/convective instability of the Batchelor vortex with and without viscous effects have shown that the vortex is stable if
 $q_t^\star \gtrsim 1.5$ (e.g. see Lessen & Paillet Reference Lessen and Paillet1974; Lessen, Singh & Paillet Reference Lessen, Singh and Paillet1974; Stewartson & Leibovich Reference Stewartson and Leibovich1987; Delbende, Chomaz & Huerre Reference Delbende, Chomaz and Huerre1998).
It is more convenient for us to measure the maximum azimuthal velocity which, for a Batchelor vortex, is related to the circulation by  $U_{\theta t} \simeq 0.639 \varGamma /(2{\rm \pi} b_t)$ (Lessen et al. Reference Lessen, Singh and Paillet1974). Therefore we define the swirl of a tornado by
 \begin{equation} q_t \equiv U_{\theta t}/W_{ct} \simeq 0.639 q_t^\star. \end{equation}
The corresponding condition for stability is given by  $q_t\gtrsim 1$. Consistent with this prediction, the vertical profiles of
 $q_t$, plotted in figure 12, show that the swirl for all tornados was greater than
 $1$, at least below
 $z=5\ \textrm {cm}$. This analysis suggests that for a tornado to form after being deflected, the vorticity within the plume must increase sufficiently through vortex stretching so that the maximum azimuthal flow exceeds the axial flow.
Vertical profiles of the swirl associated with the tornados observed in four simulations. The line colours correspond to those shown in figure 11(a).

5. Discussion
The culmination of the analyses above demonstrates processes that tend to drive the plume away from the vertical as well as processes that strengthen the swirl of the plume near the source, possibly leading to tornado formation. These are illustrated schematically in figure 13.
Schematic showing the evolution of the plume (edges drawn as black lines, flow within the plume as green arrows and ambient flow outside the plume as blue arrows): (a) as swirl builds up within the plume far above the source (red arrow) opposing pressure gradient develops (cyan arrow); (b) the plume widens as the opposing pressure descends toward the source, and swirl builds up in the ambient fluid surrounding the source, some of which is entrained into the plume; (c) the plume eventually deflects from the vertical and non-axisymmetric circulations develop in the surrounding ambient fluid; (d) in some circumstances vertical stretching of the deflected plume may increase the swirl in the vicinity of the source sufficiently to laminarize the flow resulting in tornado formation.

Two separate processes ultimately lead to the deflection of the plume near the source. In one process, vorticity increases within the plume due to entrainment of the rotating ambient fluid. This increase occurs more rapidly well above the source where the plume is wider (figure 13a). As the Rossby number associated with this flow decreases, vertical motion becomes inhibited and, consequently, an adverse pressure gradient strengthens (figure 13b). Over the time of a half-period of background rotation, this encroaches toward the source. In the other process, an azimuthal flow builds quadratically in time in the ambient fluid surrounding the plume near the source. Due to cyclostrophic balance between the radial pressure gradient and the centripetal acceleration of the azimuthal flow, the ambient motion near the source induces a drop in pressure, which becomes comparable to that at the source after a half-period of background rotation.
After deflection occurs, the axial flow is stretched, which increases the vorticity and its associated maximum azimuthal flow near the source (figure 13c). If this flow becomes larger than the axial flow ( $q_t\gtrsim 1$), then it is possible for a tornado to form and remain stable (figure 13d).
Just because a tornado can occur, does not mean that it does. However, experiments and simulations suggest that tornado formation is more likely for lazy plumes ( ${\mathcal {B}}_0>1$). A tornado formed in 6 of 9 repeat experiments with the parameters of L10 (
 ${\mathcal {B}}_0=5.1$), in 4 of 8 repeat experiments with the parameters of L13 (
 ${\mathcal {B}}_0=4.4$), and in 2 of 3 repeat experiments with the parameters of L11 and of L19 (
 ${\mathcal {B}}_0=9.9$). In the C-experiments with (
 ${\mathcal {B}}_0=1$) a tornado was observed in just 4 of approximately 100 experiments. Likewise, numerical simulations were repeated with the same input parameters but changing the noise fluctuations at the inlet as well as having either no-slip or free-slip bottom boundary conditions. A tornado formed in 6 of 10 repeat simulations with the parameters of S7 (
 ${\mathcal {B}}_0=5.0$), in 4 of 10 repeat simulations with the parameters of S10 (
 ${\mathcal {B}}_0=1.3$) and in none of 10 repeat simulations with
 ${\mathcal {B}}_0=1.0$.
While such randomness makes an accurate prediction for the occurrence of a tornado challenging, the analyses above suggest that the source Rossby number,  ${\textit {Ro}}_0$, and source buoyancy parameter,
 ${\mathcal {B}}_0$, best assess conditions favourable to tornado formation, as shown by the regime diagram in figure 14.
Regime diagram showing the source buoyancy parameter and inverse source Rossby number in experiments and simulations for which a tornado was well established for long time (circles) or began to form before being disrupted within 5 s (squares) as observed in L-experiments (using the data shown in figure 6) with source density  $\rho _0=1.066\ \mbox {g}\ {\mbox {cm}}^{-3}$ (red) and
 $\rho _0=1.13\ \mbox {g}\ {\mbox {cm}}^{-3}$ (black), in C-experiments (thick blue) and in numerical simulations (thick green). The dashed line indicates where
 ${\mathcal {B}}_0=1$.

Certainly, it is necessary for the source Rossby number to be much greater than the critical value  ${\textit {Ro}}_c\simeq 3.4$, otherwise vertical motion would be inhibited immediately upon leaving the source. Consistent with the regime diagram in figure 14, it is reasonable to suppose a lower bound of
 ${\textit {Ro}}_0\gtrsim 10$. There appears to be no strict upper bound on
 ${\textit {Ro}}_0$ because the time for plume deflection and for tornado formation are both comparable to a half-period of rotation. However, if the background rotation is very small, then the domain would have to be very tall and wide to ensure that the flow in the far field does not significantly influence the flow near the source.
The regime diagram in figure 14 suggests it is necessary to have  ${\mathcal {B}}_0 \gtrsim 1$ for stable tornados to form. Another possible constraint on the formation of a stable tornado is the condition that the swirl,
 $q_t$, be larger than unity. Because the tornado forms near the source, its radius,
 $b_{\theta t}$, should not be much larger than that of the source itself, with simulations (figure 11b) suggesting a radius
 $b_{\theta t}\sim 2b_0$. Some entrainment may occur between the source and base of the tornado, particularly if the source flow is deflected off axis. Hence, because the somewhat larger volume flux rises through a vortex core of somewhat larger radius than the source, the vertical velocity within the tornado should be of similar order to the effective source vertical velocity,
 $w_{0,{eff}}$, of the plume. In simulations of lazy plumes that transform into tornados (figure 11c) measurements indeed suggest
 $W_{ct} \lesssim w_{0,{eff}}$ if the tornado is not displaced too far from the vertical axis through the source. Because the ambient fluid has uniform density, the buoyancy flux between the source and base of the tornado is constant. This permits an estimate of the reduced gravity of the fluid entering the tornado to be
 \begin{equation} g_{ct}^\prime \sim \frac{b_0^2}{b_{\theta t}^2}\frac{w_0}{w_{0,{eff}}} g_{c0}^{\prime} \gtrsim 0.3 g_{c0}^{\prime} \frac{({\mathcal{B}}_0-1)^{1/10}}{{{\mathcal{B}}_0}^{1/2}}, \end{equation}
in which we have used (2.7) and the estimate  $w_{0,{eff}}\simeq w_{c,{max}}$. Using (2.5), the buoyancy parameter,
 ${\mathcal {B}}_{{t}}$, associated with the flow entering the base of the tornado is estimated to be
 \begin{equation} {\mathcal{B}}_{{t}} = \frac{5}{4\alpha} \frac{g_{ct}^\prime b_t}{W_{ct}^2} \gtrsim \frac{({\mathcal{B}}_0-1)^{3/10}}{{\mathcal{B}}_0^{1/2}} \simeq {\mathcal{B}}_0^{{-}1/5}, \end{equation}
in which the last expression holds if  ${\mathcal {B}}_0\gg 1$. Hence, if the plume is very lazy at the source, then the flow entering the base of the tornado would have an excess of momentum over buoyancy. As buoyancy is necessary to provide the axial strain that maintains a tornado, it is reasonable to assume that a tornado can form if the plume is lazy, but not so lazy that entrainment into the plume near the source is entirely suppressed. Experiments and simulations suggest
 $1\lesssim {\mathcal {B}}_0\lesssim 20$.
6. Conclusions
In our analysis of experimental and simulated rotating plumes we have shown that significant chaotic vertical and horizontal motion is induced in the ambient fluid surrounding the plume. Far above the source this is a consequence of the vertical motion in the plume being redirected outward at heights where the plume Rossby number decreases below unity. Vertical strain is likewise induced in the surrounding ambient fluid near the level of the source so as to reduce the vertical shear imposed by differential radial entrainment with height. This leads to a linear increase in time of the inflow velocity and a corresponding quadratic increase in time of the ambient azimuthal velocity that builds a negative pressure quartically in time, ultimately acting to deflect the plume from its vertical axis. For lazy plumes, the vertical strain near the source results in a linear increase in time of vorticity, increasing the swirl that has the potential to laminarize the flow and transform the plume into a tornado. The time for both plume deflection and tornado formation occurs on a scale of half a period of the background rotation.
Whether or not a tornado forms depends somewhat randomly on the nature of the turbulent fluctuations surrounding the plume when it becomes deflected. However, analyses suggest a tornado is more likely to form if the source buoyancy parameter lies in the range  $1\lesssim {\mathcal {B}}_0\lesssim 20$. A lower bound on the source Rossby number is
 ${\textit {Ro}}_0\simeq 10$. In theory there is no upper bound on the source Rossby number except for limitations posed by the domain size and by ambient motion occurring independent of the plume that may cause it to deflect before a half-period of rotation.
For example, consider the oil plume of the 2010 Deepwater Horizon accident. Estimates have been made for the source volume flux,  $Q_0\sim 0.2\ {\mbox {m}}^3\ \mbox {s}^{-1}$, and buoyancy flux,
 $B_0\simeq 1\ \mbox {m}^4\ \mbox {s}^{-3}$, emanating from the pipe of radius 0.238 m (Sovolofsky, Adams & Sherwood Reference Sovolofsky, Adams and Sherwood2011). From these, the source buoyancy parameter is estimated to be
 ${\mathcal {B}}_0\simeq 12$: the plume was moderately lazy. However, the source Rossby number was
 ${\textit {Ro}}_0\simeq 6\times 10^4$, and so it is likely that bottom currents and the action of the barotropic tide would deflect the plume before a tornado could form on the time scale of
 $6/f \sim 24\ \textrm {h}$ at
 $28.7^\circ \textrm {N}$.
In the experiments and simulations presented here, the ambient fluid had uniform density. However, tornado formation has also been observed in laboratory experiments of a rotating plume impinging downward upon a density interface in a two-layer fluid (Ma Reference Ma2018). Whereas the initially turbulent plume spread at the interface because turbulent entrainment reduced its density to be lighter than the lower layer fluid, once a tornado formed, laminarization reduced entrainment so that the vortex could efficiently penetrate through the interface and carry nearly undiluted fluid from the source to depth. If sufficiently quiescent ambient conditions could exist and if the plumes were sufficiently lazy, this could have important implications for the vertical transport of pollutants from effluent released at depth and of nutrients and heat released from abyssal geothermal vents, in which case tornado formation would result in the near-undiluted vertical transport of the source fluid.
Funding
This research was performed in part through funding from the Natural Sciences and Engineering Research Council (NSERC) of Canada. The experiments performed in Lyon were supported by LABEX iMUST (ANR-10-LABX-0064) of Université de Lyon, within the program ‘Investissements d'Avenir’ (ANR-11-IDEX- 0007), and also by DisET (ANR-17-CE30-0003), operated by the French National Research Agency (ANR), France. Experimental analyses were achieved thanks to the resources of PSMN from ENS de Lyon. The research in Cambridge was supported by The Gulf of Mexico Research Initiative [10.13039/100007240] (SA 15-15), through the CARTHE consortium. Further support was provided from Fitzwilliam College, Selwyn College and Corpus Christi College in Cambridge. Work in Marseille was funded by the European Research Council under the European Union's Horizon 2020 research and innovation program through Grant No. 681835-FLUDYCO-ERC-2015-CoG. Simulations were made possible through a resource allocation from Compute Canada applied to the supercomputer ‘graham’.
Declaration of interests
The authors report no conflict of interest.
Appendix A. Set-up and analysis of experiments
The tank geometry, range of experiment parameters and visualization methods used for experiments in each of the four institutions involved with this study are listed in table 3. Here, we discuss the details of the flow leading to the plume source and the visualization methods used.
Experiment location (with designation in text given in brackets), geometry and parameters, including the side-to-side tank width/diameter ( $L_T$), distance between source and tank bottom (
 $H_0$), magnitude of the rotation rate (
 $|\varOmega |$ in radians per second, denoted
 ${{\mbox {s}}^{-1}}$), source radius (
 $b_0$), source volume flux (
 $Q_0$) and reservoir density (
 $\rho _0$). The last column lists the visualization method(s) used.

A.1. Plume source
In all experiments, the saline plume emanated from a nozzle consisting of an expansion chamber behind a small opening of radius  $b_0$ covered with a fine mesh (Hunt & Linden Reference Hunt and Linden2001) that ensured that fluid leaving the nozzle was turbulent upon exiting the source. In all cases the opening of the nozzle was situated within 1 cm of the surface.
All experiments were performed with the tank (filled with fresh water) and reservoir (filled with salt water) on a rotating table. Except in a small number of control experiments with no rotation, after filling the tank and reservoir, and priming the fluid between the reservoir and nozzle, the table was set to rotate at a prescribed rate  $|\varOmega |$. The spin-up time was at least
 $1$ hour and up to 4 h depending upon the fluid depth and rotation rate.
Different methods of delivering the fluid from the reservoir to the nozzle were used. In most experiments reported upon here (A, L), the flow was driven by a peristaltic pump. In the C-experiments, the reservoir was a constant-head tank situated above the surface of the ambient fluid. In the M-experiments, the reservoir was suspended above the tank with fluid passing through a valve that controlled the flow rate. During the course of the experiment, the depth of reservoir fluid dropped by at most 1 cm. The gravity-driven flow rate could be taken as approximately constant in these experiments because the surface of the reservoir dropped by no more than 1 % of the distance between the reservoir surface and the surface of fluid in the tank (at total distance of at least 1 m).
A.2. Visualization methods
For all experiments, a camera that rotated with the table was set to look through one of the side-walls of the tank. In the A- and C-experiments, back lighting passing through a translucent mylar sheet was situated opposite this side-view camera, and the plume itself was dyed with food colouring. This enabled clear visualization of the precession of the rotating plume and of the formation of the tornado when it occurred, as shown for example in figure 1.
In the L- and M-experiments a vertical laser light sheet shone through the plume centreline in a plane perpendicular to the line of sight of the side camera. In both sets of experiments, the tank was seeded with hollow glass microspheres used to visualize and measure the ambient fluid motion through PIV. For the M-experiments the plume fluid was dyed with Rhodamine-B so that the boundary between the turbulent plume and ambient fluid was readily visualized. Even though the PIV particles transiently passed through the light sheet, because the sheet was approximately 1 mm thick, they passed within the plane long enough to be captured by the camera at its frame rate of 60 f.p.s., as confirmed by the streak images in the right panels of figure 4.
Also for the L- and M-experiments, a second laser created a horizontal light sheet situated 6–8 cm below the nozzle opening. This was viewed with a second camera. In the M-experiments the camera was situated  ${\simeq }1$ m above the tank bottom; in the L-experiments the camera was located below and to the side of the tank and viewed the horizontal motion through an angled mirror situated below the tank. The horizontal and vertical laser light sheets had different colours, and filters were applied to the corresponding viewing cameras so as selectively to block one of the colours. Thus simultaneous horizontal and vertical measurements of velocity around the plume were made possible. PIV analysis was performed using the software ‘UVMAT’ (a free Matlab toolbox available at servforge.legi.grenoble-inp.fr/projects/soft-uvmat).
The time evolution of the horizontal flow was examined first by locating the centroid,  $\boldsymbol {x}_c= (x_c,y_c)$, of the speed measured with horizontal PIV. These measurements were unreliable within 1 cm of the centre of plume primarily due to the fast vertical transport of particles across the horizontal laser light sheet. Ignoring this region, the speed in the horizontal plane was found to be approximately annular, and the measured centroid,
 $\boldsymbol {x}_c$, of the annulus was observed to well represent the centre of the flow field. With respect to the position of the centroid, the horizontal velocity field was decomposed into the azimuthal and radial components, and these were then azimuthally averaged to form time series of
 $u_\theta$ and
 $u_r$, respectively. The accuracy in the measurement of
 $u_\theta$ and
 $u_r$ was assessed by computing the standard deviation in the azimuthal average at each time. If the mean was less than a standard deviation, then the field was set to zero. In practice, we found that the mean radial velocity was less than or comparable to the standard deviation, making such measurements unreliable. However, beyond 1–2 cm from the centroid, the azimuthal velocity exhibited a sufficiently coherent flow to provide a good signal-to-noise ratio. Radial time series of the azimuthal velocity are shown in the bottom row of figure 5 for each of the three experiments.
Appendix B. Numerical simulations: set-up and analysis methods
Numerical simulations were run using the open-source software OpenFOAM, version 19.06, which employed a finite-volume scheme written in C ${+}{+}$. The code has previously been applied to investigations of plumes (Wang, Chatterjee & de Ris Reference Wang, Chatterjee and de Ris2011; Kumar & Dewan Reference Kumar and Dewan2014; Suzuki et al. Reference Suzuki, Costa, Cerminara, Esposti Ongaro, Herzog, Van Eaton and Denby2016) through the use of a pre-built solver ‘buoyantBoussinesqPimpleFoam’. This was further adapted to include the addition of the Coriolis force to the momentum equations. Because the flow within the plume was turbulent, the code was run as a large-eddy simulation (LES) using a pre-built subgrid-scale one-equation eddy viscosity model (Yoshizawa Reference Yoshizawa1986), ‘kEqn’. This model solved a transport equation to compute the subgrid-scale kinetic energy, and subsequently obtained the subgrid-scale eddy viscosity. The LES simulation was thus improved by overcoming the shortcomings of the local equilibrium assumption (Smagorinsky Reference Smagorinsky1963) in high Reynolds number flows and/or flows simulated with coarse resolution (Huang & Li Reference Huang and Li2009).
In most simulations the main computational domain was prescribed as a cylinder of radius  $R_d=20\ \textrm {cm}$ and height
 $H_d=30\ \textrm {cm}$. A buoyant plume originated from the bottom of the main domain (at
 $z=0\ \textrm {cm}$) after passing through an expansion chamber similar in geometry to the turbulent plume nozzle used in experiments. Specifically, the fluid entered the chamber through a circular opening of radius 0.2 cm, flowed through a lower cylindrical neck region of height 0.1 cm, then passed through a cylindrical chamber of radius 0.4 cm and height 2 cm and finally passed through another cylindrical neck region of radius
 $b_0=0.2\ \textrm {cm}$ and height 0.1 cm before entering the bottom of the main domain. No-slip boundary conditions were prescribed within the chamber and neck regions to enhance the turbulent character of the flow entering the main domain. The top of the domain was prescribed as an outlet ensuring that the volume flux leaving the top matched the volume flux entering through the inlet. Consequently, a fraction of the plume fluid reaching the top of the domain passed vertically through it while the majority spread radially toward the sidewalls. The bottom and sidewalls of the main domain were prescribed either with no-slip or free-slip boundary conditions. The choice of boundary conditions was found insignificantly to affect the plume dynamics. However, in some simulations tornados formed with no-slip conditions but not with free-slip conditions and vice versa. Consequently, Ekman pumping, which would occur in the presence of a no-slip bottom boundary condition, did not dictate whether or not a tornado formed. However, its influence did contribute to the randomness influencing its formation or suppression.
Given this geometry, the interior mesh was created with the open-source software, Gmsh. In each horizontal plane, this created a tessellated grid with resolution 0.1 cm around the circumference of the inlet and chamber. Within the main domain the circumferential resolution increased linearly from  $0.1\ \textrm {cm}$ to
 $0.2\ \textrm {cm}$ between the circular opening at the bottom of the main domain (centred at
 $r=0$) and a radius of 9 cm. Between 9 cm and the radius
 $R_d=20\ \textrm {cm}$ of the sidewalls the circumferential resolution increased linearly from 0.2 cm to 2.0 cm. The tessellated grid was extruded vertically to maintain a vertical resolution of 0.1 cm. The high resolution near
 $r=0$ was found to give sufficient resolution for the LES of the plume, whereas the coarse resolution near the sidewalls (where the flow was relatively slow and large scale) allowed for faster runtime of the code. Running in parallel on 64 CPUs with time steps no greater than 0.001 s (ensuring a Courant number no greater than 0.5), the code took approximately 22 h to simulate 30 s of the plume and ambient fluid evolution.
Simulations were run with parameters similar to those of the L-experiments. The buoyancy of the plume was set by prescribing its temperature,  $T$, and using the linear relation
 $\rho = 1 - \alpha _T (T-{T}_{{ref}})$ to compute the corresponding non-dimensional density, in which
 $\alpha _T=0.0002\ \mbox {K}^{-1}$ is the thermal expansion coefficient and
 ${T}_{{ref}}=293$ K. Initially the fluid in the main domain was set to have temperature
 ${T}_{{ref}}$. The fluid in the ‘nozzle’ was set initially to have temperature
 $T$, which was also the temperature of fluid entering the inlet during the course of a simulation. In most simulations, we set
 $T=625\ \textrm {K}$, corresponding to a density difference between the ambient and source fluid of
 $0.0664\ \mbox {g}\ {\mbox {cm}}^{-3}$, and a source reduced gravity
 $|g_0^{\prime }|=65\ \mbox {cm}\ {\mbox {s}}^{-2}$, similar to that in experiments having a saline source with density
 $1.067\ \mbox {g}\ {\mbox {cm}}^{-3}$ injected downward into fresh water. Notably, in one simulation the source temperature was set to be the same as that of the ambient so as to examine a rotating jet.
The vertical velocity,  $w_0$, was prescribed at the inlet. In addition, the intensity of turbulence at the source was modified using a precursor method (Tabor & Baba-Ahmadi Reference Tabor and Baba-Ahmadi2010) in which the source velocity randomly fluctuated typically by 10 % of its mean value. The laminar kinematic viscosity of the fluid was
 $\nu =0.0004\ {\mbox {cm}}^2\ \mbox {s}^{-1}$, which is smaller than that of water in order to enhance turbulent flow leaving the source. This was done to compensate for the lack of a turbulence-generating screen, which was situated over the nozzle opening in laboratory experiments. Once the flow was rendered turbulent, the specific value of the laminar viscosity insignificantly affected the flow evolution because of the large source Reynolds number,
 $\textit {Re}_0\equiv w_0 b_0/\nu$. The diffusivity,
 $\kappa$, for temperature was defined by
 $\nu /{Pr}$ in which the laminar Prandtl number was set to be
 ${Pr}=7$. For numerical efficiency, this is much smaller than the corresponding Schmidt number (characterizing relative salt diffusivity) of the laboratory experiments. However, it is anticipated that the turbulent flow is insensitive to the value of the laminar diffusivity. The corresponding turbulent Prandtl number,
 $Pr_t$, was chosen to be
 $0.7$, consistent with the simulations of van Reeuwijk et al. (Reference van Reeuwijk, Salizzoni, Hunt and Craske2016).
The third key parameter explored in simulations was the background rotation. As a control, some simulations had no background rotation. Otherwise  $\varOmega$ was set, as in the L-experiments, to range between
 $\varOmega =0.1$ and
 $0.5\ {{\mbox {s}}^{-1}}$.
In all simulations the plume rose to the top of the domain and then spread radially outward, though some fluid passed through the top of the domain so as to match the volume flux at the inlet. The radial spread of the plume did not influence the dynamics near the source over the duration of the simulations, as confirmed by simulations performed either with double the domain height or with a larger radius of  $R_d=30\ \textrm {cm}$.
As a test of the quantitative accuracy of the numerical results, a simulation was performed with no background rotation of a pure plume having source buoyancy parameter  ${\mathcal {B}}_0=1$. To analyse the plume structure, the azimuthally averaged perturbation density field was temporally averaged between
 $4$ and 8 s and then the radial profiles at each height between the source and
 $z=10$ cm were fit to a Gaussian of the form
 $\rho _p = \rho _c \exp (-r^2/b^2)$. Consistent with expectations, the radial profiles were well represented by a Gaussian, and the width
 $b(z)$ increased linearly with height sufficiently far from the source. Extrapolating downward to where the linear fit to
 $b$ was zero, put the virtual origin of the plume at
 $z_v\simeq 1.6\ (\pm 0.6)\ \textrm {cm}$ above the source. The upward displacement of
 $z_v$ is due to the fluid leaving the nozzle not being fully turbulent. As expected for a pure plume, the momentum and volume fluxes were found to decrease with height above
 $z_v$ with power laws of
 $-1.3 \ (\pm 0.1)$ and
 $-1.7 \ (\pm 0.1)$, respectively, consistent with the theoretical power laws of
 $-4/3$ and
 $-5/3$ (not shown). Because most experiments showed tornado formation only for lazy plumes (
 ${\mathcal {B}}_0>1$), we also performed a simulation with no rotation and with
 $w_0=5.7\ \mbox {cm}\ \mbox {s}^{-1}$ and
 $|g_0^\prime |=65\ \mbox {cm}\ {\mbox {s}}^{-2}$ (hence
 ${\mathcal {B}}_0=5.0$), similar to the source velocity and reduced gravity of experiment L10, shown in figure 5(b). In this case the virtual origin was found to lie
 $z_v\simeq 2.4\pm 0.4\ \textrm {cm}$ above the source and the plume width was nearly constant between
 $z=0$ and
 $2\ \textrm {cm}$ before increasing linearly with height above the virtual origin. The upward shift in
 $z_v$ compared to the case with
 ${\mathcal {B}}_0=1$ is expected for a lazy plume.
Because most experiments and simulations were performed for lazy plumes, for consistency the results presented here are scaled with the effective source parameters, in particular the effective source vertical velocity  $w_{0,{eff}}$, measured according to (2.8). In the simulation discussed above with no rotation and
 ${\mathcal {B}}_0=5.0$, we found
 $w_{0,{eff}}\simeq 13.4\ \mbox {cm}\ \mbox {s}^{-1}$, more than twice the source velocity,
 $w_0$. Measurements of the actual centreline vertical velocity averaged over times between
 $5$ and 10 s had a maximum of
 $13.3\ \mbox {cm}\ \mbox {s}^{-1}$ at
 $z=2.9\ \textrm {cm}$. This value and its location were comparable to
 $w_{0,{eff}}$ and the measured virtual origin,
 $z_v$, respectively.
In simulations with rotation, the radius of the plume likewise was calculated by fitting a Gaussian to the azimuthally and temporally averaged density field, except in the case of a rotating jet simulation for which the vertical velocity field was used to find  $b(z)$. The virtual origin and effective source parameters were likewise computed. Table 2 lists the parameters of the simulations examined here, including the results of analyses.



