INTRODUCTION
Paleoenvironmental reconstructions rely on accurate chronologies and explicit proxy records (An et al., Reference An, Porter, Kutzbach, Wu, Wang, Liu, Li and Zhou2000; Zhang et al., Reference Zhang, Ming, Lei, Zhang, Fan, Chang, Wünnemann and Hartmann2006; Long et al., Reference Long, Lai, Fuchs, Zhang and Yu2012), which can be compared with records from global and other regions (Wang et al., Reference Wang, Cheng, Edwards, An, Wu, Shen and Dorale2001; Braconnot et al., Reference Braconnot, Harrison, Kageyama, Bartlein, Masson-Delmotte, Abe-Ouchi, Otto-Bliesner and Zhao2012; Mulvaney et al., Reference Mulvaney, Abram, Hindmarsh, Arrowsmith, Fleet, Triest, Sime, Alemany and Foord2012; Martínez-Botí et al., Reference Martínez-Botí, Foster, Chalk, Rohling, Sexton, Lunt, Pancost, Badger and Schmidt2015). Therefore, accurate dating results and robust proxy records are an essential prerequisite for reconstructing paleoenvironments and investigating the mechanism of climate change. Few applicable dating materials and valuable archives of paleoenvironmental evolution are present in the hinterland of the desert, however, leading to difficulty in reconstructing environmental changes at a millennial resolution during the Holocene (Yang et al., Reference Yang, Scuderi, Paillou, Liu, Li and Ren2011; Li et al., Reference Li, Wang, Cheng, Ning, Zhao and Li2015a). The paleoclimate information from the arid deserts mainly comes from lake sediments, lake-level variations, and aeolian deposits, because of that there is a scarcity of materials suitable for 14C dating available in deserts (Zhang et al., Reference Zhang, Ming, Lei, Zhang, Fan, Chang, Wünnemann and Hartmann2006; Yang et al., Reference Yang, Scuderi, Paillou, Liu, Li and Ren2011) . In addition, the 14C ages of organic matter and inorganic carbonate in lake sediments are affected by many factors, including reservoir and hard water effects (Wang et al., Reference Wang, Li, Li, Cheng and Huang2012; Zhang et al., Reference Zhang, Ma, Qiang, Huang, Li, Guo, Henderson, Holmes and Chen2016) and the reworking effect (Zhang et al., Reference Zhang, Ming, Lei, Zhang, Fan, Chang, Wünnemann and Hartmann2006). Moreover, fierce wind erosion and fluvial action can result in a depositional hiatus or reworking in some strata (Wang et al., Reference Wang, Li, Li and Cheng2013; Nottebaum et al., Reference Nottebaum, Lehmkuhl, Stauch, Lu and Yi2015). Furthermore, some reconstruction parameters, such as lake levels, are also affected by non-climate factors (Yang and Scuderi, Reference Yang and Scuderi2010). Thus, identifying archives of paleoenvironmental evolution and reconstructing environmental changes at a millennial resolution in the hinterland of the desert are beneficial to assess past global climate change and to study the mechanisms of past climate change.
Calcareous root tubes (CRTs), also known as rhizoliths or calcified roots, are tubular voids formed by precipitation of secondary carbonate in calcareous soils around the roots of terricolous plants (Klappa, Reference Klappa1980; Gocke et al., Reference Gocke, Pustovoytov, Kühn, Wiesenberg, Löscher and Kuzyakov2011a; Zamanian et al., Reference Zamanian, Pustovoytov and Kuzyakov2016). Previous studies have suggested that the 14C dates for CRTs were reliable at a millennial resolution for Holocene ages (Kuzyakov et al., Reference Kuzyakov, Shevtzova and Pustovoytov2006; Pustovoytov et al., Reference Pustovoytov, Schmidt and Parzinger2007; Gocke et al., Reference Gocke, Pustovoytov, Kühn, Wiesenberg, Löscher and Kuzyakov2011a; Li et al., Reference Li, Wang, Cheng, Ning, Zhao and Li2015a). Moreover, CRTs are described as being of absolute biogenic origin (Zamanian et al., Reference Zamanian, Pustovoytov and Kuzyakov2016) and form significantly faster than other secondary carbonates, such as calcareous nodules in soils (Gocke et al., Reference Gocke, Pustovoytov, Kühn, Wiesenberg, Löscher and Kuzyakov2011a). This suggests that local environmental conditions could be preserved in CRTs and, as such, CRTs have been widely used for paleoenvironmental reconstructions in loess-paleosol sequences and desert areas (Kraus and Hasiotis, Reference Kraus and Hasiotis2006; Liutkus, Reference Liutkus2009; Huguet et al., Reference Huguet, Wiesenberg, Gocke, Fosse and Derenne2012; Wang et al., Reference Wang, Dong, Lu, Li, Luo, Cui, Zhang, Liu and Jiao2015). In previous studies, paleoenvironmental and paleovegetation changes have been discussed using the isotopic composition and lipid molecular proxies from CRTs (Hearty and O’Leary, Reference Hearty and O’Leary2008; Huguet et al., Reference Huguet, Wiesenberg, Gocke, Fosse and Derenne2012; Gallant et al., Reference Gallant, Candy, van den Bogaard, Silva and Turner2014; Gocke et al., Reference Gocke, Hambach, Eckmeier, Schwark, Zöller, Fuchs, Löscher and Wiesenberg2014; Li et al., Reference Li, Gao and Han2017). It is still uncertain, however, whether additional paleoenvironmental signals can be obtained from the CRTs. Moreover, there is a lack of research in determining which factors affect the elemental composition and the content change of the CRTs and whether chemical elements in the CRTs can identify paleoenvironmental conditions. Thus, resolution of such questions has great significance in determining additional evidence for the CRT formation mechanism in desert areas and could provide new significant archives of the evolution of paleoenvironmental conditions in the hinterland of the desert.
In this study, we focus on Holocene CRTs in the Alashan Desert, located in the mid-latitude regions of China. Major- and trace-element compositions of 32 CRT samples from the Alashan Desert were measured by X-ray fluorescence spectrometry to analyze their elemental composition, content change, and elemental migration, and to further explore their controlling factors. Moreover, we attempt to identify and use paleoenvironmental proxies from CRTs to reconstruct environmental changes at a millennial resolution in the hinterland of the Alashan Desert.
Study AREA
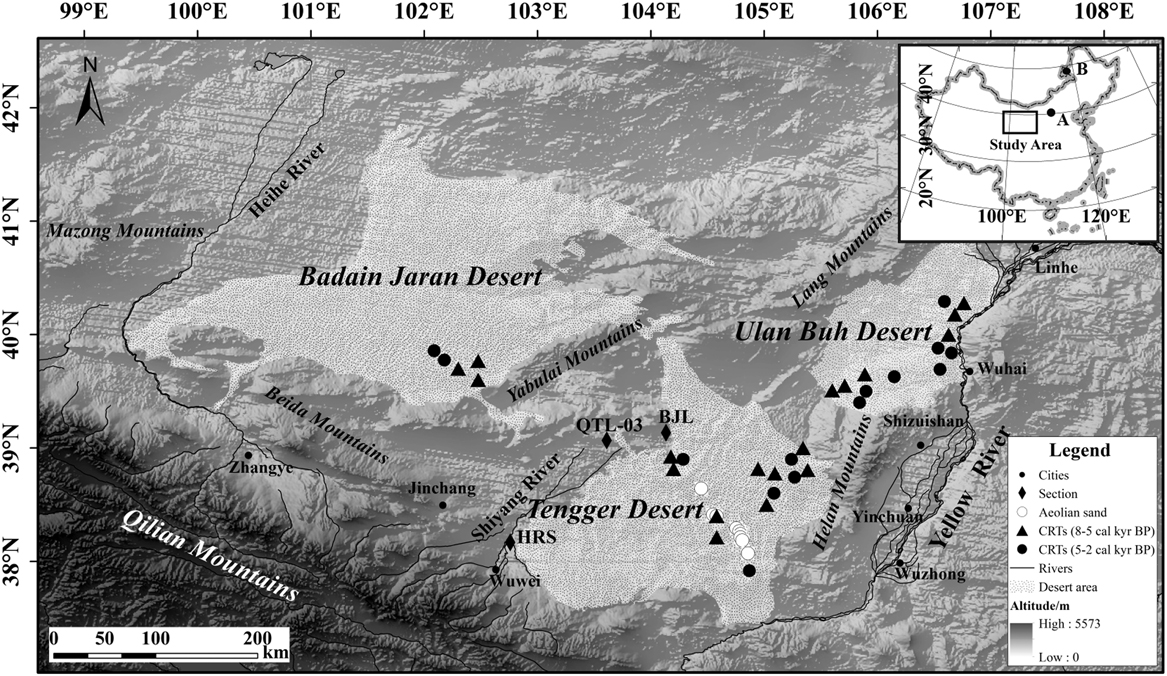
The Alashan Desert is located in an arid region of northwestern China, between the Chinese border and the Hexi Corridor (Fig. 1). With an area of approximately 100,000 km2 and an average elevation of 1250 m, the Alashan Desert includes the Badain Jaran, Tengger, and Ulan Buh deserts (Fig. 1). The Badain Jaran Desert, with an area of 52,000 km2, is the second-largest desert in China (Zhu et al., Reference Zhu, Wang, Chen, Dong and Zhang2010) and is bounded by the Yabulai Mountains to the east, Ruoshui River to the west, the Beida Mountains to the south, and Guaizi Lake to the north. The Tengger Desert, with an area of 42,700 km2, is the fourth-largest desert in China (Zhu et al., Reference Zhu, Wu and Liu1980) and lies among the Helan, Qilian, and Yabulai mountains. The Ulan Buh Desert, with an area of 11,000 km2, is surrounded by the Yellow River, the Langshan, Bayan Ural, and Helan mountains to the east, north, west, and south, respectively.
Locations of the calcareous root tubes (CRTs) sampled from the Alashan Desert: (A) Daihai Lake; (B) Hulun Lake. BJL, Baijian Lake; QTL-03, section in the Zhuyeze terminal lake; HRS, Hongshui River section.

Geologically, the Badain Jaran and Tengger deserts are located at the boundary of the northern Tarim plate and the southern North China plate, along the Engger Us ophiolitic mélange zone. The Badain Jaran Desert is located in the central and eastern subsided basins of the Alxa block. Since the early Pleistocene, up to 150 m of Quaternary sediment, created by subduction of the crust, covered this area. Subsequently, aeolian deposits predominate in the main region of the desert (Cai, Reference Cai1987). The Tengger Desert belongs to the middle Chaoshui basin-Tengger depression and is covered by sand and clay-like Quaternary alluvial-lacustrine deposits (Wang and Wang, Reference Wang and Wang1997). The Ulan Buh Desert is essentially part of the Hetao basin, a Cenozoic fault basin surrounded by the Ordos Plateau. A lacustrine environment was present intermittently in the Quaternary, as evidenced by the extensive Quaternary lacustrine sediments appearing throughout the desert (Chen et al., Reference Chen, Li, Zhao, Jin, Chen, Fan, Liu, Wu and Madsen2014). Regarding geomorphology, the Badain Jaran and Tengger deserts consist primarily of moving dunes. The largest megadunes in the world are distributed in the southeastern region of the Badain Jaran Desert, where the sand dunes attain average heights of 200–300 m and a maximum height of 500 m. In the Ulan Buh Desert, the high-dune zone is located mainly in the south, whereas fixed and semi-fixed dunes ~10 m in height are dominant in the northern part. An extensive paleolacustrine plain and numerous salt lakes exist in the desert hinterland (Zhao et al., Reference Zhao, Li, Sheng, Jin and Chen2012).
The Alashan Desert is located in the climatic transition zone of the Asian summer monsoon and westerly belt (Yang et al., Reference Yang, Scuderi, Paillou, Liu, Li and Ren2011) and is characterized by a strongly continental climate. The mean annual temperature is about 6–10°C. Temperatures in January and July are -12–9°C and 22–26°C, respectively. Mean annual precipitation decreases significantly from ~120 mm in the southern region of the desert to 40 mm in the northern region, whereas the mean annual potential evaporation rate from water surfaces is more than 1000 mm/year (Yang et al., Reference Yang, Ma, Dong, Zhu, Xu, Ma and Liu2010; Li et al., Reference Li, Pan, He and Zhang2016b). Vegetation is dominated by shrubs and subshrubs such as Haloxylon, Nitraria, Tamarix, Reaumuria, Ammopiptanthus, and Nitraria species. Soil types are mainly desert soil, gray–brown desert soil, and sandy soil (Ma, Reference Ma1989).
MATERIAL AND METHODS
Sample collection
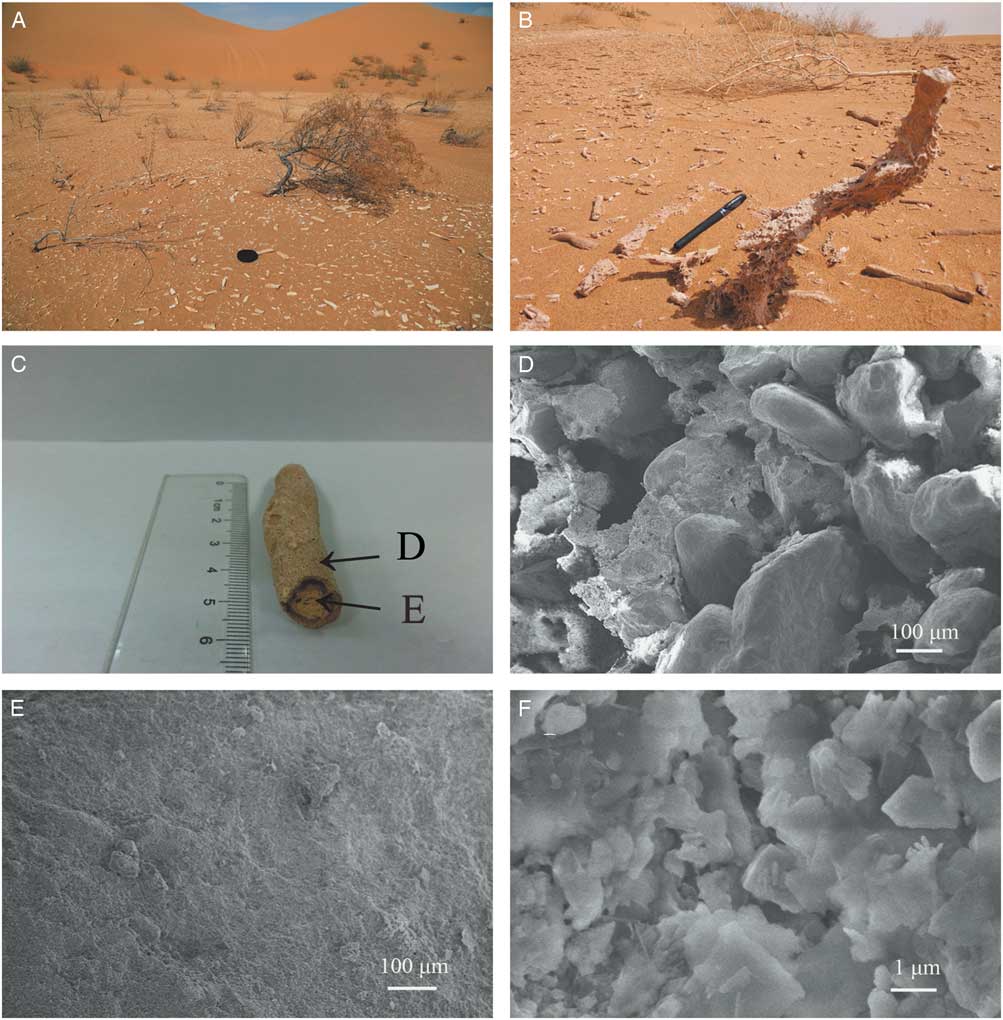
CRTs occur widely across the Alashan Desert and have been exposed by wind deflation of dunes. Most of the CRTs were scattered horizontally on the surfaces of sand layers in the inter-dune slack (Fig. 2A and B) and distributed from the surface layer to a depth of 10 cm (Li et al., Reference Li, Wang, Li, Ning, Cheng and Zhao2015b). The matrix material of the collecting localities is sandy soil, and many shrubs and a few herbs grow at most sampling sites. More detailed environmental conditions regarding collected samples have been provided in our previous studies (Li et al., Reference Li, Wang, Cheng, Ning, Zhao and Li2015a; Li et al., Reference Li, Wang, Li, Ning, Cheng and Zhao2015b). Morphologically, the CRTs in the Alashan Desert have a tubular morphology with a central void, formed by cementation of carbonate, and possess a pure white carbonate interior wall (Fig. 2C). Scanning electron microscope images revealed that the carbonate cement is mostly composed of calcite while other observed minerals like quartz, feldspars, and micas are derived from primary aeolian sands (Fig. 2D–F).
(color online) Pictures and scanning electron microscope (SEM) images of calcareous root tubes (CRTs) in the Alashan Desert. (A) Most of the CRTs were scattered horizontally on the surfaces of the inter-dune bottomland in the Alashan Desert. (B) A CRT extending down into the sand in the Tengger Desert. (C) CRT with double-layer structure, the outside of which was formed by carbonate cementing sand, while the inside of which was thick white carbonate. (D) SEM image of Zone D in (C). The surface of the quartz grain is coated by carbonate cement. (E) SEM image of the pure white carbonate of Zone E in (C). (F) Detailed view of (E), SEM image of calcite crystals.

The Holocene CRTs were collected from 32 locations in the Alashan Desert (Fig. 1). We targeted the most universal CRTs from one location for sampling and carbonate extracted from some of the samples were dated by conventional and accelerator mass spectrometry (AMS) radiocarbon analysis. The conventional 14C ages were measured at the Laboratory of Chronology, Lanzhou University, China, and the AMS 14C ages were determined at the Laboratory of Scientific Archaeology and Preservation of Cultural Relics, School of Archaeology and Museology, Peking University, China. The CRTs were formed of terricolous plant roots by secondary carbonates. Therefore, their 14C dates were slightly influenced by the reservoir effect. Nevertheless, it is still difficult to improve the reliability of the dating results at the centennial resolution because of the presence of other confounding factors such as the incorporation of older and younger C (Li et al., Reference Li, Wang, Li, Ning, Cheng and Zhao2015b). Li et al. (Reference Li, Wang, Cheng, Ning, Zhao and Li2015a) found that CRTs in the deserts of the Alashan Plateau could be used as 14C dating targets and that the 14C dates for CRTs were reliable at a millennial resolution for Holocene ages. This was consistent with results previously reported by Kuzyakov et al. (Reference Kuzyakov, Shevtzova and Pustovoytov2006), Pustovoytov et al. (Reference Pustovoytov, Schmidt and Parzinger2007), and Gocke et al. (Reference Gocke, Pustovoytov and Kuzyakov2011b). Moreover, a more detailed explanation can be found in our previous studies (Li et al., Reference Li, Wang, Cheng, Ning, Zhao and Li2015a, Reference Li, Wang, Li, Ning, Cheng and Zhao2015b, Reference Li, Gao and Han2017). The 14C-dating results of the CRT samples (Table 1) yielded a range of dates, with three samples from the Badain Jaran Desert dated at 8−5 cal ka BP and two dated at 5−2 cal ka BP (Li et al., Reference Li, Wang, Li, Ning, Cheng and Zhao2015b). Nine samples from the Tengger Desert were dated at 8−5 cal ka BP, and five were dated at 5−2 cal ka BP (Li et al., Reference Li, Wang, Li, Ning, Cheng and Zhao2015b). Six samples from the Ulan Buh Desert were dated at 8−5 cal ka BP, and seven were dated at 5−2 cal ka BP (Li et al., Reference Li, Wang, Li, Ning, Cheng and Zhao2015b).
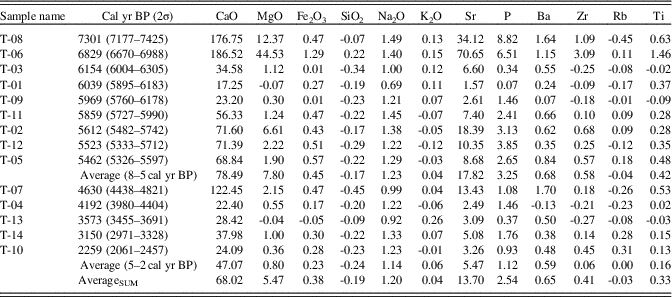
Elemental enrichment coefficients of CRTs in the Tengger Desert. Average (8–5 cal yr BP), the average of elemental enrichment coefficients between 8–5 cal yr BP; Average (5–2 cal yr BP), the average of elemental enrichment coefficients between 5–2 cal yr BP; AverageSUM, the average of elemental enrichment coefficients for all of the 14 samples.

Laboratory methods
Bulk samples of CRTs were taken for laboratory preparation and measurement in the Key Laboratory of Western China’s Environmental System, Lanzhou University. A few CRTs were singled out from one location and dried at low temperature (43°C) for 72 h and ground as one test sample. Powdered samples were sifted through a 200-mesh screen, then 4 g of each were poured into the center of a column apparatus with boric acid and pressurized for 20 s using the YYJ-40 semiautomatic oil hydraulic apparatus. Processed samples, approximately 32 mm in diameter and 8 mm thick, were measured with a Philips Panalytical Magix PW2403 X-ray fluorescence (XRF) spectroscope to analyze major- and trace-element contents in the CRTs. The element results have been compared with standard values from GBW07401 (GSS-1) and the standard deviations were estimated by repeated analysis of the samples. Standard deviations were <12% for W; <8% for Ba, Ce, Cr, Co, Sr, and Zr; <4% for Rb, Ti, Mn, P, Fe2O3, CaO, MgO, K2O, and Na2O; and <1% for SiO2 and Al2O3. Moreover, the accuracy and the precision for the result of the XRF method meets the analysis requirement (Supplementary Table 1). Major elements were reported in the form of oxides, whereas trace elements were given in elemental form. It is noteworthy that the methods that we used to analyze element composition, content change, and element ratios are widely used in geochemistry (Újvári et al., Reference Újvári, Varga and Balogh-Brunstad2008; Buggle et al., Reference Buggle, Glaser, Hambach, Gerasimenko and Marković2011; Qiao et al., Reference Qiao, Hao, Peng, Wang, Li and Liu2011; Liu et al., Reference Liu, Jin, Sun, Sun, Niu, Xie and Li2014; Ren et al., Reference Ren, Yang, Wang, Zhu, Zhang and Rioual2014) although their precision is less than inductively coupled plasma mass spectrometry.
Calculations and statistics
The method of cluster analysis used here was hierarchical cluster analysis. Owing to the large content difference between major and trace elements, we standardized the original data first to balance their respective weights. The maximum difference normalization can be calculated by the following formula:
 $$x^{'} _{{ik}} {\equals}{{x_{{ik}} {\minus}x_{k} (min)} \over {x_{k} \left( {max} \right){\minus}x_{k} (min)}} \quad (i{\equals}1,2,..., n\hbox {;}\,k{\equals}1,2,...,m),$$
where X ik represents the kth element of sample i, and X k (min) and X k (max) are the minimum and maximum of the kth element among all samples, respectively. After standardizing, we took the Euclidean distance as the class statistic amount to calculate the distance of different samples using Equation 2 and to obtain the initial distance matrix:
 $$ d_{{ij}} {\equals}\sqrt {\mathop{\sum}\limits_{k{\equals}1}^n {(x_{{ik}} {\plus}x_{{jk}} )^{2} } } \quad (i,j{\equals}1,2, ...,m),$$
where d ij represents the distance between sample i and sample j. Then, G 1 , G 2 …is used to represent the category, and D pq represents the distance of the two categories G p and G q . Next, the minimum distance among each pair of categories, namely the minimum of D pq , is found in the initial distance matrix, and these two categories are merged as a new category G r , G r ={G p , G q }. The distance between two clusters is defined by the unweighted pair group method with arithmetic mean. The following formula is used to calculate the square of a distance between the new category G r and the other categories:
 $$ D^{2} _{{rk}} {\equals}{1 \over {n_{p} n_{q} }}\mathop\,{\sum}\limits_{i\in G_{p} } {\mathop\,{\sum}\limits_{j\in G_{q} } {d^{2} _{{ij}} ,} } $$
where D 2 rk is the mean square distance between the new category G r and the other categories, and n p and n q are the numbers of sample data of G p and G q , respectively. Then, the two categories that have the minimum square distance will be merged. Finally, the above steps should be repeated until all of the samples are merged in the same category.
Leaching and migration of the active geochemical elements likely gave rise to the increased amounts of relatively stable elements in the samples, which may distort the actual features of element migration or enrichment (Chen et al., Reference Chen, Ji, Qiu and Lu1998). In order to eliminate this distortion, the elemental enrichment coefficient is applied to estimate the extent of migration and enrichment by calculating the variation ratio of an element in comparison with some of the stable elements such as K, Ti, and Al (Gallet et al., Reference Gallet, Jahn and Torii1996; Chen et al., Reference Chen, Ji, Qiu and Lu1998):
 $$\Delta \left( \,\%\, \right){\equals}\left[ {\left( {X_{S} \,/\,I_{S} } \right)\,/\,\left( {X_{P} \,/\,I_{P} } \right){\minus}1} \right]{\times}100,$$
where Xs and Is represent the content of any other element X and stable element I in the sample, respectively, and Xp and Ip represent those in the parent material. Obviously, if Δ<0, element X is leached; otherwise, element X is relatively enriched. Δ=0 indicates that element X has been relatively stabilized. CRTs were formed on the surfaces of ancient dunes (Yang, Reference Yang2000); most are located in the inter-dune slack of modern deserts (Yan et al., Reference Yan, Wang, Li and Dong2001; Li et al., Reference Li, Wang, Cheng, Ning, Zhao and Li2015a). In previous studies, the composition and content of elements between ancient moving dunes and the modern ones were shown to be parallel (Yang et al., Reference Yang, Li, Li, Liu, Ouyang, Wen, Ou and Zeng2007). Therefore, the composition and content of elements in the modern aeolian sand could be treated as those in the original parent that formed CRTs. In addition, all of the CRTs in the Tengger Desert were formed during the Holocene, and the chronosequence was relatively integrated (Li et al., Reference Li, Wang, Cheng, Ning, Zhao and Li2015a; Li et al., Reference Li, Wang, Li, Ning, Cheng and Zhao2015b). Moreover, the homogeneous composition of aeolian sand in the Tengger Desert enabled the source of the CRTs to be consistent (Li, Reference Li2011). Therefore, in this study, the aeolian sand in the Tengger Desert was considered to be the parent material, and Al was used as the stable element to calculate the percentage changes of elements from 14 samples.
RESULTS
The results of XRF spectrometry for the CRTs revealed that the seven major element oxides included SiO2, Al2O3, Fe2O3, K2O, Na2O, MgO, and CaO, whereas the 12 trace elements included P, Mn, Ti, Rb, Sr, Bi, Ba, Zr, Ce, Co, Cr, and W. The CaO content reached the maximum among the major element oxides, with a content ranging from 14.9 to 77.2%, with an average content of 36.3%. The Fe2O3 content had the lowest content, with a range and average of 0.3–2.1% and 1.2%, respectively. Among the trace elements the content of Ti was highest with an average of 1036.1 ppm and a range of 390.4–2190.9 ppm, whereas the Bi content was lowest, with an average of 30.9 ppm and a range of 0–97.8 ppm. The contents of other major and trace elements were disparate in different CRT samples.
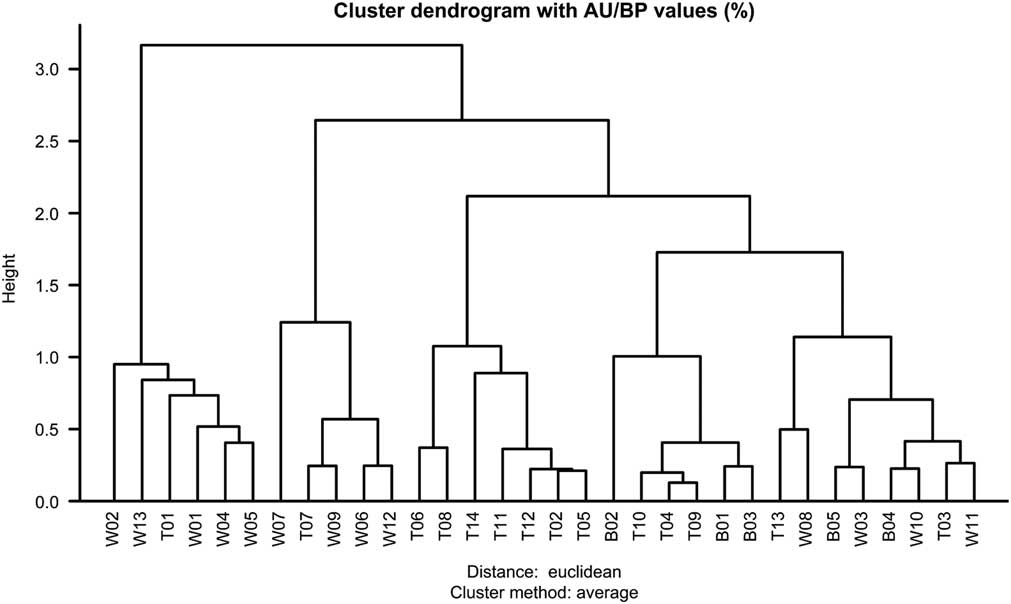
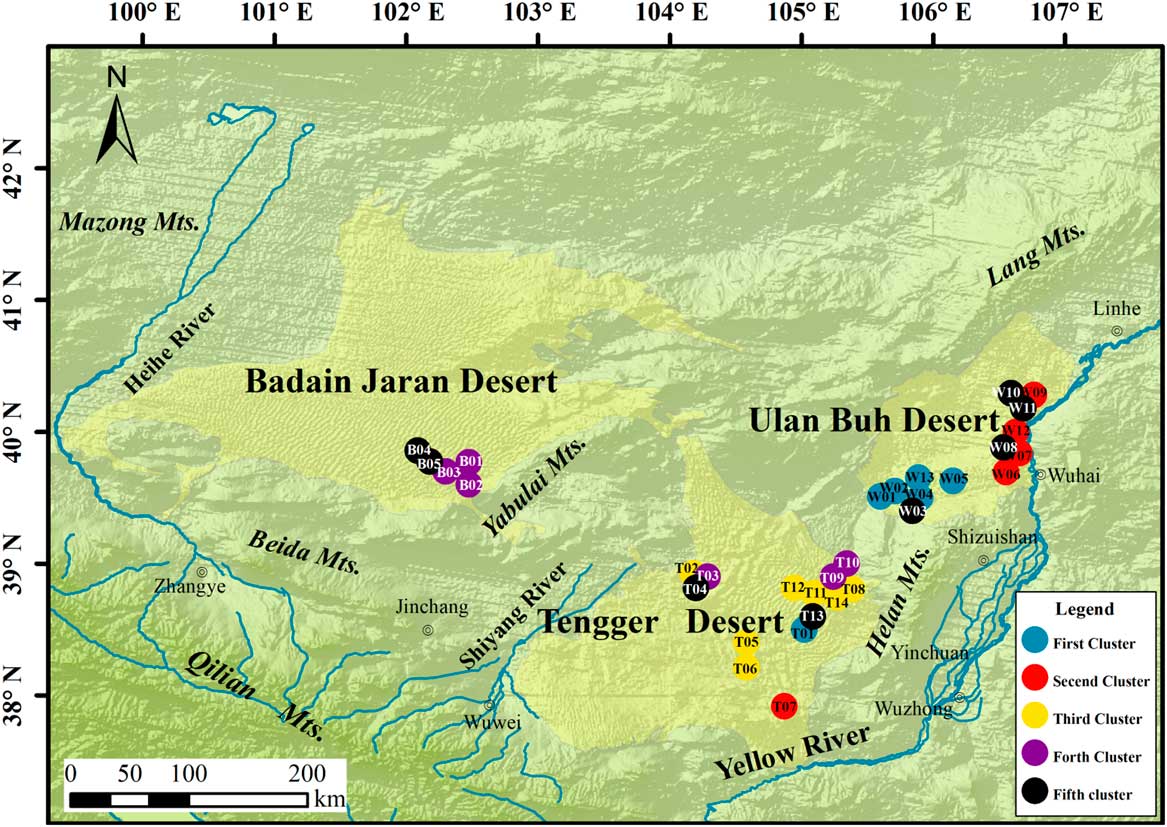
The results of cluster analysis showed that the dendrogram is effectively divided into five main clusters (Fig. 3). The first cluster consisted of six samples, five of which were obtained in the southern Ulan Buh Desert; only one occurred in the northeast Tengger Desert (Fig. 4). In terms of chronology, four of the samples formed in the middle Holocene (8−5 cal ka BP), and two were formed in the late Holocene (5−2 cal ka BP). The average contents of active elements or their oxides, CaO, MgO, and Sr, were 19.28%, 2.66%, and 555.40 ppm, respectively (Supplementary Table 2). The average contents of inactive elements, Ba, Rb, Ti, and Zr, were 699.5, 54.9, 1523.3, and 109.0 ppm, respectively (Supplementary Table 2).
Results of the cluster method for elements in the CRTs. The method of cluster analysis used here was hierarchical cluster analysis. The dendrogram is effectively divided into five main clusters.

(color online) Locations of the five CRT clusters in the Alashan Desert. The first cluster consisted of six samples and most of them were obtained in the southern Ulan Buh Desert. The second cluster consisted of five samples, most of which were acquired from the eastern or northern Ulan Buh Desert. The third cluster consisted of seven samples, all of which were obtained from the Tengger Desert. The fourth cluster consisted of six samples, half of which were collected in the southeastern Badain Jaran Desert; the other half were obtained from the northern Tengger Desert. The fifth cluster consisted of eight samples scattered in the three deserts.

The second cluster consisted of five samples, four of which were acquired from the eastern or northern Ulan Buh Desert; only one occurred in the southeastern Tengger Desert (Fig. 4). In terms of chronology, two samples were formed in the middle Holocene (8−5 cal ka BP), and three formed in the late Holocene (5−2 cal ka BP). The average contents of active elements or their oxides, CaO, MgO, and Sr, were 64.59%, 1.24%, and 1065.48 ppm, respectively (Supplementary Table 2). The average contents of inactive elements, Ba, Rb, Ti, and Zr, were 561.7, 24.9, 936.8 and 63.8 ppm, respectively (Supplementary Table 2).
The third cluster consisted of seven samples, all of which were obtained from the Tengger Desert (Fig. 4). In terms of chronology, six samples formed in the middle Holocene (8−5 cal ka BP); only one formed in the late Holocene (5−2 cal ka BP). The average contents of active elements or their oxides, CaO, MgO, and Sr, were 39.8%, 2.0%, and 808.9 ppm, respectively (Supplementary Table 2). The average contents of inactive elements, Ba, Rb, Ti, and Zr, were 313.4 ppm, 21.7 ppm, 623.8 ppm, and 64.8 ppm, respectively (Supplementary Table 2).The fourth cluster consisted of six samples, three of which were collected in the southeastern Badain Jaran Desert; the remaining three were obtained from the northern Tengger Desert (Fig. 4). In terms of chronology, four samples formed in the middle Holocene (8−5 cal ka BP) and two formed in the late Holocene (5−2 cal ka BP). The average contents of active elements or their oxides, CaO, MgO, and Sr, were 24.9%, 0.8%, and 378.8 ppm, respectively (Supplementary Table 2). The average contents of inactive elements, Ba, Rb, Ti, and Zr, were 366.4, 33.5, 885.4, and 82.8 ppm, respectively (Supplementary Table 2).
The fifth cluster consisted of eight samples. Two were obtained from both the Badain Jaran and Tengger deserts, and four were collected in the northern Ulan Buh Desert (Fig. 4). In terms of chronology, two samples formed in the middle Holocene (8−5 cal ka BP), whereas six formed in the late Holocene (5−2 cal ka BP). The average contents of active elements or their oxides, CaO, MgO, and Sr, were 33.2%, 1.3%, and 620.7 ppm, respectively (Supplementary Table 2). The average contents of inactive elements, Ba, Rb, Ti, and Zr, were 598.6, 42.2, 1344.8, and 86.8 ppm, respectively (Supplementary Table 2).
One-way analysis of variance was applied to test cluster variable contributions to the cluster analysis. The results showed that the six major element oxides SiO2, Al2O3, K2O, Na2O, CaO, and Fe2O3, and seven trace elements Ti, Rb, Bi, Ba, Ce, W, and Zr, were all in the very significant level (P<0.01), which demonstrated that they made important contributions to the cluster analysis.
Modern aeolian sand was considered to be the parent material used to calculate elemental enrichment coefficients of the CRTs in the Tengger Desert (Supplementary Table 2). SiO2, K2O, Fe2O3, Rb, Ti, Zr, and Ba displayed Δ values close to 0, -0.19%, 0.04%, 0.38%, -0.03%, 0.33%, 0.41%, and 0.65%, respectively, which indicated that these elements or oxides were very stable and likely inherited the characteristics of the parent material. The Δ values of Na2O, MgO, and P varied between 1 and 10%, at 1.20%, 5.47%, and 2.54%, respectively, which indicated that these elements or oxides were slightly enriched in the CRTs. CaO and Sr displayed Δ values >10%, at 68.02% and 13.70%, respectively, indicating that these elements or oxides were highly active and strongly enriched in the CRTs (Table 1). The contents of Ca, Mg, and Sr had significantly positive correlation with their enrichment coefficients, at 0.776, 0.985. and 0.847, respectively (P<0.01), whereas that of phosphorus (P) was unrelated to its enrichment coefficient.
DISCUSSION
Migration and enrichment of chemical elements
In loose aeolian sediments or sands, root respiration, microbial activity, and acid secretion by the root would lead to the creation of carbonic acid that can dissolve some of the carbonate grains of the dune (Alonso-Zarza et al., Reference Alonso-Zarza, Genise, Cabrera, Mangas, Martín-Pérez, Valdeolmillos and Dorado-Valiño2008). Moreover, the interdune depressions, where the CRTs developed, functioned as excellent catchment areas in the deserts. Although the aeolian sands of these regions are quartz-rich, previous studies have suggested that the average carbonate content of the Badain Jaran, Tengger, and Ulan Buh deserts are 4.64%, 2.57%, and 1.72%, respectively (Wang et al., Reference Wang, Cao, Zhang, Shen and Mei2004). Furthermore, the sedimentation of soluble salts via atmospheric processes, that is, aeolian dust, is a major source of carbonates in aeolian sands (Zhu et al., Reference Zhu, Yang, Rioual, Liu, Li and Xiong2011). At the same time, due to plants increasing mass flow to acquire scarce nutrients in the generally nutrient-poor sand, Ca could be delivered in excess of plant demand and would accumulate in the rhizosphere (Cramer and Hawkins, Reference Cramer and Hawkins2009). Furthermore, calcic minerals in aeolian sand, particularly in the rhizosphere, could release Ca2+ into soil water during relatively humid periods. Subsequently, the dissolved bicarbonates precipitate around the roots, owing to the root water uptake or evaporation of water in the rhizosphere, and then cement the loose sediments or sands, resulting in the formation of CRTs. In this study, the enrichment coefficient analysis revealed that Ca, Mg, Sr, and P were enriched in the CRTs, whereas the other elements were weakly enriched during CRT formation (Table 1). In addition, the strong correlation between the contents of Ca, Mg, Sr, and their enrichment coefficients demonstrated that these three elements were enriched along with the precipitation of carbonate during the formation of the CRTs.
In contrast, the content of P was unrelated to its enrichment coefficient, which revealed that the enrichment of P was independent of the carbonate precipitation. Gerke (Reference Gerke1994) suggested that plants extract soluble P sparingly through exudation of organic acids and recovery of the released P and that organic acids strengthen the microbial activity. Li et al. (Reference Li, Gao and Han2017) reported an abundance of short-chain n-alkanes generated by microorganisms from CRTs in the Alashan Desert, which indicated that microorganisms participated in the formation of the CRTs. Therefore, plants that form CRTs can extract soluble P through exudation of organic acids, which contributes to the enrichment of P in the CRTs.
Controlling factors of elemental composition and content change
During surficial processes, the elemental composition and content changes in sediments are controlled by parent material, transportation, and climate (Jin et al., Reference Jin, Cao, Wu and Wang2006; Xiong et al., Reference Xiong, Ding, Zhu, Zhou and Lu2010; Chang et al., Reference Chang, An, Wu, Jin, Liu and Song2013; Liu et al., Reference Liu, Jin, Sun, Sun, Niu, Xie and Li2014). Although CRTs formed in different periods, their formation mechanism remains consistent (Li et al., Reference Li, Wang, Cheng, Ning, Zhao and Li2015a). Thus, the same formation process could not result in the differences of elemental composition and content among different CRTs. The results of cluster analysis revealed that the five clusters of CRTs presented distinct spatial distribution and regional disparity, which indicated that the parent material has an important effect on the elemental composition and content in different CRTs (Fig. 4). In addition, even with similar parent material, the CRTs that formed in different periods would be classified into different clusters due to climate change.
Rb and Ba mainly exist in K-containing minerals, such as potassium feldspar. Thus, they are generally inactive during the chemical weathering process and most remain in situ (Zheng, Reference Zheng2007; Liu et al., Reference Liu, Jin, Sun, Sun, Niu, Xie and Li2014). In addition, Ti and Zr are recognized as stable elements and accumulate in minerals with high weathering resistance, such as zircon and rutile (Carroll, Reference Carroll1953; Chen et al., Reference Chen, Ji, Qiu and Lu1998). The low enrichment coefficients of Rb, Ba, Ti, and Zr could also demonstrate their inactivity. Therefore, the four inactive elements discussed above could preserve the elemental information of parent material, without being subject to chemical weathering changes (Hodson, Reference Hodson2002; Wang et al., Reference Wang, Liu and Feng2008). The results of cluster analysis suggested that the contents of Rb, Ba, Ti, and Zr were different in the first three CRT clusters, which indicated that the parent material from which those samples formed had variable elemental contents. Furthermore, the first three CRT clusters are distributed in the southern Ulan Buh, the northern Ulan Buh, and the Tengger deserts, respectively (Fig. 4). Thus, the significant content differences of these stable elements among the three CRT clusters reflected the different contents of above elements in the parent material of different areas, which demonstrates that the parent material significantly affects the elemental composition and content among different CRTs.
One noteworthy point is that the CRTs with similar parent material have not been classified into the same cluster. For the Tengger Desert, the CRT samples are distributed into all five clusters, with most of them in the third to fifth clusters, suggesting that other factors could affect the elemental composition and content of CRTs in addition to parent material. According to the analysis above, the Ca, Mg, and Sr elements were enriched along with the precipitation of carbonate during the formation of the CRTs. In addition, CRTs form in soil with a pronounced seasonal moisture regime (Klappa, Reference Klappa1980; Gocke et al., Reference Gocke, Pustovoytov, Kühn, Wiesenberg, Löscher and Kuzyakov2011a; Zamanian et al., Reference Zamanian, Pustovoytov and Kuzyakov2016). Moreover, relatively humid conditions are beneficial to the precipitation of carbonate and the formation of CRTs in this area (Li et al., Reference Li, Li, Ning, Wang, Cheng and Gao2016a; Li et al., Reference Li, Wang, Cheng and Li2016c). Table 1 shows that the elemental enrichment coefficients for CaO, MgO, and Sr between 8–5 cal ka BP were significantly higher than those between 5–2 cal ka BP, about twice, decuple, and triple for the above three elements, respectively. Furthermore, the effective moisture in this area was higher in the middle Holocene (8–5 cal ka BP) than that in the late Holocene (5–2 cal ka BP; Zhang et al., Reference Zhang, Ma, Wünnemann and Pachur2000; Wang et al., Reference Wang, Li, Cheng, Li and Huang2011; Yang et al., Reference Yang, Scuderi, Paillou, Liu, Li and Ren2011; Long et al., Reference Long, Lai, Fuchs, Zhang and Yu2012; Li et al., Reference Li, Wang, Li, Ning, Cheng and Zhao2015b). Thus, the enriched elements (such as Ca, Mg, and Sr) in the CRTs that formed in different periods may have been affected by climate change.
In summary, the elemental composition and content change in the CRTs were mainly affected by parent material and climate. Parent material was the dominant influence in the formation of the CRTs. That is, the elemental composition and the inactive element contents of CRTs were controlled by that of parent material. Even with similar parent material, humidity, and especially soil moisture, content, however, affected the enriched elements (such as Ca, Mg, and Sr) in the CRTs, as well.
In order to verify whether elemental composition and content changes reflect paleoenvironmental conditions in the CRTs, we selected 14 Holocene samples from the Tengger Desert that had relative chronosequence integration, reliable 14C dating results at a millennial resolution (Li et al., Reference Li, Wang, Li, Ning, Cheng and Zhao2015b), and similar parent materials. In order to analyze the paleoenvironmental significance of their elemental compositions, we considered the Mg/Ca, Sr/Ca, and Mg/Sr ratios. In addition, based on an independent sample T test, p-values of the Mg/Ca, Sr/Ca, and Mg/Sr ratios between the middle and late Holocene were 0.085, 0.289, and 0.130, respectively. Although some of the p-values were slightly more than 0.1 (90% confidence interval), they could also reflect the difference between the middle and late Holocene because of the limited sample data. Moreover, climate change throughout the whole Holocene is weak other than that between glacial and interglacial periods.
The Mg/Ca and Sr/Ca ratios in CRT calcites are determined by partition coefficients and composition of the parent solution (Hasiuk and Lohmann, Reference Hasiuk and Lohmann2010). The elemental ratios of soil solution can be modeled by Rayleigh distillation (Elderfield et al., Reference Elderfield, Bertram and Erez1996), and can be expressed as follows:
 $$\eqalignno{[Mg\,/\,Ca]_{{calcite}} &{\equals}D_{{Mg}} {\times}[Mg\,/\,Ca]_{{solution}} \cr&{\equals}D_{{Mg}} {\times}[Mg\,/\,Ca]_{0} {\times}f^{{D_{{Mg}} {\minus}1}} $$
 $$\eqalignno{[Sr\,/\,Ca]_{{calcite}} &{\equals}D_{{Sr}} {\times}[Sr\,/\,Ca]_{{solution}} \cr&{\equals}D_{{Sr}} {\times}[Sr\,/\,Ca]_{0} {\times}f^{{D_{{Sr}} {\minus}1}} $$
where the [Mg/Ca]calcite and [Sr/Ca]calcite are Mg/Ca and Sr/Ca ratios in calcite, DSr and DMg are partition coefficients of Sr and Mg in calcite, and [Mg/Ca]solution and [Sr/Ca]solution are the Mg/Ca and Sr/Ca ratios of the soil solution. The ratios in the initial solution are represented by [Mg/Ca]0 and [Sr/Ca]0. The variable f is the fraction of initial Ca remaining in solution after the precipitation of secondary calcite.
Assuming an unchanging composition of the sandy soil solution, changes in Mg/Ca and Sr/Ca ratios of CRTs are attributed to values of partition coefficients of Mg and Sr in calcite. It seems unlikely, however, that the partition coefficients of Mg and Sr change together with similar magnitude as required by the significantly positive correlation between the Mg/Ca and Sr/Ca ratios of CRTs, giving a correlation coefficient of 0.769, as factors that affect the value of partition coefficients are different for Mg and Sr (Morse and Bender, Reference Morse and Bender1990; Huang and Fairchild, Reference Huang and Fairchild2001; Tang et al., Reference Tang, Köhler and Dietzel2008). Thus, the variation of partition coefficients of Mg and Sr in calcite cannot explain the changes of the Mg/Ca and Sr/Ca ratios of CRTs.
We consider that the Mg/Ca and Sr/Ca ratios of CRTs may largely reflect the composition of soil solution. According to the Rayleigh distillation, changes in Mg/Ca and Sr/Ca ratios of soil solution are affected by Mg/Ca and Sr/Ca ratios in the initial soil solution and the initial Ca remaining in solution after the precipitation of secondary calcite. Considering that the parent material of the Tengger Desert is homogeneous (Li, Reference Li2011), changes of Mg/Ca and Sr/Ca ratios in the initial soil solution should be limited. However, high evaporation rates in the dry desert could trigger CO2 degassing during the transport of soil solution, promoting prior calcite precipitation (Mcdonald et al., Reference McDonald, Drysdale and Hill2004; Cruz et al., Reference Cruz, Burns, Jercinovic, Karmann, Sharp and Vuille2007; Karmann et al., Reference Karmann, Cruz, Viana and Burns2007). In addition, due to the low partition coefficients (≪ 1) of Mg and Sr in calcite (Tang et al., Reference Tang, Köhler and Dietzel2008; Hasiuk and Lohmann, Reference Hasiuk and Lohmann2010), the Mg/Ca and Sr/Ca ratios of the soil solution would be negatively correlated with the residual Ca in soil solution after the prior calcite precipitation. Consequently, higher effective moisture in the Tengger Desert, together with higher soil water content, would result in higher actual evaporation. Subsequently, more Ca would be precipitated from the soil solution, causing a reduction in residual Ca in the soil solution and increasing the Mg/Ca and Sr/Ca ratios in the residual soil solution and then in the CRTs. It was difficult to generate the soil water flow, however, when the effective humidity is relatively lower and the prior calcite precipitation would be weakened. Therefore, the lower effective moisture would ultimately decrease the Mg/Ca and Sr/Ca ratios of CRTs. Hence, the changes of Mg/Ca and Sr/Ca ratios can reflect changes of effective moisture at a millennial resolution in the Tengger Desert. Higher values of these ratios reflect higher effective moisture and vice versa.
Previous studies have found that the partition coefficient for Mg depends on temperature, based on data from a range of experimental (Burton and Walter, Reference Burton and Walter1991; Day and Henderson, Reference Day and Henderson2013) and field studies (Gascoyne, Reference Gascoyne1983; Huang et al., Reference Huang, Fairchild, Borsato, Frisia, Cassidy, Mcdermott and Hawkesworth2001). In contrast, that of Sr appears to remain constant with temperature (Huang and Fairchild, Reference Huang and Fairchild2001; Tang et al., Reference Tang, Köhler and Dietzel2008; Day and Henderson, Reference Day and Henderson2013). For example, the incorporation of Mg into calcite increases by about 5% per 1°C in inorganic calcite (Huang and Fairchild, Reference Huang and Fairchild2001). Therefore, it may be possible to use Mg/Sr ratio as an indicator of paleotemperature, whereby higher Mg/Sr ratios reflect relatively higher temperatures, and vice versa.
Paleoenvironmental significance
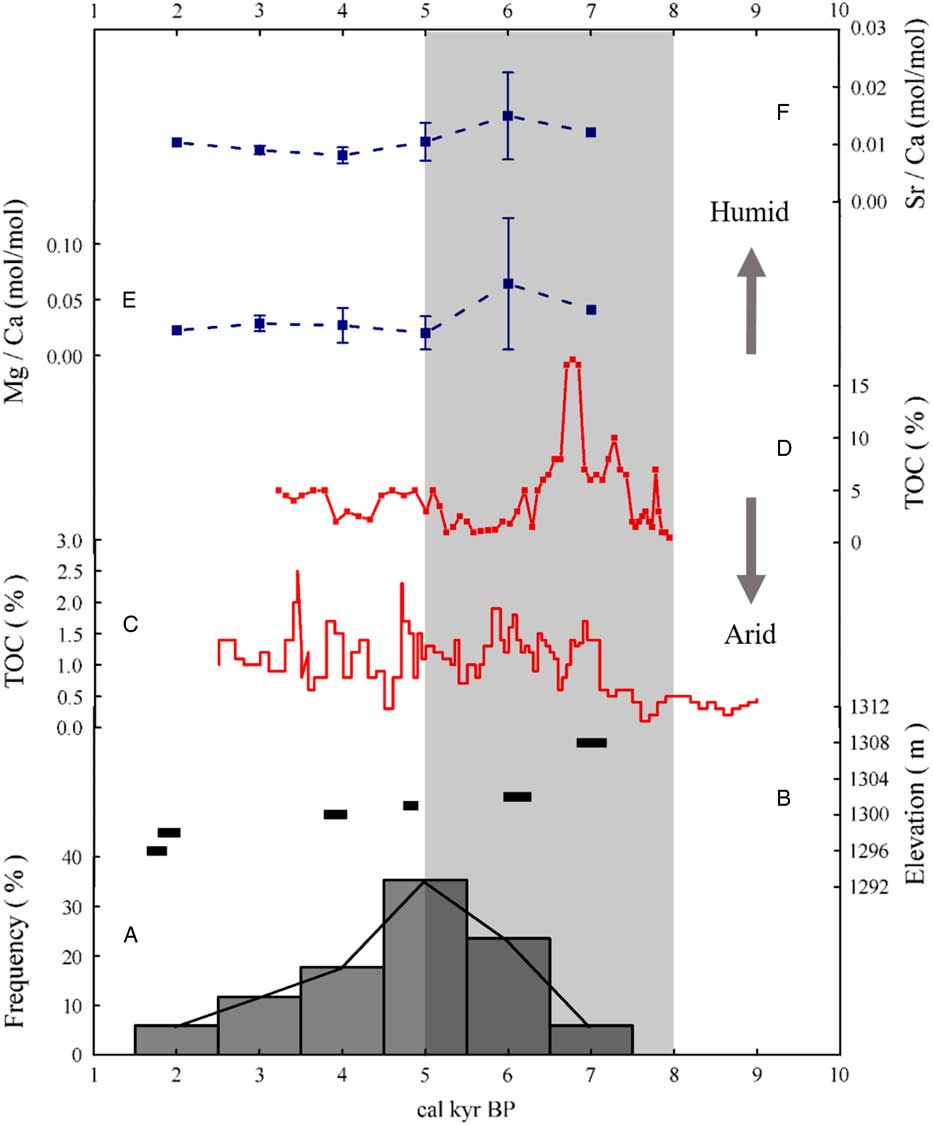
Figure 5 revealed that there were two stages of effective moisture variation in the Tengger Desert during the middle and late Holocene. Stage 1 (8−5 cal ka BP) corresponds to a period of high effective moisture, as reflected by higher ratios of Mg/Ca and Sr/Ca in the CRTs. Stage 2 (5−2 cal ka BP) was a period of low effective moisture, supported by decreased Mg/Ca and Sr/Ca ratios of the CRTs (Fig. 5E and F). To clarify whether the effective moisture records obtained from the CRTs in the Tengger Desert were consistent with other proxy records, we compared our results with other previous results from the Tengger Desert and adjacent regions. The frequency of the CRT distribution in 8−5 cal ka BP period was remarkably higher than that in 5−2 cal ka BP period, which indicated that the effective moisture in the previous period was higher than that in the latter (Fig. 5A; Li et al., Reference Li, Wang, Li, Ning, Cheng and Zhao2015b). Furthermore, the high lake levels of Baijian Lake (Fig. 1), in the northwest Tengger Desert occurred in the middle Holocene, indicating high effective moisture during this period (Fig. 5B; Long et al., Reference Long, Lai, Wang and Li2010; Wang et al., Reference Wang, Li, Cheng, Li and Huang2011). In addition, the total organic carbon content from the QTL section from the Zhuyeze terminal lake (Fig. 1) and the Hongshui River section (Fig. 1) were higher in the 8−5 cal ka BP period (Fig. 5C and D; Zhang et al., Reference Zhang, Ma, Wünnemann and Pachur2000; Long et al., Reference Long, Lai, Wang and Li2010). These reconstruction results indicate that changes of effective moisture at a millennial resolution in this region were consistent. In addition to the above records, grain size, carbonate, C/N, and δ13C of organic matter from QTL section, total pollen content of the QTH02 section in the Zhuyeze terminal lake (Long et al., Reference Long, Lai, Wang and Li2010; Li et al., Reference Li, Wang, Li and Zhang2011) and total pollen content from Hongshui River section (Zhang et al., Reference Zhang, Ma, Wünnemann and Pachur2000) all revealed that the effective moisture was higher between 8 and 5 cal ka BP, while it decreased between 5 and 2 cal ka BP. Therefore, the Mg/Ca and Sr/Ca ratios in CRTs can indicate change in effective moisture in the hinterland of the desert.
(color online) Comparison of the results of our study and other Holocene proxy records in the Tengger Desert and the adjoining region. (A) Frequency of the 14C-dating results for CRTs at the millennial scale in the Tengger Desert (Li et al., Reference Li, Wang, Li, Ning, Cheng and Zhao2015b) . (B) Shoreline elevation of the Baijian Lake (Long et al., Reference Long, Lai, Wang and Li2010). (C) Total organic carbon (TOC) in QTL section from the Zhuyeze terminal lake (Long et al., Reference Long, Lai, Wang and Li2010). (D) TOC in the Hongshui River section (Zhang et al., Reference Zhang, Ma, Wünnemann and Pachur2000). (E and F) Changes of Mg/Ca and Sr/Ca ratios from the CRTs at a millennial resolution in the Tengger Desert (the Sr/Ca ratio quoted from Li et al. Reference Li, Li, Ning, Wang, Cheng and Gao2016a). The units of these ratios were mol·mol-1. Shading indicates the relatively humid period.

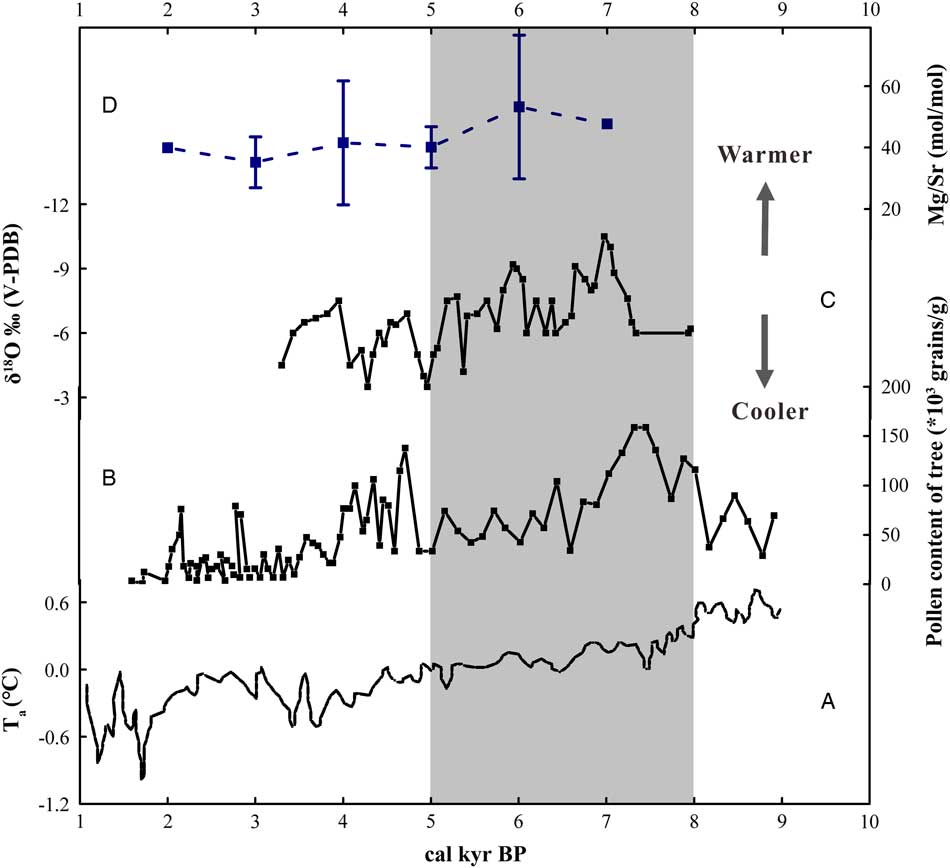
Figure 6 revealed that there were also two stages of temperature variation in the Tengger Desert during the middle and late Holocene. Stage 1 (8−5 cal ka BP) corresponds to a period of relatively higher temperature, as reflected by a higher ratio of Mg/Sr in the CRTs. Stage 2 (5−2 cal ka BP) was a period of relatively lower temperature, supported by a decreased Mg/Sr ratio of the CRTs (Fig. 6D). To clarify whether the temperature variation records obtained from the CRTs in the Tengger Desert were consistent with other proxy records, we compared our results with other previous results from the Tengger Desert and adjacent regions. The mean annual temperature of Hulun Lake region (Fig. 1) reconstructed from pollen analysis in the 8−5 cal ka BP period was relatively higher than that in the 5−2 cal ka BP period (Fig. 6A; Wen et al., Reference Wen, Xiao, Chang and Zhai2011)). Furthermore, pollen percentages and concentrations of trees from Daihai Lake (Fig. 1) were high during the 8−5 cal ka BP period, while the concentrations reached the lowest values in the 5−2 cal ka BP period. This indicates that the temperature during the 8–5 cal ka BP was higher (Fig. 6B; Li et al., 2014). In addition, the value of δ18O of the Hongshui River section was lower in the 8−5 cal ka BP period and increased in 5−2 cal ka BP period, indicating that the temperature decreased from the middle to late Holocene. (Fig. 6C; Zhang et al., Reference Zhang, Ma, Wünnemann and Pachur2000). These reconstruction results indicated that changes of temperature at a millennial resolution in this region were consistent. In addition to the above records, Fang and Hou (Reference Fang and Hou2011) collected 1397 temperature records from the Holocene and established a temperature data set of the Holocene for all of China. Furthermore, Zhao and Yu (Reference Zhao and Yu2012) have also synthetically reconstructed the climate change in the Asian-monsoon margin region based on fossil pollen records from 20 sites with reliable chronologies and high-resolution data. All of the above records revealed that the temperature was higher between 8 and 5 cal ka BP, while it decreased between 5 and 2 cal ka BP. Therefore, the Mg/Sr ratio in CRTs can indicate change of temperature in the hinterland of the desert.
(color online) Comparison of the results of our study and other Holocene proxy records in the Tengger Desert and the adjoining region. (A) The mean annual temperature of the Hulun Lake region reconstructed from pollen analysis (Wen et al., Reference Wen, Xiao, Chang and Zhai2011). (B) Pollen percentages and concentrations of trees from Daihai Lake (Li et al., Reference Li, Jie, Ji, Weng, Zhao and Sun2004). (C) The value of δ18O of the Hongshui River section (Zhang et al., Reference Zhang, Ma, Wünnemann and Pachur2000). (D) The change of Mg/Sr ratio from the CRTs at a millennial resolution in the Tengger Desert. The unit was mol·mol-1. Shading indicates the middle Holocene.

Mechanisms possibly forcing climate change
The Holocene moisture pattern of the Tengger Desert is consistent with that in the Asian monsoon margin of northwestern China. The northern boundary of the Asian summer monsoon, between the margin of the north Qinghai–Tibet Plateau and the Tianshan Mountains in Xinjiang during the Holocene (Herzschuh, Reference Herzschuh2006; Chen et al., Reference Chen, Yu, Yang, Ito, Wang, Madsen, Huang, Zhao, Sato and Birks2008), will move with long-term climate change (Li et al., Reference Li, Wang, Li, Zhou and Zhang2013; Wang et al., Reference Wang, Li, Li and Cheng2013). Thus, strong summer monsoons could bring abundant precipitation in the entire desert belt of northern China (Wang et al., Reference Wang, Li, Cheng, Li and Huang2011). In addition, simulation results indicated that low winter solar insolation and high summer cloud cover triggered low evaporation in the Central and East Asia between 8 and 5 cal ka BP (Li and Morrill, 2010). Hence, higher monsoon precipitation and lower evaporation may have caused the most humid environment between 8 and 5 cal ka BP. Since then, the effective moisture in the Tengger Desert appears to have decreased, which is in response to the orbitally induced decrease in summer insolation (Long et al., Reference Long, Lai, Wang and Li2010). The Holocene temperature pattern of this area could be driven by Northern Hemisphere summer insolation (Kutzbach and Guetter, Reference Kutzbach and Guetter1986). In addition, the colder late Holocene could be linked to the strengthening of the Westerlies dominated by the polar high-pressure system associated with high-latitude ice sheets (Li et al., Reference Li, Jie, Ji, Weng, Zhao and Sun2004). However, the specific driving mechanisms still need further research based on more field data and simulation results.
CONCLUSION
Major- and trace-element compositions of CRTs in the Alashan Desert vary in content among regions. Ca, Mg, Sr, and P were significantly enriched in the CRTs, whereas the other elements were only weakly enriched. In addition, Ca, Mg, and Sr were enriched along with the precipitation of carbonate during the formation of the CRTs, indicating that the formation mechanism of CRTs determined the enrichment of these elements. In contrast, the enrichment of P was likely related to the growth of plants.
Change in elemental composition and content were controlled by the parent material of CRTs and the climatic conditions when the CRTs formed. The three elements enriched in the CRTs—Ca, Mg, and Sr—were significantly affected by climate. The ratios of Mg/Ca and Sr/Ca from CRTs were interpreted as a proxy of effective moisture and that of Mg/Sr was a proxy of temperature. The Mg/Ca and Sr/Ca ratios from CRTs in the 8−5 cal ka BP period were higher than those in the 5−2 cal ka BP period, signaling a decrease in effective moisture from the middle Holocene to late Holocene in the Tengger Desert. At the same time, the Mg/Sr ratio from CRTs in the 8−5 cal ka BP period was also higher than that in the 5−2 cal ka BP period, indicating a decrease in temperature from the middle Holocene to late Holocene in the Tengger Desert. The reconstruction results were consistent with other previous reconstruction results from lake sediments, which indicated that CRTs are valuable archives of past climatic change and environmental evolution in the hinterland of the desert. Also, changes in the Mg/Ca, Sr/Ca, and Mg/Sr ratios of CRTs can reflect changes of paleo-effective moisture and paleotemperature at a millennial resolution in the Tengger Desert.
ACKNOWLEDGMENTS
The authors thank Dr. Kathleen Johnson, Dr. Matthew Lachniet, Dr. Nicholas Lancaster, Dr. Hucai Zhang, and the anonymous reviewers for their constructive comments, which led to significant improvement of this manuscript. This study was supported by the National Natural Science Foundation of China (No. 41530745 and 41771211) and the Open Fund of Shandong Provincial Key Laboratory of Depositional Mineralization and Sedimentary Minerals (DMSM2017016).
SUPPLEMENTARY MATERIAL
To view supplementary material for this article, please visit https://doi.org/10.1017/qua.2018.80